A-Level Economics Theme 2 flashcards
1/305
Earn XP
Description and Tags
up to 2.6.4 - Conflicts and trade offs between objectives and policies
Name | Mastery | Learn | Test | Matching | Spaced | Call with Kai |
|---|
No analytics yet
Send a link to your students to track their progress
306 Terms
Ways to measure economic growth
Rate of change of real GDP
Gross National Income (GNI)
Rate of change of real GDP
the change in the gross domestic product
adjusted for inflation
Rate of change of real GDP = (change in gdp / original gdp) x 100
GDP
the value of all the goods and services a country produces added together
Economic growth
the percentage change in a countries real gdp from one period to the next
Gross National Income (GNI)
the GDP and net income from abroad added together (e.g. profits, dividends UK firms earn overseas subtracting the income paid to foreign firms here)
GNI equation
GNI = GDP + Net Primary Income + Net Secondary Income
Net primary income (NPI)
includes wages, salaries and other income earned by a countries residents working abroad as well as earnings from foreign investments such as dividends and interest
Net secondary income
the transfers of money between countries, such as remittances from foreign workers to their families in their countries or international aid
Nominal GDP
GDP measured in today's prices
if price rises nominal GDP doesn’t increase even if output doesn’t
Total GDP
the whole economy’s output (usually in billions of pounds)
GDP per Capita
GDP per person
GDP per capita = Total GDP / total population
Shows average income / wealth
Volume
refers to the quantity of goods/services produced ignoring price change
Closely linked to real GDP
Value
money terms
price x quantity
Unemployment
somebody without a job who is actively looking for work
Under-employment
have paid work, but fewer hours or lower skill use than you’d like, so you’re ‘partly employed’
Employment rate
employed people as a percentage of the working age population (usually 18-64)
Higher employment means more people earning and paying taxes, therefore stronger economic growth, lower welfare spending
Lower employment means lost output, therefore potentially ‘damaging’ effects on workers out of work too long (skills erosion)
Unemployment rate equation
Unemployment rate = unemployed people (ILO definition) / economically active population
Economically active population = employed + unemployed
Indicates spare capacity in labour market
High unemployment - lower consumer spending
Inflation
sustained rise in general price level
hyperinflation
an extreme rise in general price level, when prices skyrocket (double every month more)
Disinflation
inflation is still happening, but the pace is slowing
Deflation
sustained decrease in general price level
Inflation expectations
predictions of inflation in the future
Stagflation
stagnant economic growth paired with high inflation and high unemployment
Consumer price index (CPI)
tracks a fixed ‘shopping basket’ of goods and services
Calculating CPI
Basket Selection - ONS surveys families to see what people spend their money on
Price collection - each month prices for every item in the basket are gathered from supermarkets, online retailers, service providers, etc.
Indexing - each item gets a weight based on how much of household budgets it takes up
Formula - CPI today = (cost today / cost in base year) x 100
Limitations of CPI
substitution bias
quality changes
household differences
new goods
errors / inaccuracies
digital economy
Substitution bias (CPI)
consumers switch to alternatives when cost increases too much, but the CPI continues measuring the original, overstating true cost rises
Quality changes (CPI)
CPI counts a rise in cost as inflation, but does not account the improvement in quality compared to previous goods
Household differences (CPI)
different households in different areas have different spending habits and needs, with CPI being an average, it doesn’t account for everyone.
New goods (CPI)
takes time for a new good to enter the basket, therefore CPI may ignore its effect on modern spending patterns
Errors/inaccuracies CPI
sampling errors in data from surveys can affect CPI
Digital economy (CPI)
Many of the services in the digital economy do not have a price
Challenges in measuring inflation
quality adjustments
Basket of goods and services
substitution bias
subgroups and demographics
geographic variations
Quality adjustments (CPI)
CPI must make quality adjustments to account for quality changes, which can be subjective and challenging to quantify accurately
Basket of goods and services (CPI)
consumer preferences evolve over time and the basket may not always accurately reflect what people are buying
Substitution bias (CPI)
consumers tend to adjust their spening patterns in response to price changes
Subgroups and demographics (CPI)
CPI represents an average consumer, and the inflation experience can vary among groups, such as age, income, urban vs rural, etc.
Geographic variation (CPI)
the CPI is typically a national measure and may not capture regional variations in prices effectively
Measures of unemployment
claimant count
Labour force survey (ILO measure)
Claimant count
a headcount of people who are unemployed and claiming Jobseeker’s Allowance (JSA) or universal credit on grounds of unemployment
Labour force survey (ILO Measure)
survey based measure compiled by the UK’s ONS, asks for representative sample of the population, whether in the last four weeks they have been:
Without a job
Actively sought work in the last four weeks and ready to start work in the next two weeks
Claimant count pros
Quick
Available monthly
Easy to track short term changes
Claimant count cons
Excludes anyone not eligible for benefits (e.g. higher income previous earners, students)
Underestimates true unemployment
Labour force survey (ILO measure) pros
Includes a broader set of unemployed people whether or not they claim benefits
International standard
Labour force survey (ILO measure)
only comes out quarterly
With a lag
‘Noisier’ - sampling errors
Inactivity rate
the amount of people that are not employed and not actively seeking employment compared to the working age population
E.g students, retirees,
A rising inactivity rate can hide true joblessness - people may stop looking, drop out.
Inactivity rate equation
Inactivity rate = inactive population / working age population
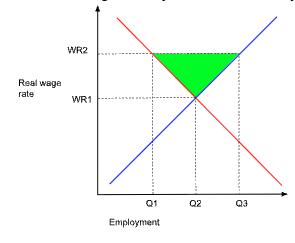
ideal real wage graph - labour market at equilibrium
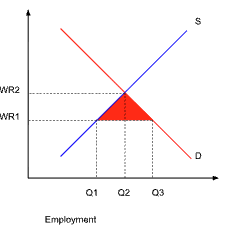
unideal real wage graph - labour market with minimum wage above equilibrium
Causes of unemployment
structural unemployment
frictional unemployment
seasonal unemployment
demand-deficiency unemployment (cyclical unemployment)
Hidden unemployment (disguised unemployment)
Real wage inflexibility
Structural Unemployment
long term mismatch between workers’ skills (or locations) and the jobs available
Happens when industries evolve or move (e..g automation, offshoring), leaving former workers without the right skills or too far from new job hubs
E.g coal mining towns hit by mine closures; miners’ skills don’t match new tech jobs
Frictional unemployment
Short term “between jobs” unemployment as people search or transition
Happens due to first job hunting and switching roles
E.g. graph design graduate spends three months applying, interviewing, and waiting to start their first position
Seasonal unemployment
regular, predictable unemployment at certain times of the year
Businesses whose demand fluctuates with seasons
E.g. farmworkers laid off after harvest
Demand-deficiency unemployment (cyclical unemployment)
Job losses when overall demand in the economy falls below firms needs
Happens due to recessions or downturns reduce consumer spending and business investment
Disguised unemployment (hidden unemployment)
where workers are employed in low productivity roles that do not enhance overall economic output
commonly occurs in developing nations with large labour surpluses in informal agricultural sectors
People who are visibly employed but are actually unemployed
Real-wage inflexibility
wages stay above the equilibrium, causing excess labour supply
Happens when minimum-wage laws, strong unions or firms’ reluctance to cut nominal wages - wages not adjusted for inflation
Real wage inflexibility graph (union minimum wage graph)
Migration significance
Boosts labour supply - can fill shortages
Alters unemployment rate - may temporarily raise local unemployment rates if migrants and locals compete for the same jobs; but often migrants create demand by spending incomes
Examples of migrant significance
healthcare, hospitality industries
eastern european migrants in EU expansion (2004)
Skills significance
Match quality - better trained workers fit roles more quickly and productively
Lifelong learning - upskilling reduces structural unemployment
Examples of skills significance
government funded apprenticeships in digital tech help displace manufacturing workers retrain for programming roles
Effect of unemployment on firms
Lower sales, leading to cost cutting, potential further layoffs
Lower wage pressures (bargaining power shifts towards employers)
Effect of unemployment on consumers
lower income - reduced spending and living standards
Increased financial stress and debt
Effect of unemployment on workers
scarring (loss of skills) if unemployed for a long period of time
Mental health issues
Reduced career progression
Effect of unemployment on government
higher welfare spending (benefits, retraining schemes)
lower tax revenues (income, sales tax)
potential budget deficits
Effect of unemployment on society
increased crime rates in areas of high unemployment
social exclusion family stress
political unrest or loss of trust in institutions
Balance of payments
a record of all financial dealings over a period of time between economic agents of one country and all other countries
Consists of current account and capital account and financial account
Current account
records payments for the purchase and sale of goods and services
Components in current account
Trade in goods
Trade in services
Primary income
Secondary income
Trade in goods (current account)
physical items (e.g. cars, phones oil)
Export of goods → money coming in
Imports of goods ← money going out
Trade in services
intangible things (e.g. tourism, banking or education)
Export of services → money coming in
Imports of services ← money going out
Primary income
earnings on investments and wages from abroad (e.g. a UK resident earning dividends on a US share)
→ money coming in
Secondary income
transfers like foreign aid or remittances (money sent home from workers abroad)
← money going out
Surplus
total money coming in is greater than total money going out
E.g. Saudi Arabia has a surplus on oil due to being a major oil exporter and sells more oil abroad than it buys
Deficit
total money coming in is less than total money going out
E.g. UK runs a deficit on goods, as it imports more manufactured products than it exports, though it might have a surplus on services
Deficits or surpluses affecting other macroeconomic goals
growth of jobs
inflation
exchange rates
debt and stability
deficit/surplus affecting growth of jobs
running a big goods deficit can mean fewer domestic factories and jobs, unless the deficit is offset by strong services export
deficit/surplus affecting inflation
if imports are high, currency might stay stronger (making imports cheaper, which helps keep prices down). But a weaker currency makes imports more expensive, feeding inflation
deficit/surplus affecting exchange rates
persistent deficits can weaken a currency over time; a weak currency can boost exports but make imports pricier
deficit/surplus affecting debt and stability
if you borrow from abroad to cover a deficit, that shows up in the financial account and can lead to rising foreign debt servicing that debt later can drag on income
Interconnectedness of economies
supply chains
trade agreements
currency moves
supply chains
a problem in any one place can cause a ripple to all (e.g. a factory shutdown).
This is because a car assembled in Britain may use steel from Germany, electronics from Japan and software from India
Trade agreements
Rules and tariffs can change who you buy from and sell to. If the EU raises a tariff on UK exports, that can cut Britain’s goods exports and deepen a deficit
Currency moves
a slump in one big economy can weaken its currency, making its exports cheaper and yours relatively more expensive shifting trade balances all around the world
Current account balance equation
Current account balance = (exports - imports of goods) + (exports - imports of services) + (net income) + (net transfers)
If current account balance is positive - it is a surplus
If current account balance is negative - it is a deficit
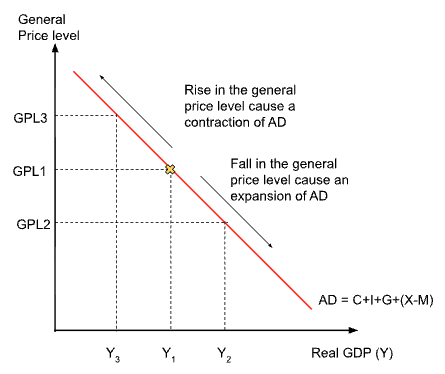
Aggregate demand (AD)
the total spending on a country’s goods and services at different price levels
Aggregate demand (AD) formula
AD = C + I + G + (X-M)
C - consumption
I - Investment
G - Government spending
(X-M) - net exports
X - exports
M - imports
Consumption (AD)
what households spend on goods and services (e.g. food, clothing, Netflix subscriptions)
Investment (AD)
what firms (and sometimes households) spend on things that will help produce in the future (e..g factories, machinery, new houses)
Government spending (AD)
what local and central government spend on schools, hospitals, roads and the armed forces
Consumption significance and effects
around 60-70% of AD, makes up the largest share, around ⅔ of GDP in advanced economies. Because consumption is so big, small changes in household confidence can more overall AD a lot
When people feel secure about their jobs and incomes, they buy more.
(e.g. Christmas, C surges as families spend on gifts and travel)
Investment significance and effects
around 10-15% of AD, more volatile, if businesses expect higher sales, they might build a new factory or upgrade equipment. Investment, although smaller, matters for long run growth, as it increases productive capacity
(e.g. 2020, UK firms delayed infesmtent because of brexit and Covid uncertainty, causing I to fall)
Government significance and effects
around 20-25% of AD, fairly stable, but can jump in a crisis
(e.g. furlough scheme in 2020-21 and road building projects)
Net exports significance and effects
around +5% to -5% depending on trade balance, can swing with the exchange rate and global demand. A stronger pound makes imports cheaper (M up), exports dearer (X down), so net exports fall; and vice versa.
Reasons for AD sloping down
interest rate effect
wealth effect
exchange rate effect
interest rate effect (AD)
At higher average price (AP) levels, there are likely to be higher interest rates. Higher interest rates reduce investment and are an incentive for households to save - and vice versa
Wealth effect (AD)
As average price (AP) increases, the purchasing power of households decreases and the AD falls - and vice versa
exchange rate effect (AD)
As AP falls, interest rates are likely to fall too. Lower interest rates lower the exchange rate. With a lower exchange rate, the economy's goods/services are more attractive abroad and exports increase, thereby increasing real GDP
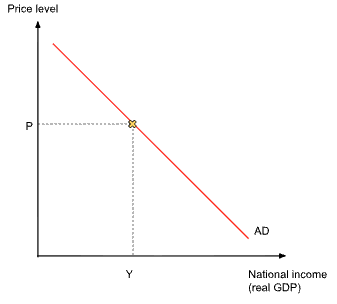
AD Graph
Downward sloping line shows that as the overall price level falls, people can buy more (Their money goes further), exports become more competitive and interest rates tend to fall, spurring investment and consumption
Movement along AD curve
happens when price level itself changes and spending adjusts