3.1.2: Limitation of physical measurements
1/38
There's no tags or description
Looks like no tags are added yet.
Name | Mastery | Learn | Test | Matching | Spaced | Call with Kai |
|---|
No analytics yet
Send a link to your students to track their progress
39 Terms
What causes random errors in measurements? (2)
- Random errors in measurements are caused by unpredictable factors such as electronic noise in circuits.
- They can also be caused by the failure to keep controlled variables exactly stable.
How do random errors affect measurements? (1)
Random errors affect precision by causing values to vary around the mean.
How can random errors be reduced? (1)
Random errors can be reduced by taking at least 3 repeats and calculating a mean to ensure precision and identify anomalies.
What methods help reduce human timing error in measurements? (1)
Methods which could help reduce human timing error include the use of computers, data loggers and cameras to reduce timing errors and allow smaller intervals.
What causes systematic errors in experiments? (1)
Systematic errors are caused by faults such as zero error or parallax error.
How do systematic errors affect results? (1)
Systematic errors affect accuracy by causing consistent deviation from the true value.
How can you check for and reduce systematic errors? (2)
- To check for and reduce systematic errors you can calibrate instruments using a known value.
- Such as weighing a 1 kg mass.
What methods reduce systematic errors in experiments? (3)
- Correcting for background radiation ensures that extraneous sources do not affect the results.
- Reading measurements at eye level minimises parallax error.
- Using and maintaining controlled variables ensures consistent experimental conditions.
What is meant by precision in measurement? (2)
- Precision refers to how consistent a set of measurements are.
- It is indicated by a small variation around the mean value.
What is repeatability in experiments? (1)
Repeatability refers to the ability of the same experimenter, using the same method and equipment, to obtain the same results under the same conditions.
What is reproducibility in experiments? (1)
Reproducibility refers to the ability of a different experimenter, using different equipment or methods, to obtain the same results as the original experiment.
What is meant by resolution in measurements? (1)
Resolution refers to the smallest change in a quantity that can be detected or shown by a measuring instrument.
What does accuracy describe in a measurement? (1)
Accuracy describes how close a measurement is to the true or accepted value.
What should be done with anomalous results in experiments? (1)
Anomalous results should not be included when averages of data are taken.
What is absolute uncertainty? (1)
Absolute uncertainty is expressed as a fixed quantity, e.g. 5.0 ± 0.6 A.
What is fractional uncertainty? (1)
Fractional uncertainty is expressed as a fraction of the measurement, e.g. 3 ±3⁄35 N.
What is percentage uncertainty? (1)
Percentage uncertainty is expressed as a percentage of the value, e.g. 2 ± 10.2% m/s.
How is the percentage uncertainty of a measurement calculated? (2)
- The percentage uncertainty of a measurement is calculated by finding the absolute uncertainty of a measurement and dividing this by the measured value.
- Then multiply the value by 100 to find the percentage uncertainty.
What is the uncertainty in a single reading? (1)
Uncertainty in a single reading is ± half the smallest division on the instrument.
What is the uncertainty in a measurement from two points? (1)
Uncertainty in a measurement from two points is at least ± 1 smallest division, e.g. ± 0.5 mm from each end gives ± 1 mm total.
How is uncertainty determined for a digital reading? (1)
Uncertainty for a digital reading is either stated or assumed to be ± the last significant digit.
How is uncertainty determined from repeated data? (1)
Uncertainty from repeated data is calculated as half the range: mean ± (range ÷ 2).
How does fixing one end of a ruler reduce uncertainty? (2)
- Fixing one end of the ruler means only one measurement reading is required.
- This reduces uncertainty because only a single measurement uncertainty is involved instead of two.
How does averaging multiple instances reduce uncertainty? (2)
- Averaging multiple measurements reduces the overall uncertainty by dividing it across the number of instances.
- For example, timing 10 swings as 10.2 ± 0.1 seconds gives an average time per swing of 1.02 ± 0.01 seconds, lowering the uncertainty per swing.
How does measuring large values reduce uncertainty? (2)
- Measuring larger values reduces the percentage uncertainty because the absolute uncertainty is divided by a bigger number.
- As a result, the relative or percentage uncertainty becomes smaller, improving the measurement's precision.
How should uncertainties be given with regard to significant figures? (1)
Uncertainties must be reported with the same number of significant figures as the measured value.
How are uncertainties combined when adding or subtracting? (2)
- When adding or subtracting measurements, their absolute uncertainties are added together.
- For example, 3 ± 0.5 A and 6 ± 0.5 A results in 3 ± 1 A for the difference.
How are uncertainties combined when multiplying or dividing? (2)
- When multiplying or dividing measurements, the percentage uncertainties of each value are added together.
- For example, 91 ± 3 N ÷ 7.0 ± 0.2 kg results in 3.3% + 2.9% = 6.2% total uncertainty.
How is uncertainty calculated when a value is raised to a power? (2)
- When a value is raised to a power, the percentage uncertainty is multiplied by that power.
- For example, 5 ± 0.3 cm gives 6% uncertainty; squared becomes 12%, so area = 78.5 ± 12% cm².
What is an error bar? (2)
- Error bars are vertical or horizontal lines on a graph.
- They extend from data points and show the range the point is likely to lie in.
How are uncertainties shown on a graph? (1)
Uncertainties are shown as error bars on each side of the data point.
What do error bars look like on a graph? (2)
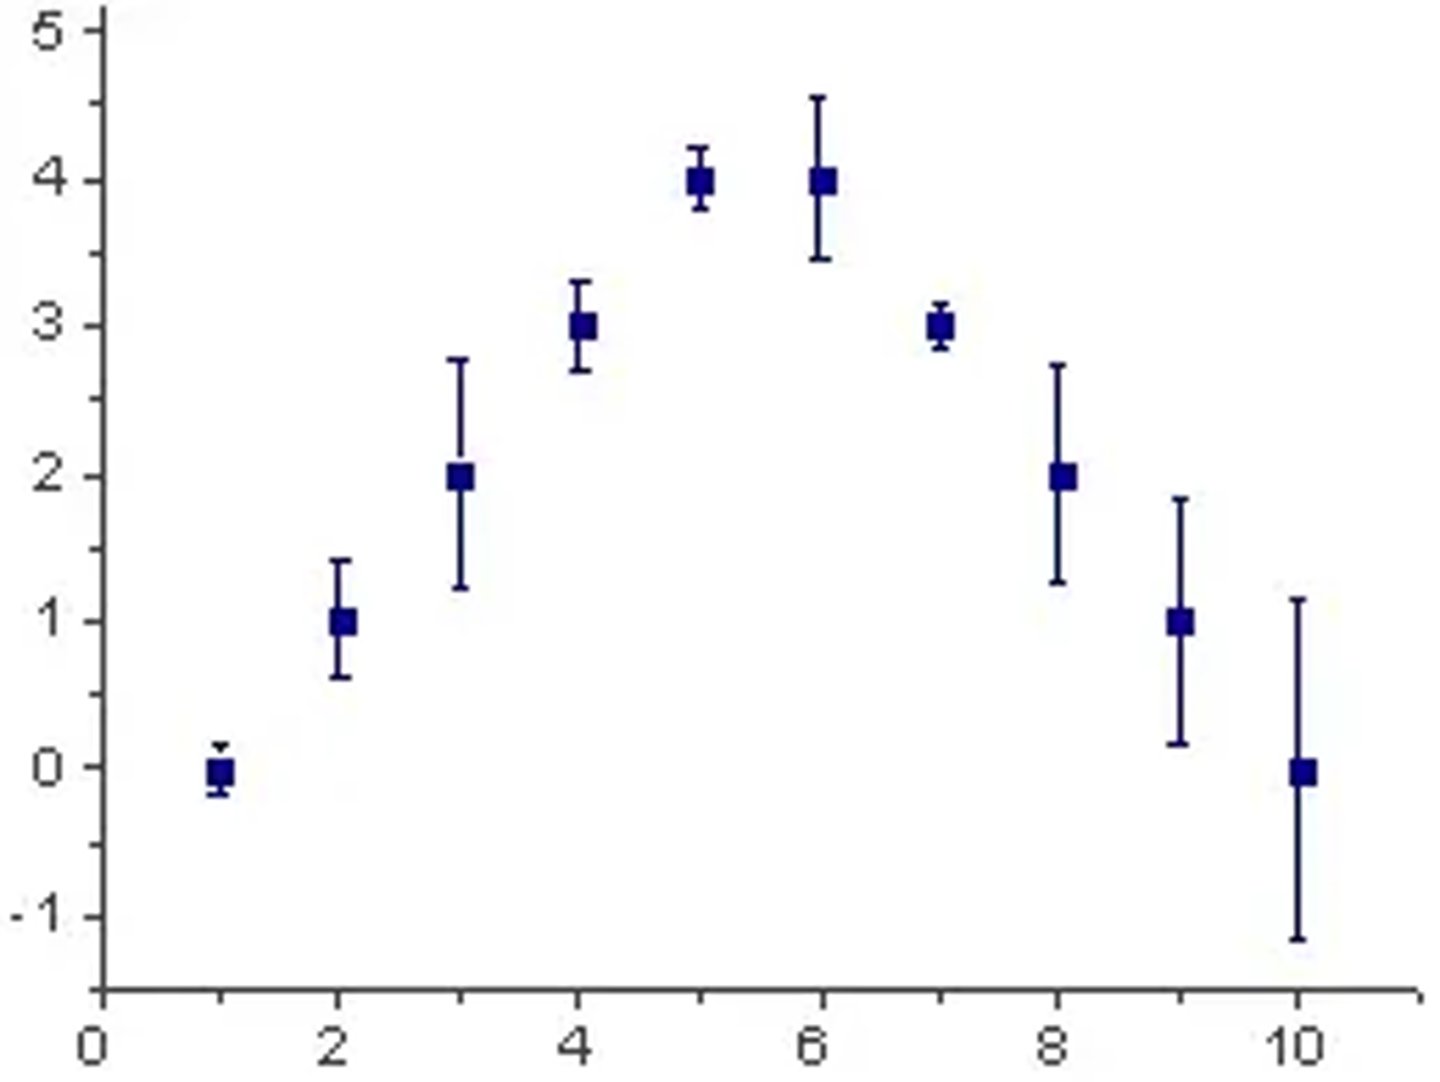
How should a best-fit line behave in relation to error bars? (1)
A best-fit line should pass through all error bars and exclude anomalies.
How are lines of worst fit drawn? (2)
- Lines of worst fit are drawn as two lines that each pass through the error bars on a graph.
- These lines represent the maximum and minimum possible slopes for the data.
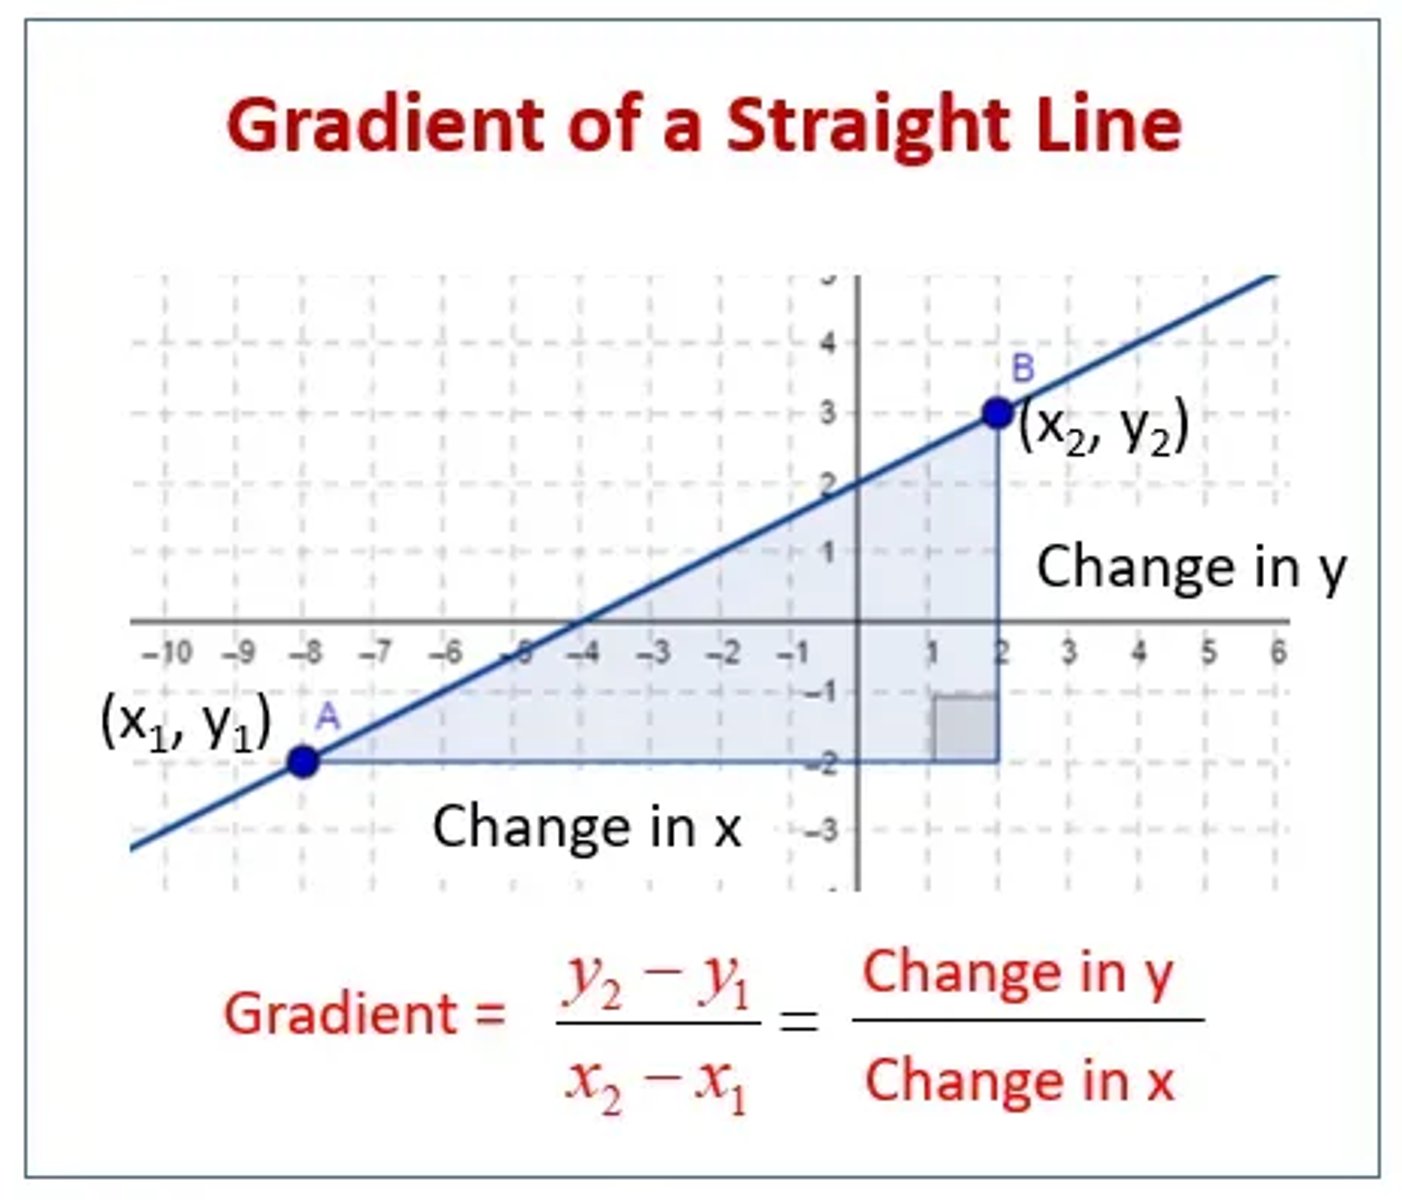
How is the gradient on a graph found? (2)
- To find the gradient, you should draw a large triangle between 2 data points on the graph, and then calculate the change in y / change in x.
- The value of the gradient should have appropriate units.
What does finding the gradient on a graph of data points look like? (2)
How do you calculate percentage uncertainty in gradient from a graph? (1)
To calculate the percentage uncertainty in the gradient from a graph, use the best-fit and worst-fit lines and the formula
percentage uncertainty = (|best gradient − worst gradient| ÷ best gradient) × 100%.
How is the uncertainty in the y-intercept from a graph calculated? (1)
The uncertainty in the y-intercept from a graph is calculated using the best-fit and worst-fit lines with the formula
percentage uncertainty = (|best y-intercept − worst y-intercept| ÷ best y-intercept) × 100%.
What is an alternative method for calculating percentage uncertainty in gradient? (1)
An alternative method for calculating percentage uncertainty in gradient is to use the formula
percentage uncertainty = ((maximum gradient − minimum gradient) ÷ 2) × 100%.