Ice sheets & Glaciers (Greenland) - Final Exam prep
1/20
There's no tags or description
Looks like no tags are added yet.
Name | Mastery | Learn | Test | Matching | Spaced |
|---|
No study sessions yet.
21 Terms
Local response to melting glaciers and ice sheets (ilulissat hydroelectric project)
aim: replace diesel generated energy in green energy
uses meltwater coming from permafrost layers and glaciers
Located in west Greenland
started in September 2013
produced energy for ilulissat (pop of 4,500)
plants capacity is 22.5 megawatts
45k’s NE of town
turbines are as deep as 200m below surface
provides 20-30% of greenlands power
funded by gov
clean energy = less heat and less reliance on fossil fuels
National response to melting glaciers and ice sheets (tourism)
introduced in 2021 and ran throughout 2021-2024, post pandemic
aims to rebuild tourism post-covid-19 to distribute tourism seasonally and geographically
interconnected with broader national tourism to open new and larger
airports in ilulissat and nuuk
global tourism is projected to geow 13.3% per year from 2019-2026
Global response to melting glaciers and ice sheets (COP)
Conference of parties
under the UN framework convention on climate change (UNFCCC)
made up of 200 countries as of 2024
aims: to limit climate change at 2oC above pre-industrial levels
avg temp as risen 1.5oC since 1850 - more manageable than 2oC
Europe greenhouse gas pollution dropped by 18% in 2024
COP 26 (2021) was last chance to save planet from effects of more than 1.5oC warming
2015 Paris agreement was first time countries held themselves accountable - legally binding
Geospatial response to melting glaciers and ice sheets (PROMICE)
began in 2007 - 18 years of solid data now
ran by the department of glaciology and climate at the geological survey of Denmark and Greenland
monitors/assess’:
ice thickness
ice extent
signs of ice loss
mass loss on ice sheet specifically
change in ice sheet over time as a result of global warming
done by:
airborne surveys to gather data using LIDAR & RADAR (Light/Radio detection and ranging)
GNSS units used to measure ablation
automatic weather stations in Greenland
keeps well documented and open source database
Location (Absolute and Relative)
71.7o N, 42.6o W
In the north Atlantic ocean, off northeastern coast of Canada
Human characteristics
Speak greenlandic and Danish
pop concentrated on southwest coast
0.14 people per km2
56,000 population
major cities: Nuuk, sisjimiut & ilulissat
self governed
Geographic characteristics
Geologically apart of North America
1.71 million km2
80% ice
avg thickness of ice is 2km
max thickness is over 3km, central east
10% of earths ice
10% of earths freshwater
ice per km2 is 1.7
215 glaciers
HCO (Holocene climactic optimum)
warm period from 9,000-5,000 years ago, started 15,000 years ago after age age (glacial termination)
large ice sheets covering NA and Europe started melting
event consisted of 4oC increase near north pole
southern Europe experienced cooling
avg temp change declines rapidly due to latitude
why?
Milankovitch cycles - change in earths orbit = increased solar radiation in the horthern hemisphere
Greenhouse gas levels - co2 & methane concentration in the atmosphere began to rise due to human activities (deforestation & agriculture)
compared to today
temps warmer than now
tropics and parts of southern hemisphere were cooler than average
LCM (Last Glacial Maximum)
18,000-20,000 years ago
last ‘ice age’ where land ice was dominant
8% (today is 3% )of world surface was covered by ice (including land & sea ice)
25% (today is 3%) of earths land surface was covered in ice
sea level was approximately 112-125cm lower than today
surface temp was 4-6oC colder than average median temp
Cooling was distributed unevenly
Antarctica stayed the same
North Pole changed - ice formed over land meaning it melted quicker
forest cover was less expensive, climate caused cooler and drier rainfall
grassland became more widespread
africa had grasslands in the south & deserts in the north (closer to equator)
aisa had a mix of tropical deserts in the west, alpine deserts in the north
grasslands in indian subcontinent
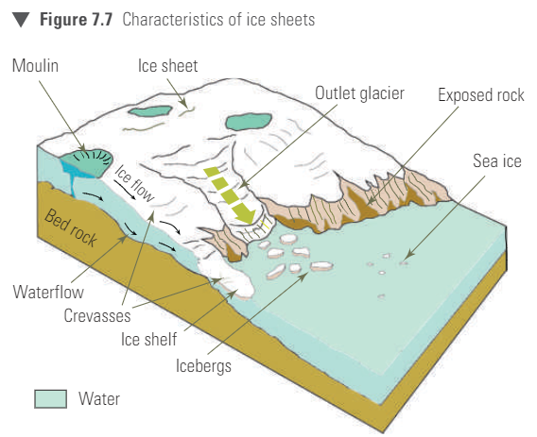
Anatomy of an Ice Sheet
Outlet Glacier
Ice Shelf
Icebergs
Exposed rock
Sea Ice
Moulin
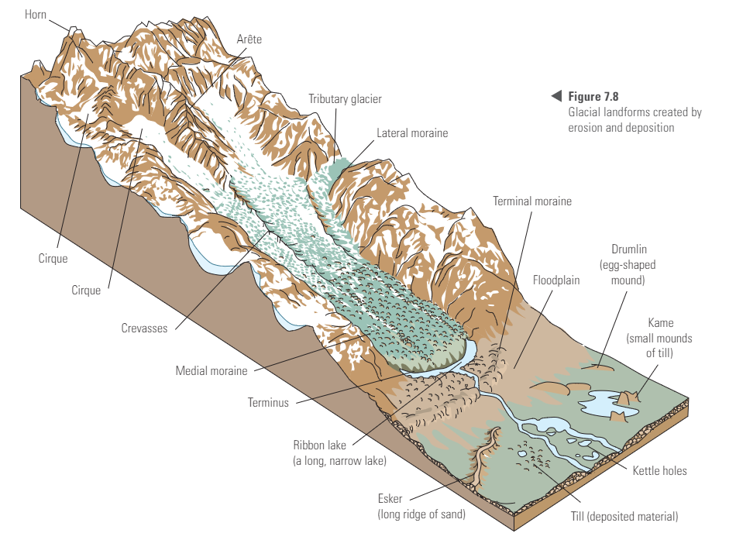
Anatomy of a Glacier
Horn
Arete
Terminal moraine
maternal moraine
Cirque
Calving
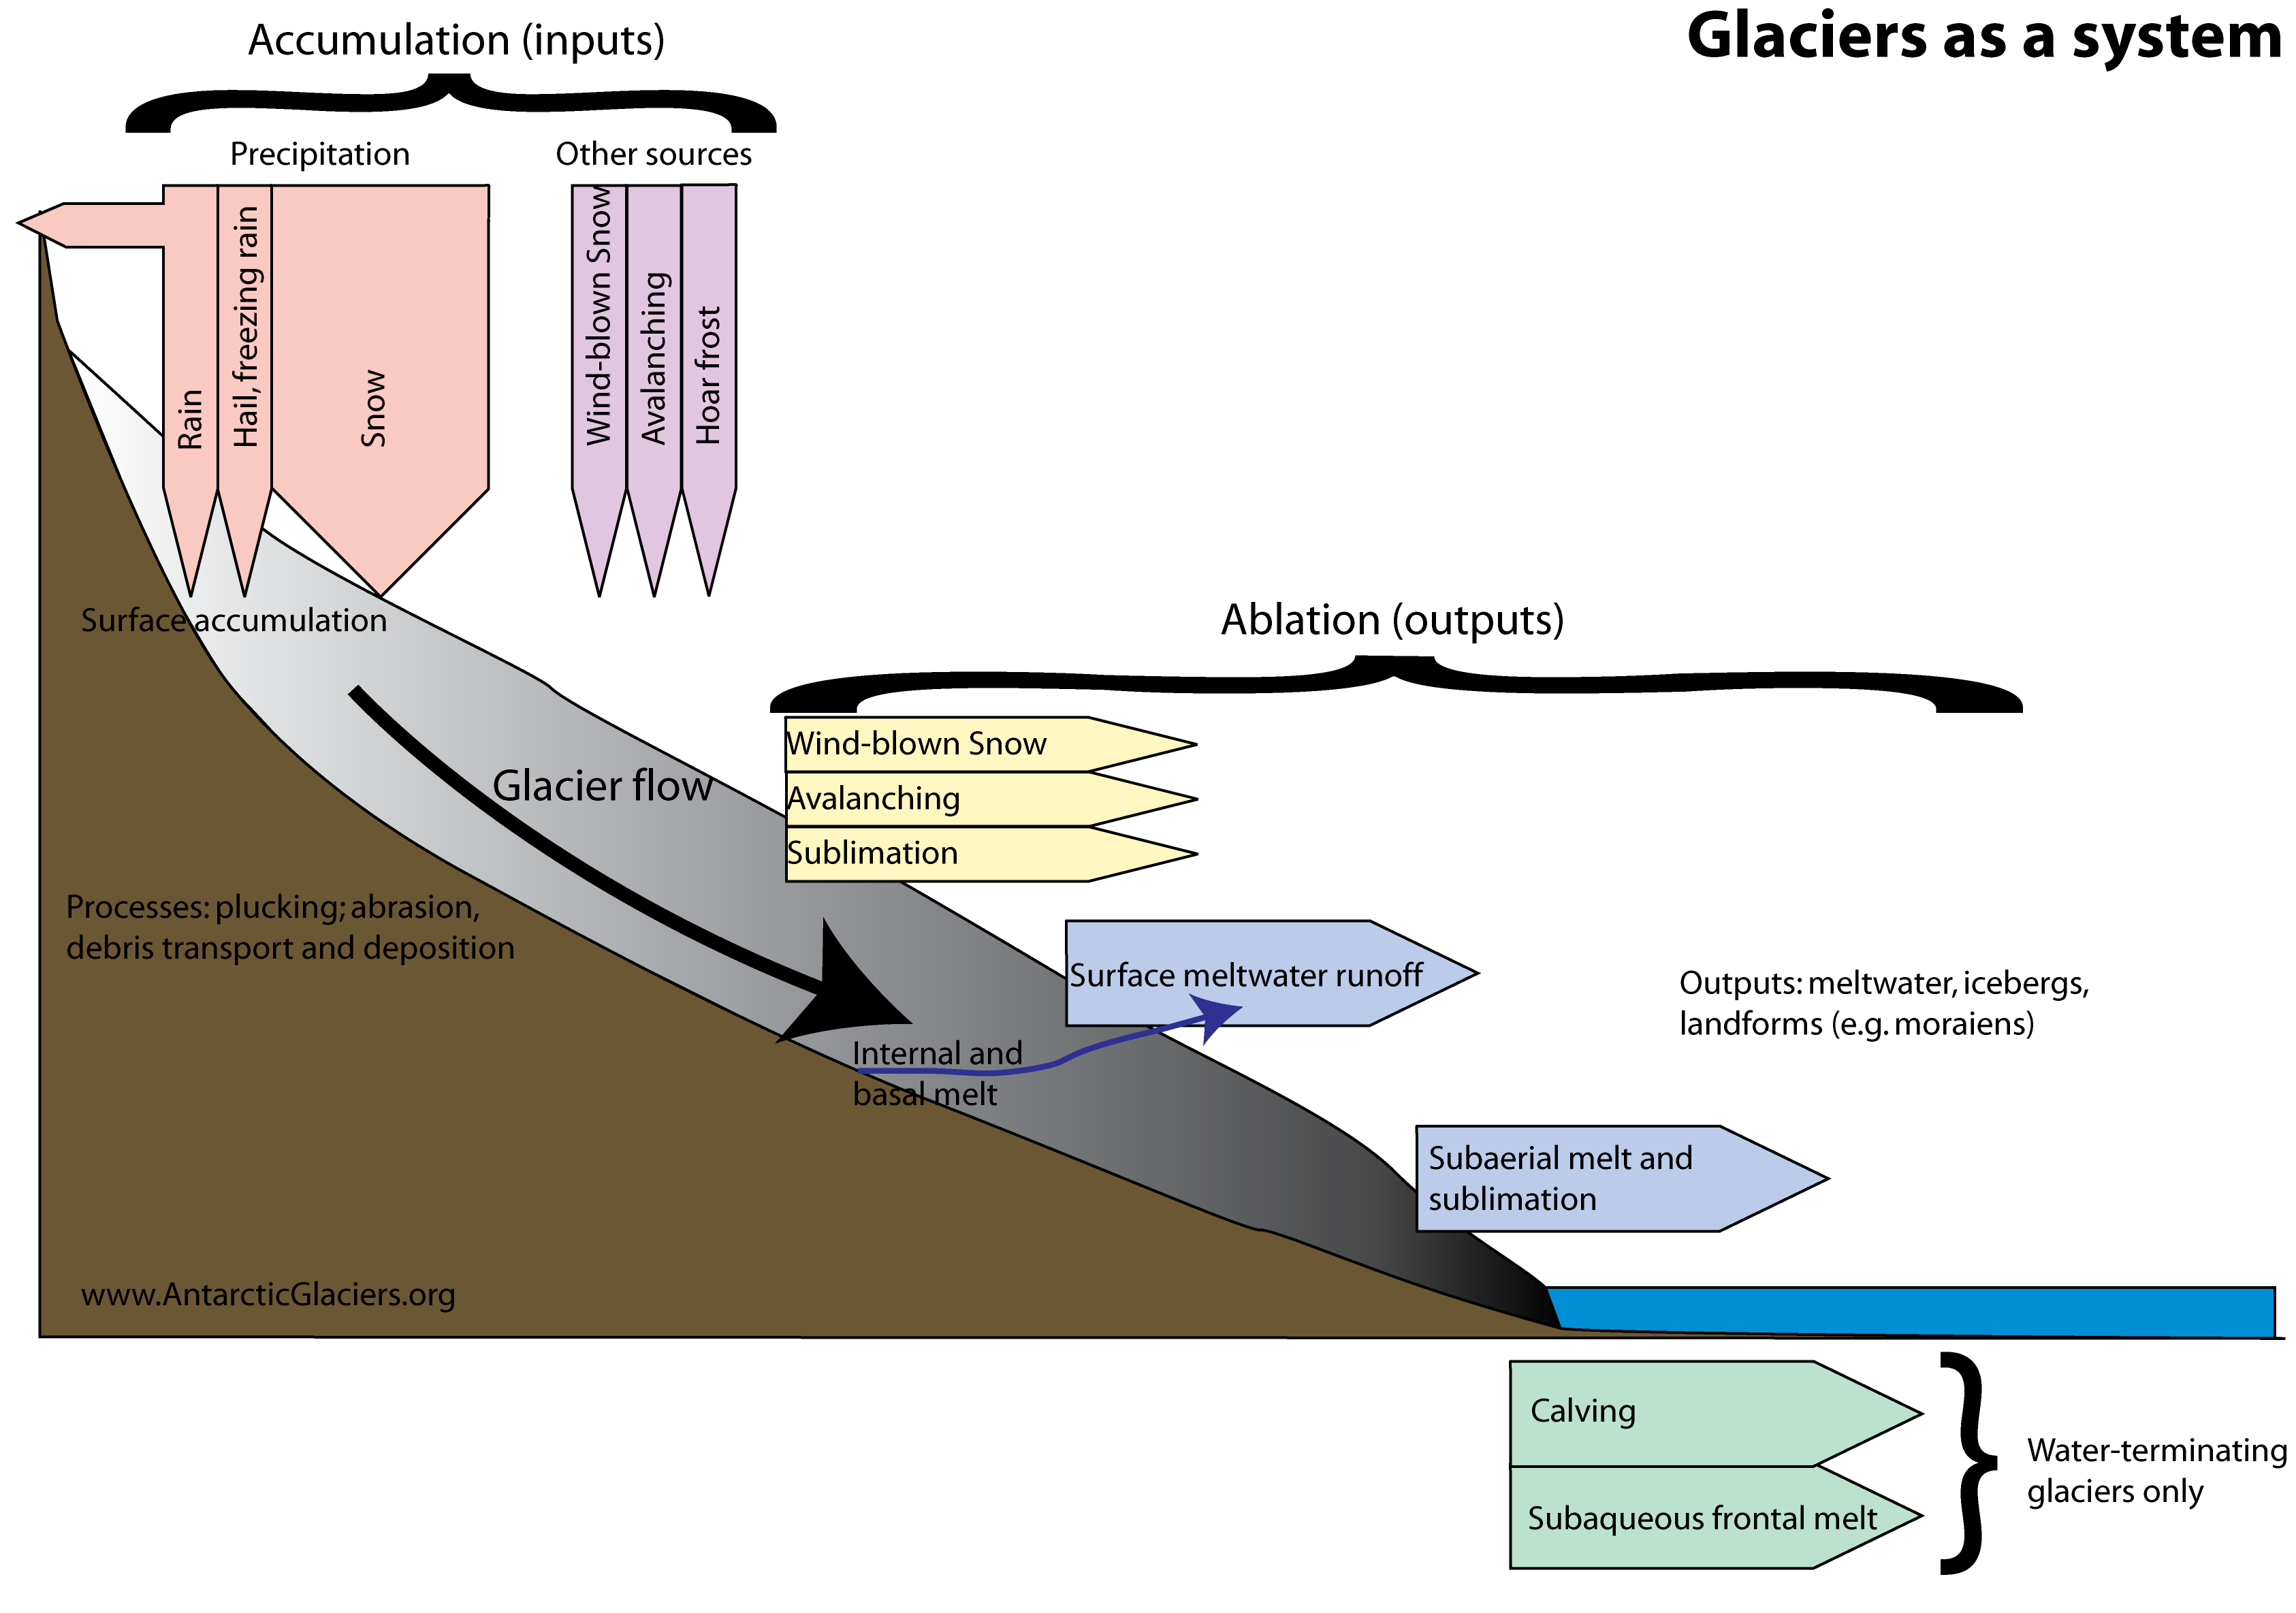
General process for melting
accumulation
temps are cold
snow collects, adds to mass
starts with first autumn snow
older snow compacts
ablation
mass starts to reduce (melting, calving or sublimation/evaporation)
starts late spring
warm air & sun melts snow and ice into water
calving happens, otherwise slow shrinkage
all new snow disappears from lower reaches of glacier
remaining snow form hard layer of firm
new equilibrium line is made
Human and natural causes for melting
natural
variation in solar energy
not consistent
milankovitch cycle correspond with periods of glaciation
volcanic activity
significant amounts of dust and gas ejected into the air = both warming and cooling
deep water currents
aka thermohaline circulation
driven by differences in water density due to temp and salinity
human
localized addition of heat
activities of everyday living into the atmosphere (industrial processes - heating, cooling, transport)
alteration of landscapes
changed in albedo (light refraction)
clearance of forests
urbanization
changed in soil moisture
Interconnection between human and natural causes of melting ice in Greenland
amplification
humans accelerate naturally occurring processes
like fluctuations of cold and warm periods
rate of melting that is faster than what would occur through natural cycles alone
release of more greenhouse gasses (co2) from burning fossil fuels has strengthened the natural greenhouse effect
human-induced warming is laid on top of the natural cycles - increasing global average temp
positive feedback loop
Ice reflects most sunlight back into space, helps keep planet cool
Ice melts naturally after ice age - darker ground exposed = absorbs more sunlight as heat - more melt
Humans cause initial melt from activities - natural melt is accelerated more with more ground exposed
Causes for melting ice sheets (plate tectonics)
redistribution of land masses change climates as continents move into different latitudes
changes sunlight reflection and ocean heat balance
long term process
Causes for melting ice sheets (increase in global temperatures)
human and natural
global temps have increased by at least .94oC since 1880
estimated 40% of ice in the arctic melting is due to warming
more ablation over accumulation
could be from volcanic activity or output of greenhouse gasses
Causes for melting ice sheets (cryoconite)
airborne material from industry, desert dust and volcanic particulate
melting is increased because it settles on ice pats
reduces albedo (light refraction) and accelerates melting
Causes for melting ice sheets (population change)
60% of all emissions come from cities
emissions come from reduction of forest of forest cover and mangroves (carbon sinks)
methane from thawing permafrost enhances emissions
421 ppm of co2, pre industrial co2 was 250 ppm
impacts of melting ice on the economy
economy (fishing)
warmer water brings different fish species - shrimp, cod, salmon
increase in fishing industry
large companies adapt better than small independent companies - struggle to buy new equipment (e.g bigger boats, nets, processing machinery, crab pots & trawlers)
fishing export has grown from 138 million USD (1980) to 470 million USD (2014) - 34 years
impacts of melting ice on the society
society
changing diets - replacing traditional foods (seal & whale) to imported food
- native fish are leaving because of increase of freshwater from melting ice
people leaving/migration - women aged between 15-25 leaving for education or better job offers and resources and more housing accessibility
average of 2,544 people leaving every year (data from 2012-2022)
impacts of melting ice on environment
environment
water salinity changing because of glacial meltwater
more land for agriculture - land increased 30%, no. of farms decreased by 20% both in the last 20 years
lack of nutrients in soil after melting means bad soil quality
rate of melting increased - 5x greater in last 20 years than pre-industrial levels