Enviro Unit 3 Area of Study 1
1/43
There's no tags or description
Looks like no tags are added yet.
Name | Mastery | Learn | Test | Matching | Spaced | Call with Kai |
|---|
No analytics yet
Send a link to your students to track their progress
44 Terms
Biodiversity
Variability among living things on Earth, as well as ecological systems and genetic diversity (species, ecosystems, genetic).
Genetic Diversity
Variety of genes in a population of a single species. Includes diff genetic characteristics among individuals of a species. Crucial for adaptability/resilience of a population.
Species Diversity
The variety of different species on earth/specific area, includes species richness, species abundance and relative abundance.
Ecosystem diversity
Variety of habitats, natural communities and ecological processes in biosphere
Grid Sampling
Area divided into squares. Squares are selected and sampled to estimated species distribution/abundance
Transect/Line Sampling
Straight line lain across environment. Species touching the line/transect are recorded. Useful for observing changes across a gradient.
Quadrat Sampling
Square/rectangle frame placed randomly in an area, species counted in the frame. Useful for plants/non-moving organisms.
Edge effects
Refer to challenges/uncertainty encountered when sampling organisms on the boundary of a plot/quadrat. Can cause overestimation of population size. To avoid, circle quadrats can be used.
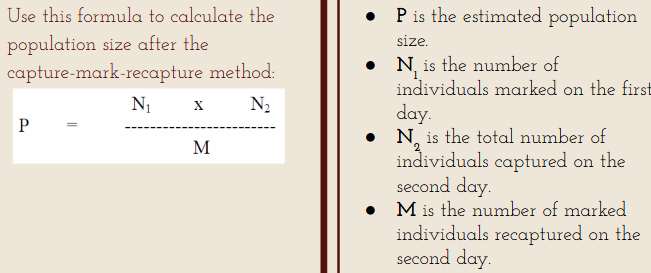
Mark-recapture
Portion of population captured, marked and released. Later, another portion is captured and marked individuals counted. Number of marked individuals in 2nd sample should be proportionate to whole population. Divide number of marked individuals by proportion of marked individuals in 2nd sample.
Species richness
Number of different species in a location.
Species abundance
Number of individuals per species/population
Relative abundance
Proportion/% of individuals belonging to a specific species compared to the number of individuals in all species in that ecosystem/area.
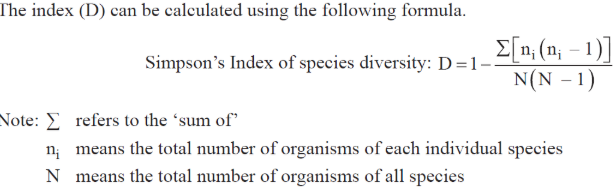
Simpson’s Index of Diversity
Measures the diversity oof a community, ecosystem or study site. 0-1, closer to 1 indicates high diversity whereas closer to 0 indicates low diversity.
Endemism
Being native/restricted to a specific area.
Conservation categories
Extinct in wild, critically endangered, endangered, vulnerable, near threatened, least concern.
Small populations
Habitat loss/over-exploitation
Inbreeding
Bioaccumulation
Biomagnification
Climate change
Disease
Protected areas
Translocation of animals
Captive breeding/reintroduction programs
Reduction/improved targeting of pesticides
Flora and Fauna Guarantee Act
MPAs
Sustainability principles
Conservation of biodiversity and ecological integrity
Efficiency of resource use
Intergenerational equity
Intragenerational equity
Precautionary principle
User pays principle