Analytics Final Exam
1/39
There's no tags or description
Looks like no tags are added yet.
Name | Mastery | Learn | Test | Matching | Spaced | Call with Kai |
|---|
No analytics yet
Send a link to your students to track their progress
40 Terms
10-1: Describe the basics of data visualization.
· Familiarize yourself with data visualization terms.
§ Horizontal axis:
§ Vertical axis:
§ Scale:
§ Tick marks:
§ Data series:
§ Data point:
o Data visualization presents the results of analysis in an accessible way through charts or graphs. Charts and graphs for structured data typically display the following components:
§ Horizontal axis: typically used for labels
§ Vertical axis: typically used for values
§ Scale: the scale by which the values are measured
§ Tick marks: the incrementals of the scale that are listed on the vertical axis
§ Data series: charts represent raw data visually
§ Data point: each data series if made up of indivual data points
how can we improve visualizations
· Sorting data by values can improve visualizations.
for decriptive data what are teh different uses for a table, bar chart, line chart, and pie chart
Used in descriptive analytics
Is a table of descriptive statistics enough?
o For this table, it is hard to see the trend (changes over time).
Bar charts work well for time series data.
o Data must be listed in chronological order.
ine charts are preferred (over bar charts) if trend is the most important point to communicate.
pie charts are good for categorical data and for showing proportions.
o Pie charts are rarely preferred if there are more than four categories.
o A pie chart is a poor choice for time series data.
what are dashboards used for
Used in descriptive analytics
Dashboards show multiple visualizations in one place.
o Dashboards typically have filters available so that it is easy for decision-makers to home in on a particular time period, category, product, or geographic area.
o For example, Amazon could display both the year-over-year sales bar chart and the year-over-year net income line chart on the same report.
what are bar charts
Used in descriptive analytics
Bar charts
§ Represent categories
§ Use categorical data
§ Show a variety of descriptive analytics (average, sum, count, etc.)
what are histrograms
Used in descriptive analytics
o Histograms
§ Represent bins/intercal
§ Use numerical data
§ Show the count of observations
Histograms are useful for showing the frequency of groups of data.
Histograms are a type of bar chart.
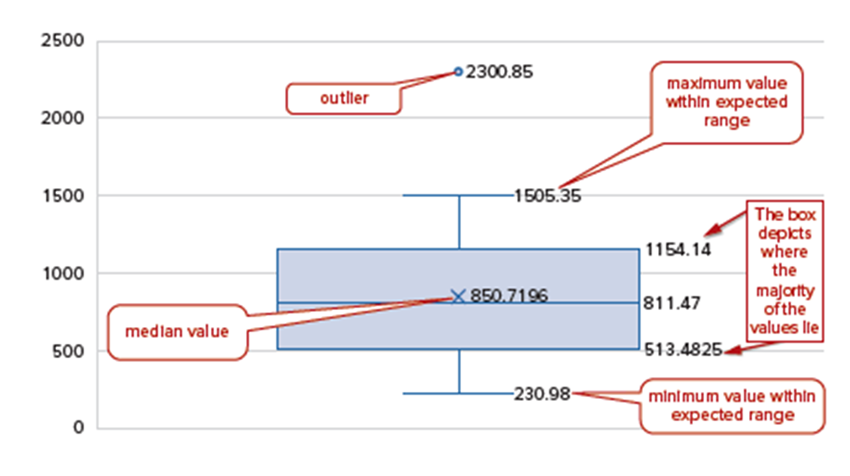
how can outliers and anomalies and how can they be assessed
Used in diagnositc analytics
· Outliers and anomalies are of interest for accountants and auditors.
o Outliers are often used as a part of diagnostic analytics and can be assessed in two ways:
§ “eyeball” the data.
§ Construct a box ploy.
· Box plots show the relative position of data, like histograms.
what can pivot tables be used for
Used in diagnositc analytics
· Use pivottables for exploratory diagnostic analytics.
o In diagnostic analytics and in outlier detection, you’re already looking to identify trends, distribution shapes, and outliers.
· Data in a PivotTable can be sliced, diced, and filtered to see how the Pivot Chart (or pivot charts in a dashboard) shifts and changes shape, bringing additional insights to a scenario
how can you use predictive analytics for analytics visualizations
· correlation and regression show relationships between data variables.
· scatterplots and trend lines help to visualize correlation and regression.
o scatterplots are a useful way to visualize your data if you have two different measures (for example, two different years’ worth of sales across states or stores), and you wish to visualize the relationship between the two measures.
· time series data visually represents forecasting models.
o Visualizing forecasting data is helpful to provide decision makers with a quick overview of how their decisions will affect future performance.
how can we use prescriptive analysis for static visualizations
A sensitivity analysis can be represented as a table or a graph.
· Breakeven analysis could be presented as a graph or a table.
What is financial statement analysis?
o Financial statement analysis is the use of analytic tools and techniques to examine, compare, and evaluate financial statements for decision-making purposes.
· Who are the users of financial statements?
o Potential shareholders: To decide whether to invest in the stock of one company or another.
o Shareholders: To assess the risk and return of their investment in that company.
o Creditors: To decide which company will receive a loan and at what interest rate.
o Suppliers: To assess whether they will be paid for the products or services they provide.
o Managers: To determine whether to manufacture a product or to buy that product from a supplier.
o Employees: To determine a company’s financial security and whether they want to pursue a career at that company.
o Customers: To decide if the company will be able to service a purchase that is made, provide a warranty, or make replacement parts available when they need it.
o Government regulators and tax authorities: To assess required levels of tax payment and basic compliance with laws.
· What questions can we ask to describe and diagnose financial data?
o Descriptive: What happened ? What is happening?
§ Did the firm’s debt relative to its assets increase in the past year?
§ What were the company’s cash flows from operating activities for each of the past three years?
§ Did the profit margins rise or fall during the current quarter as compared to the past?
o Diagnostic: Why did it happen? What are the reasons for past results? Can we explain why it happened?
§ How will did the firm perform relative to its competitors or its respective industries and what caused the differnce?
§ What are the component parts of return on equity?
· What questions can we ask to predict and prescribe actions using financial data?
o Predictive: Will it happen in the future? What is the proababilty something will happen? Is it forecashable?
§ What is the level of expected sales in the next month, quarter and year to help with our production?
§ What is the expected earnings and cash flows over the next five years?
o Prescriptive: What should be do based on what we based on what we expect will happen? How do we optimize performance based on potential constraints?
§ What is the intrinsic value of the stock based on forecasted financial performance and uncertainty?
§ Can analyst earnings forecasts help predict the intrinsic market value of the firm?
§ Does the intrinsic value of the firm differ from the actual stock price?
12-2: Recall the sources of financial statement data.
· Financial statements provide quantitative and qualitative data.
· Stock price adds market data for context.
· Financial data is available in different formats.
· Market data provides additional information.
12-3: Explain financial statement analysis questions addressed using descriptive analytics
· Summarization and statistical techniques address the questions.
o Summarization and statistical technique are used to address the basic questions of “What happened?” or “What is happening?”. The techniques include counts, totals, sums, averages, subtotals, minimums, maximums, histograms, PivotTables, standard deviations, and ratio analysis.
Summaries of data help understand the middle and spread of the data.
o Counts: Show how frequently an event occurs
§ What is the total number of customers served?
§ What is the total number of countries where the company sells its products?
o Totals, sums, averages, subtotals: summarize measures of performance
§ How many loans (in number and in dollars) were extended by the bank in the previous quarter?
o Minimums, maximums, medians, and standard deviations: Summarize measures showing extreme values to help explain what happened
§ Which stock in the portfolio has the highest price volatility?
§ Which stock in the portfolio has the lowest price volatility?
· Histograms and ratios identify relationships in the data.
o Graphs (bar charts), histograms: Show performance graphically
§ What are the levels of quarterly profits over the past three years shown in a bar graph?
§ What is the expected string of lease and long-term debt payments payable over the next few years?
o Percentage increases from past years or relative to benchmarks: Horizontal analysis; vertical analysis; DuPont analysis.
§ Did the amount of interest expense as a percentage of sales increase in the past year?
o Ratio analysis like current ratio, debt-to-equity, and price-to-earnings ratios: Calculates important financial ratios for comparison purposes.
§ What is the relative leverage (debt-to-equity ratios) of retail firms like Amazon, Walmart, Target, or Kroger?
§ Which company has the highest price-to-earnings ratio?
Ratio analysis shows the relative proportion of two values.
o Ratio analysis is commonly used as a descriptive analytics technique in financial statement analysis to understand “What is happening? Or “What happened?”.
o Three types of ratios
§ Liquidity ratios show how quickly accounts can be converted or turned over.
Current ratio: Current assets / Current liabilities
Acid-test ratio: (Cash + Current investments + Accounts receivable) / Current liabilities
Receivables turnover ratio: Net credit sales / Average accounts receivable
Inventory turnover ratio: Cost of goods sold / Average inventory
§ solvency
Debt to equity ratio: Total liabilities / Stockholders’ equity
Times interest earned ratio: Net income + Interest expense + Tax expense / Interest expense
profitability ratios show how much profit is derived from sales, assets, and equity.
Gross profit ratio: Gross profit / Net sales
Profit margin: Net income / Net sales
Return on assets: Net income / Average total assets
Return on equity: Net income / Average stockholder’s equity
Price-earnings ratio: Stock price per share / Earnings per share
Diagnostic analytics help us understand why results occurred.
o Diagnostic analytics addresses the questions “Why did it happen?”, “What are the reasons for the past results”, and “Can we explain why it happened?”.
o Recall that diagnostic analytics is perform to investigate the underlying cause that cannot be answered by simply looking at the descriptive data.
o Diagnostic analytics can employ various types of analyses including finding anomalies and outliers or using drill-down analytics to determine relations/patterns/linkages between variables.
what is diagnostic analytics used for? what are some examples?
Diagnostic analytics help us understand why results occurred.
Diagnostic techniques for financial statement analysis
Relevant benchmarks for assessing performance.
Common-size financial statements
· Drill-down analytics to determine relationships between variables.
Diagnostic techniques for financial statement analysis.
o Anomalies and outliers: Comparisons to appropriate benchmarks
§ How did the company’s return on assets compare to the industry as a whole?
§ Did the focal company spend more on interest expense as a percentage of sales than its competitors?
o Drill-down analysis to determine relations/patterns/linkages between variables
§ What is the relationship between advertising expense and sales?
§ What is the correlation between growth in revenues and growth in net income?
How are relevant benchmarks for assessing performance in diagnostic analytics
o Time comparison: Company’s own past performance
o entity comparison: Closest competitor firm
o Industry comparison: Specific industry which offers the best comparison
o Stock market comparison: Market index (e.g., S&P 500, Dow Jones Industrial Average, Nasdaq)
o overall economy comparison
o Results comparison: Budgeted plan or analysts’ forecast of performance
How are drill down analytics used in diagnostic analytics
Drill-down analytics to determine relationships between variables.
o How are R&D expenditures related to subsequent profitability?
o Of every dollar spent on R&D, how much does net income change?
o The regression model and analysis would include the following:
§ Dependent variable: net income (next period)
§ Independent variables: R&D expenditures, advertising expenses, capital expenditures, other expenses, net income (current period)
12-5: Illustrate financial statement analysis questions addressed using predictive analytics.
· When do we use predictive analytics for financial statement analytics?
How do you predict the market value of equity?
o Predictive analytics represents an important means of analysis, including forecasting or predicting future events or performance.
· Classification, regression, and forecasting help predict future events.
o Classification: A predictive analytics technique used to separate or classify a sample (or population) into two or more groups of classes.
o Regression: A predictive analytics technique used to predict a specific dependent variable outcome value based on independent variable inputs.
o Forecasting using time series analysis: A predictive analytics technique used to predict future values based on past values of the same variable.
How do you predict the market value of equity?
o Which is better at predicting the market value of equity (defined as the total dollar value of a company’s equity, or market capitalization), a company’s operating cash flows or net income? Or is it a combination of both?
o Predictive analytics is used in financial statement analysis to predict the market value of a firm’s equity.
o Dependent variable: market value of equity (the current stock price multiplied by the total number of outstanding shares)
o Independent variables: operating cash flows and/or net income (and accruals)
· Can predictive analytics be used to predict future losses?
12-6: Describe the financial statement analysis questions addressed using prescriptive financial analytics.
· When do we use prescriptive analytics?
o Prescriptive analytics addresses the questions “What should we do based on what we expect will happen?” and “How do we optimize our performance based on potential constraints?”
· What techniques are appropriate for prescriptive financial statement analysis?
o Sensitivity analysis: Evaluating the outcomes based on uncertainty regarding the inputs.
o Cash flow (valuation) analysis: Evaluating future cash flows using various analytics techniques, including net present value (NPV) and internal rate of return (IRR), for potential investments.
When do we use managerial accounting analytics?
o Management accountant: analyzes accounting-related data to help an organization make effective business decisions.
o Managerial accounting analytics is the use of analytical tools and techniques to evaluate relevant accounting data for decision-making purposes.
what descriptive analytics questions might mangers ask and what could we use to answer it?
o Descriptive analytics: summarizes activity or master data based on certain attributes to address the following questions: What happened? What is happening?
§ How many doors did we produce last week, and at what cost?
· Summary statistics (sums, totals, averages, medians, etc.).
§ How much did Job #507 cost?
· Job order costing and/or process costing.
§ What was the profit margin for the Asia Pacific and East Coast regions last month?
· Pivot tables analyzing crosstabulations of performance.
§ Which products were the least profitable for the company? Should we discontinue their production?
· Pivot tables analyzing crosstabulations of performance.
what questions might diagnostic analytics ask
o diagnostic analytics: Detects correlations and patterns of interest and compares them to a benchmark to address the following questions: Why did it happen? What are the reasons for past results? Can we explain why it happened?
§ Why is the profit margin on the East Coast greater in the Southwest region?
Tracking key performance indicators (KPIs).
Correlations.
Anomalies and outliers: comparisons to appropriate benchmarks.
§ What is driving the materials quantity variance?
Price, rate, usage, quantity and overhead variance analysis
Conditional formatting.
Anomalies and outliers: comparisons to appropriate benchmarks.
§ Why did our rate of product defects go up this week compared to last week?
Comparison of current performance to prior performance.
§ What is the level of fixed and variable costs for our primary products? Does our company have a different mix of costs as compared to the industry or our competition?
Regression analysis estimating cost behavior.
Drill-down analysis: analysis to determine relations, patterns, and linkages between variables.
What predictive analytics might managers ask
o Predictive analytics: Identifies common attributes or patterns that may be used to forecast similar activity to address the following questions: Will it happen in the future? What is the probability something will happen? Is it forecastable?
§ What is the level of expected sales for the company in the next month, quarter, and year to help plan production and budgets?
Sales forecasting (time series, competitor performance).
Forecasting using time series analysis: a predictive analytics technique used to predict future values based on past values of the same variable.
§ Which are the most appropriate cost drivers to allocate overhead?
Regression analysis: a predictive analytics technique used to predict a specific dependent variable outcome value based on independent variable inputs.
What prescriptive analytics might managers ask(6)
o Prescriptive analytics: recommends action based on expectations of future performance, addressing the following questions: What should we do based on what we expect will happen? How do we optimize our performance based on potential constraints?
§ Should the company lease or own its headquarters office building?
What-if analysis (marginal analysis).
§ Should the company manufacture its own products or outsource to other producers?
·What-if analysis (marginal analysis).
§ What is the expected return to an investment on a new piece of factory equipment?
NPV.
§ What is the level of sales that will allow the company to breakeven?
Goal-seek analysis.
§ How can revenues be maximized (or costs be minimized) if there is a trade war with another country?
What-if scenario analysis.
§ At which product price are profits maximized?
Optimization.
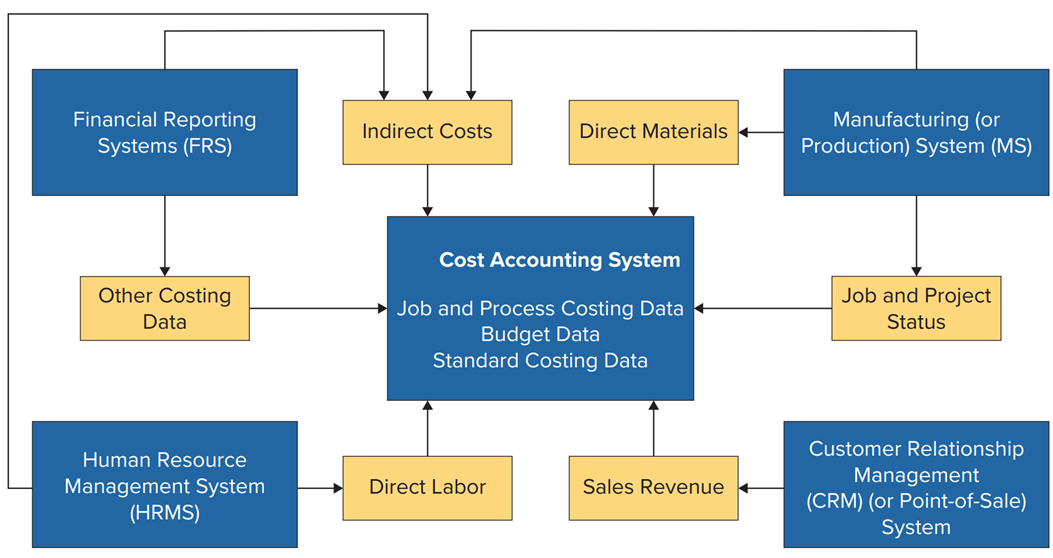
· Data for cost accounting systems comes from many sources.
· Management data is supplemented with macroeconomic data.
13-3: Explain the use of descriptive analytics to address managerial accounting questions.
· Summarization and statistical techniques help gain insight into cost performance.
o Counts: Show how frequently and event occurs.
o Total, sums, average, subtotals: Summarize measures of persormance.
o Minimums, maximums, medians, standard deviations: Summarize measures showing extreme values to help explain what happened.
o Graphs (bar charts), histograms: Shows performance graphically.
o Percentage increases from past years or relative to benchmark: Horizontal analysis; vertical analysis.
Ratio analysis such as inventory turnover, asset turnover, accounts receivable turnover, and accounts payable turnover: Calculates important financial ratios for internal analysis
13-4: Describe diagnostic analytics techniques to address appropriate managerial accounting questions.
· Drilling down helps managers diagnose issues.
13-5: Illustrate managerial accounting analytics questions addressed using predictive analytics.
· Forecasting helps managers predict future results.
· Forecast production sales using time series or regression analysis.
o Time series analysis:
o Regression analysis:
§ Dependent variable:
§ Independent variables:
· Weather.
· Specific promotional or marketing campaigns.
· Issues with production (such as logistics, component shortages, production issues).
· Responses to anticipated increases or decreases in costs like freight.
· Macroeconomic performance.
13-6: Describe managerial accounting analytics questions addressed using prescriptive managerial analytics techniques.
· Prescriptive analytics help managers optimize constraints.
13-7: Characterize methods of reporting managerial accounting analytics results.
• Heat maps show the relative change in values on a sensitivity analysis.
o Conditional formatting combined with sensitivity analysis shows the impact on profit while changing units sold and variable cost.
What type of prescriptive analytics is this: evaluates the outcomes based on uncertainty regarding inputs
Sensitivity Analysis
What type of prescriptive analytics is this: evaluates the impact of future events by considering potential outcomes
scenario analysis
What type of prescriptive analytics is this: is used to find teh best feasible solution based on an objective function, decision variables, and business constraints
optimization model
What type of prescriptive analytics is this: is a form of what if analyss that tells us what will need to be done(or assumed) in order to reach a desired outcome, output or result
goal seek analysis
What type of prescriptive analytics is this: technique to determine whether to manufacture a product in-house or externally
make-or-buy analysis
What type of prescriptive analytics is this: a set of prescriptive analytics techiniques evaluating how changes in values in various inputs(outputs) affect other outputs(inputs)
what-if analysis
what are teh following ratios:
PM
Accurals
Market Value
P/B
P/E
P/s
Inventory TO
Waste as % of csots
PM= NI as a % of sales
calc: accurals using ni- oancf,
market val=prcc_f* csho
P/B=year end price/(BV/shares)
P/E= year end price/eps
P/S= year end price/(sales/shares)
inventory TO= cogs/inventory
waste as a % of costs= waste/cost