IPR - WEEK 6 - Normal distribution and Z-scores
1/34
There's no tags or description
Looks like no tags are added yet.
Name | Mastery | Learn | Test | Matching | Spaced | Call with Kai |
|---|
No analytics yet
Send a link to your students to track their progress
35 Terms
Distribution of data
Overall shape and pattern of the data
how the data looks overall, how the data are arranges or spread across values
What does distribution of data look at?
Shape - overall pattern
Symmetry - if the left and right sides mirror eachother around the centre
tails - thin ends of the distribution curve (extreme values)
long tails - more outliers
heavy tails = higher cnances of extreme values
influence testing = rare eventds fall i the tails
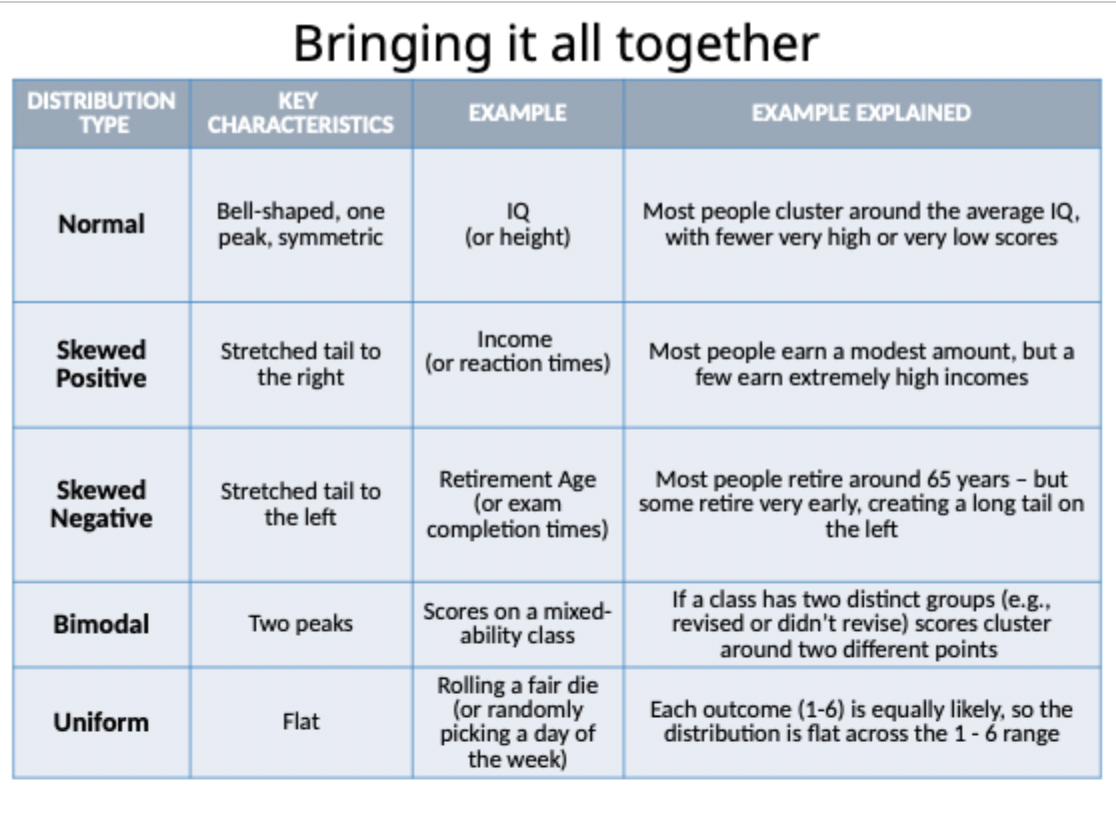
What are common distributions of data?
Normal (bell-shaped, symmetric)
Skewed (tail longer on one side)
Bimodal (two high points
Uniform ( flat, values spread evenly
What is a normal distribution?
Bell shaped
cluster around the centre (one peak
symmetric on both sides of the peak (the mean)
tails = fewer values as you move away from the centre (extremes)
a perfectly normal distribution: = mean = median = mode
What is skewed distribution?
The asymmetical nature of a distribution
tail stretched more on one side
left and right sides are not mirror images
one peak, most values cluster on one side of the peak
has two different types of skewed
What are the two different skewed distributions?
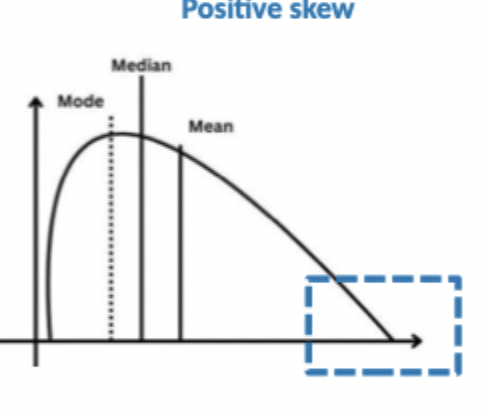
Positively skewed
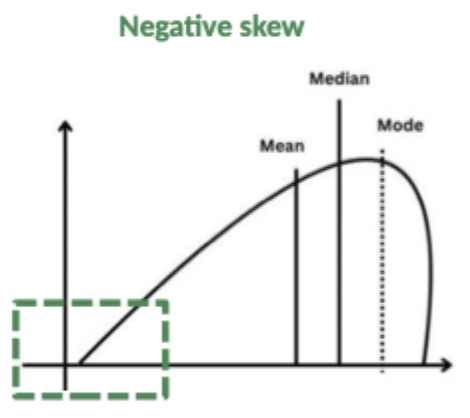
Negatively skewed
Describe postively skewed data distributiosn?
Right skewed, tail is longer on the right side of the peak, more data on the left, data is concentrated towards higher values
Describe negatively skewed data distribution?
Left-skewed, tail is longer on the left of the peak, more data on the right, data is concentrated towards the lower values
What is Kurtosis?
The shape/ the ‘tailedness’ of a distribution e.g. heavier or lighter tails
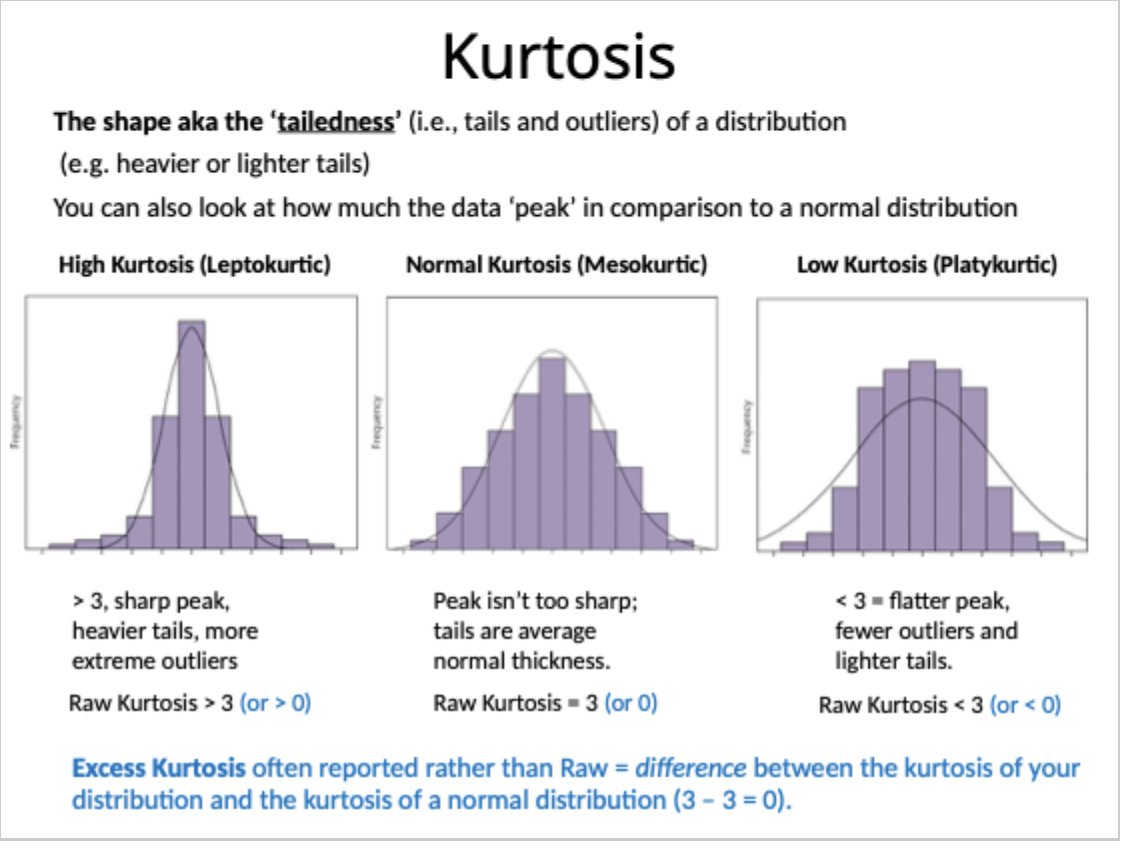
What is excess kurtosis?
often reported rather than raw = difference between the kurtosis of your distribution and the kurtosis of a normal distribution
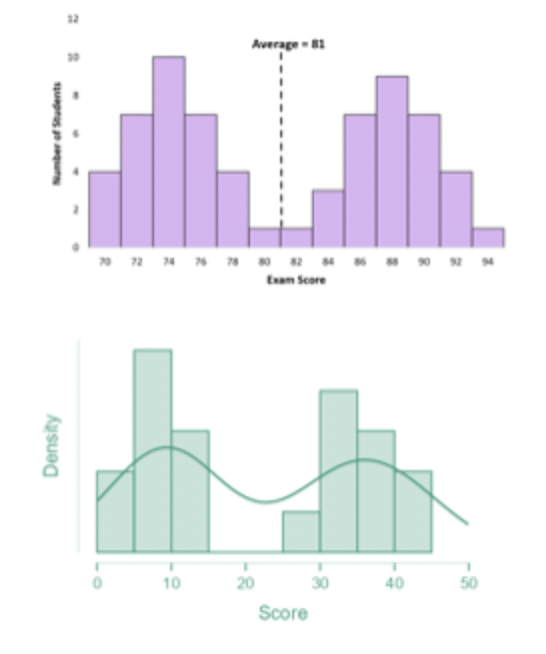
What is a Bimodal Distribution?
Two clear peaks
Or two clusters/dominant groups
typically occur when data come from two different groups
or indicate sub-populations in the data
requires careful interpretation
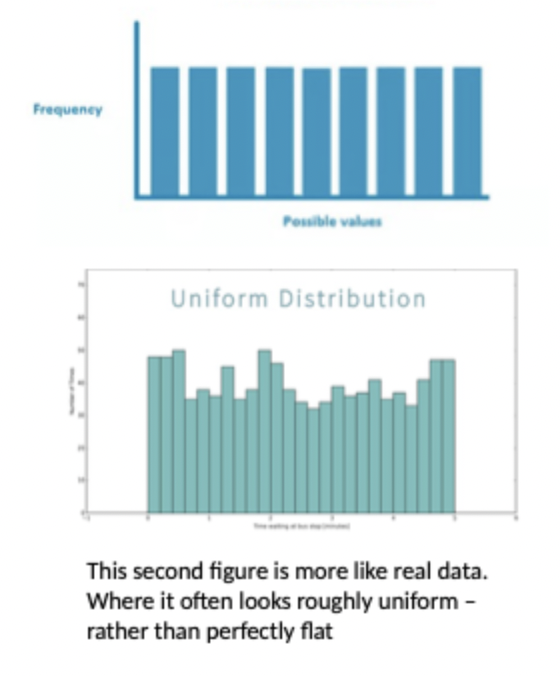
What is Uniform Distribution?
Flat shape
No peak, more rectangle shape
al values equally or relatively likely to occur with similar frequency
values are spread evenly across a fixed range
What is the deference between dispersion and distribution of data?
distribution of data answers what daya looks like overall i.e. shape, centre, spread
dispersion answers how wide or narrow that distribution is, i.e. the width/spread of data, specific numbers (like standard deviation, variance, IQR) that quantify how spread out that data is around its center, indicating variability or consistency
What happens to the distribution of data of there is a small SD?
Data os clustered around the mean, curve becomes narrow and taller
What happens to the distribution of data when there is a large SD?
data is more spred our; curve becomes wider and flatter
Comparison summary of distribution types:
Why does distribution matter?
Understanding the sape is crucial data for inference
this is for accurate predictions and hypothesis testing
What are parametric tests?
Inferntial/statistcal tests that assume data have normal distributions
What happens in inferential tests when distribution is non-normal?
you may need to:
transform the data
use a non-parametric test
what is homogeneity of variance?
Inferential tests that assume the varian/dispersion is similar across groups
If variance is greatly different between different groups rather than similar what does this indicate?
Your tests may not be valid
you may have use adjusted / corrected tests or on-parametric tests
Why is having a normal distribution central to hypothesis testing?
it acts as the foundation: to understand how scores relate to one another within a distribution and across disributions - to predict and standardise scores so we can compare different populations or different measures
What are Z-scores?
standardised values showing how many SDs a data point is from the mean
calculated by the mean/centre of distribution and the width/spread of the data
tells us exactly where in the standard normal distribution a value is located
what Z-scores allow for?
Allow comparisons within the dataset - sample distribution to help interpret values or detect unusual values
OR allow comparisons across different datasets
OR to a theoretical population distribution
Z-scores are calculated assuming a normal distribution
How does a normal distribution help predict where most scores will fall?
The normal curve represents probabilities
are under the curve = 1 or 100%
centred at 0 (increments of 1)
The tails are rare events (extreme values)
in the standard normal distribution the z-axis shoes z-scores
What does a Z-score tell you about a raw score?
Magnitude value - size in standardised unites of the difference/distance from the mean/centre
Larger than z-score = more rare (smaller probability)
Generally, fall between - 3 and 3
Location - which half of the distribution is the raw score sitting. Denoted by a sign (positive or negative)
Positive Z-score = above the mean, to the right
Negative Z-score - below the mean , to the left
whats a Z-statisitc?
used to report the actual results of analysis tests
What does a Z-score of -1 tell us?
That a score is 1 standard deviation away from the mean. As the sign is negative it means its below the mean so to the left.
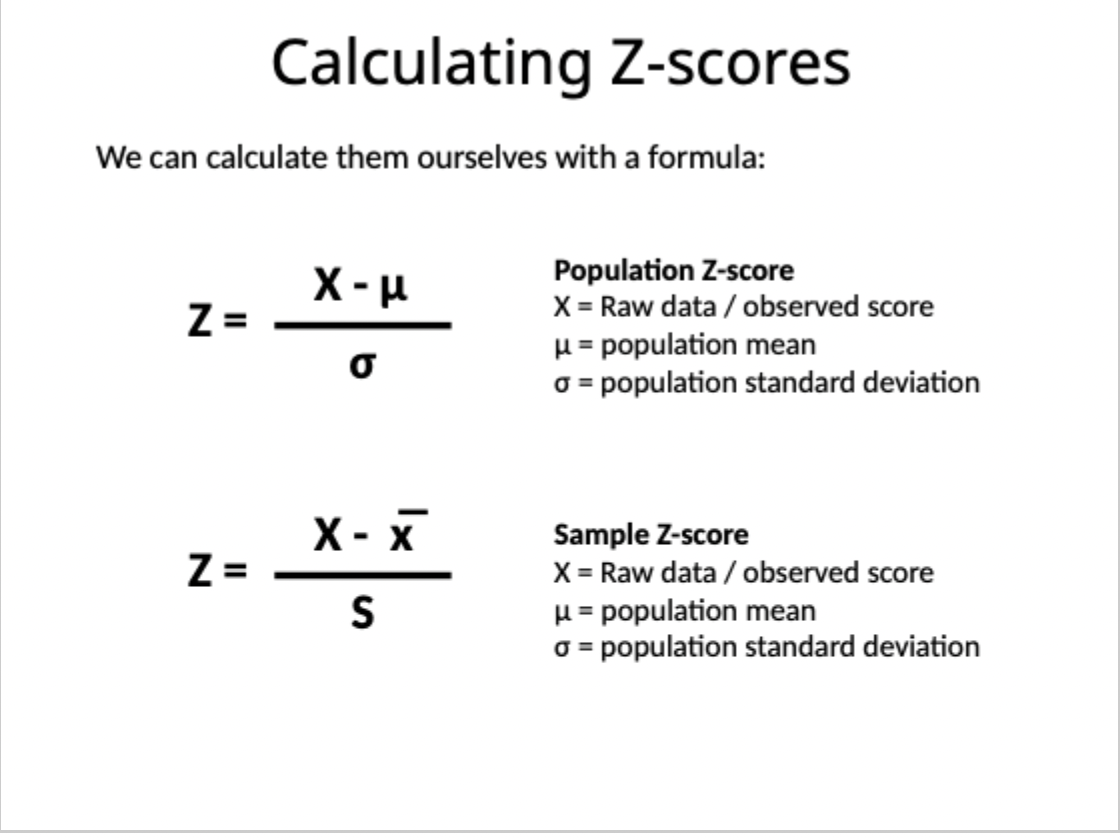
Formula to calculate z-scores
Z = raw data/observed score - population mean / population standard deviation
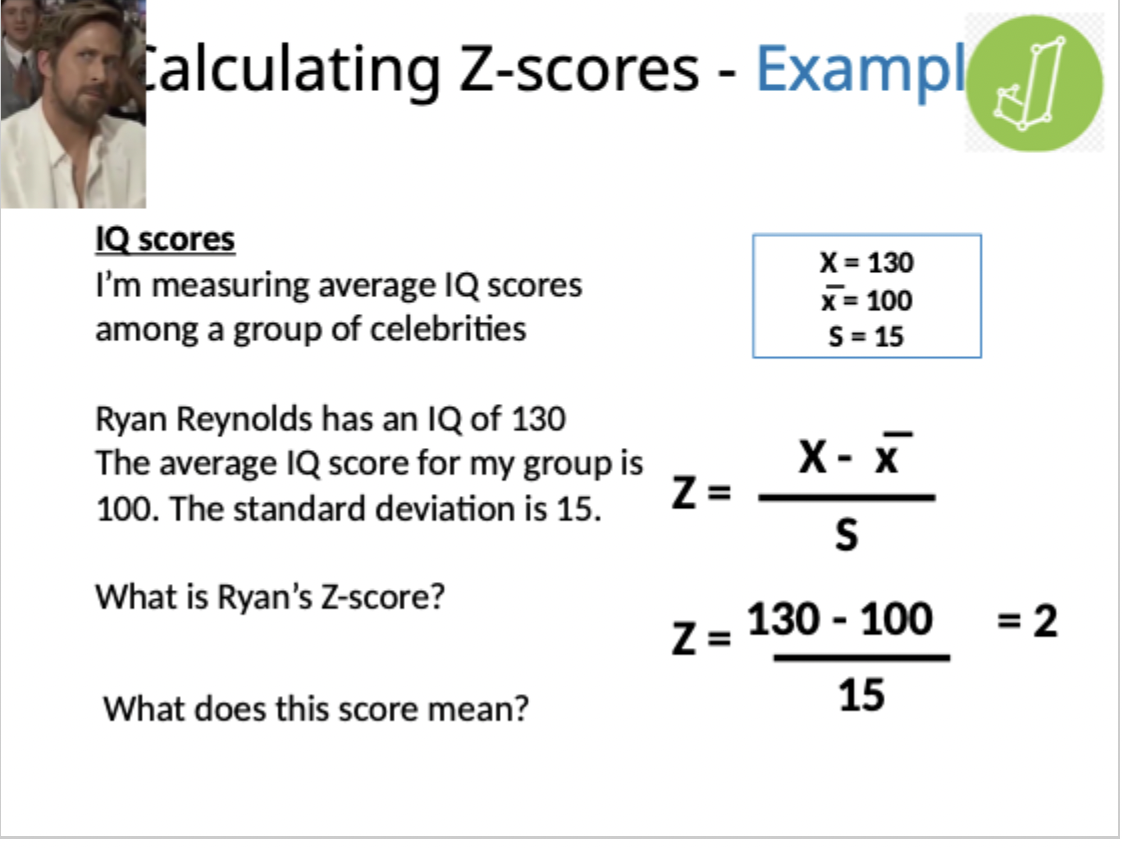
Z-score calculation example
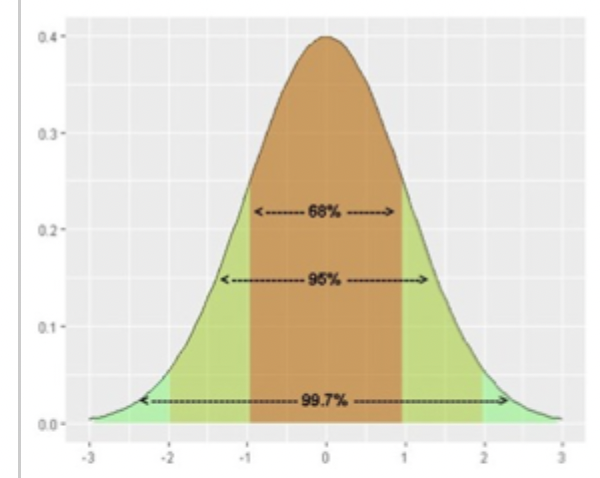
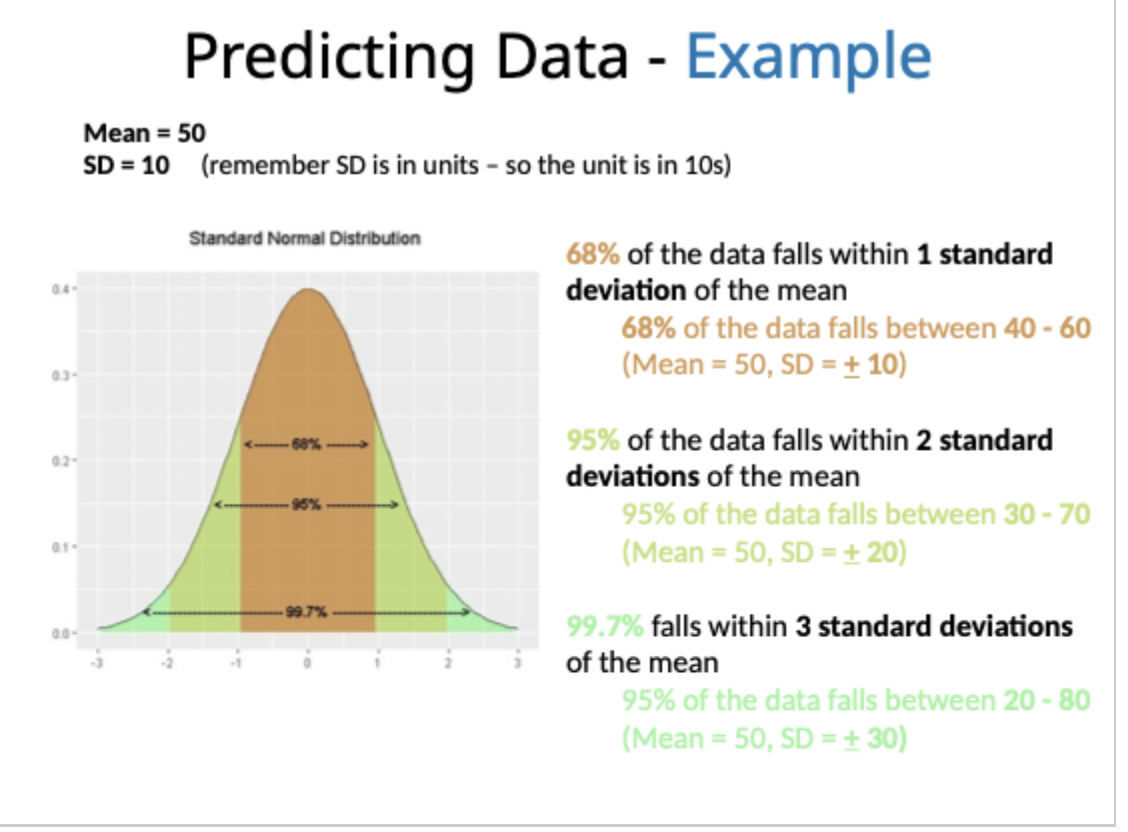
What is the Empirical Rule?
68% of the data falls within 1 standard deviation og the mean
95% of data falls within to 2 standard deviations of the mean
99.7% falls within 3 standard deviations of the mean
the further out you go from the mean the less typical the score
Predicting data example
Why are Z-scores important?
Gives the relative location of the persons score within its distribution
see if a score is unusual or typical, even if two datasets are very different
make meaningful comparisons - across datasets
quantifies the difference between the raw data and what is expected
transform non-normal distribution to a ormal distribution - convert scores into z-scores
detect outliers / extreme values
How do you calculate a z-score if data are completely ‘non-normal’?
transform the data to get approximate normality
instead, use specific analysis tests (non-parametric tests)
use percentile ranks instead of z-scores for interpretation
Why could data be Non-normal?
Outliers: data point that differs significantly from other observations
Insufficient data: sample size too small
Multiple distributions: bimodal
Measurement issues