psychology 2910 - lecture 12 (one-sample tests of means: t-test)
1/21
There's no tags or description
Looks like no tags are added yet.
Name | Mastery | Learn | Test | Matching | Spaced | Call with Kai |
|---|
No analytics yet
Send a link to your students to track their progress
22 Terms
When can we use a z-test?
Whenever we can trust that the sampling distribution is normal, and we can calculate the standard error
What if we didn't know the standard deviation of the population (σ)?
- If we don't know the population standard deviation, then we cannot calculate the standard error of the mean
- In fact, we usually don't know the value of SD (σ), so we have to do something else
T-Distribution
- If we don't know population SD, we can estimate it from s (i.e. we can estimate population SD by using the sample SD)
- But now we are introducing some error in our calculation by using an estimate of population SD instead of the real thing
- When we do this, we change the shape of the sampling distribution of the mean. It is no longer z-distributed. Instead, it now follows the t-distribution
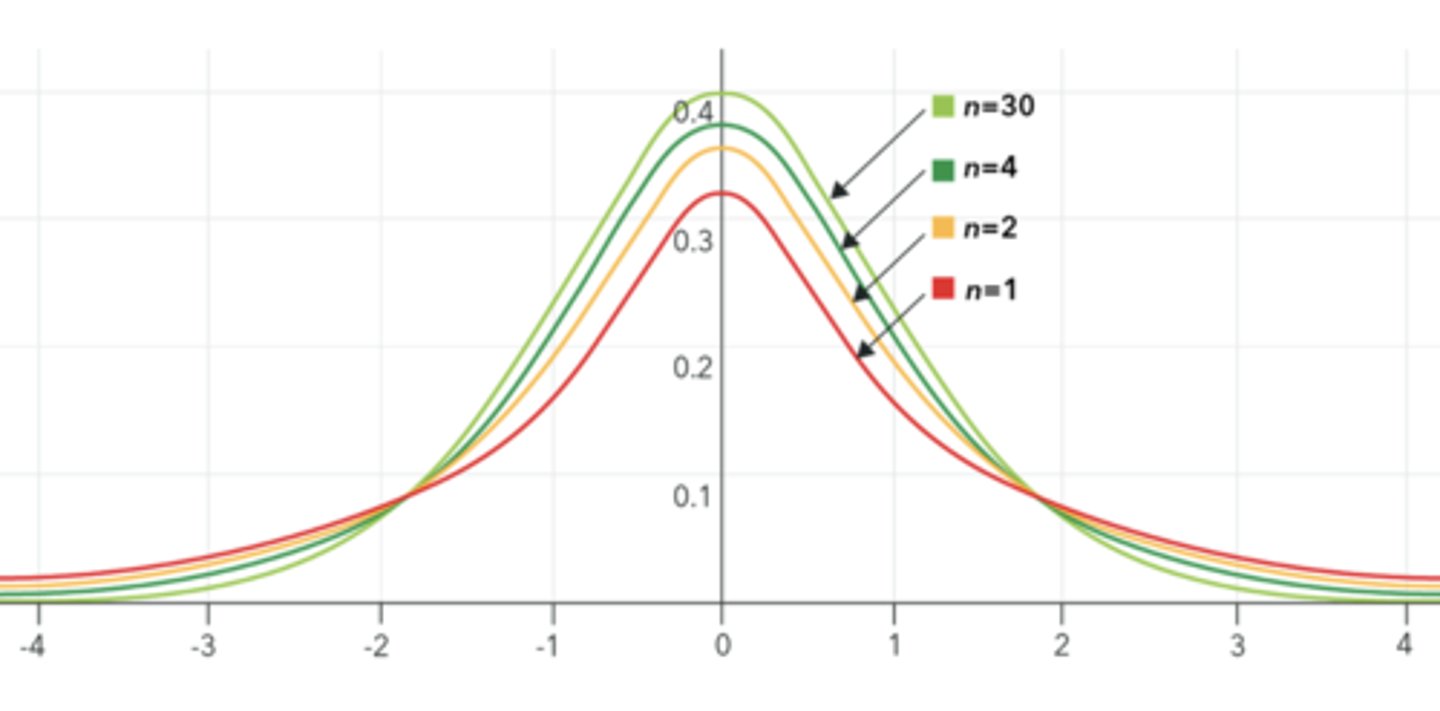
What are the characteristics of a t-distribution?
- Squashed version of the normal distribution (its tails are fatter)
- In fact, t-distribution is a family of distributions. The curve is slightly different for each degree of freedom
- As degrees of freedom increase, the t-distribution becomes slightly less squished. At infinite degrees of freedom, it is exactly the same as the normal distribution
There exists a tricky general knowledge test that is comprised of 100 true/false questions. We take a random sample of n = 64 high-anxiety students. Their mean on this test was 45% and their SD was 25%.
How can we propose a null and one-directional hypothesis to test if highly anxious students are doing worse than chance on this test (chance = 50%)?
H0: M (mean of the distribution of sample means) is equal to or greater than 50% (equal to or greater than chance)
Ha: M is less than 50% (worse than chance)
There exists a tricky general knowledge test that is comprised of 100 true/false questions. We take a random sample of n = 64 high-anxiety students. Their mean on this test was 45% and their SD was 25%.
How can we calculate standard error?
- Sampling distribution of the mean will be normal (because n is large)
- Have a mean of 50% (because population mean is 50%)
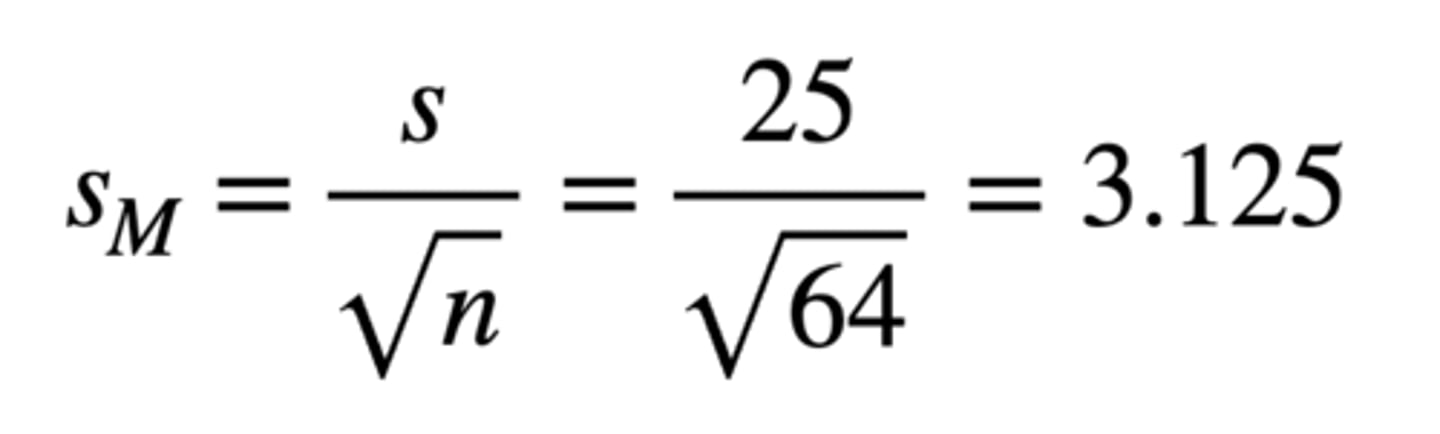
- We don't know standard error because we don't know population SD, but we can estimate it using sample SD (and knowing n = 64):
Standard Error = s / √n = 25 / √64 = 3.125
There exists a tricky general knowledge test that is comprised of 100 true/false questions. We take a random sample of n = 64 high-anxiety students. Their mean on this test was 45% and their SD was 25%.
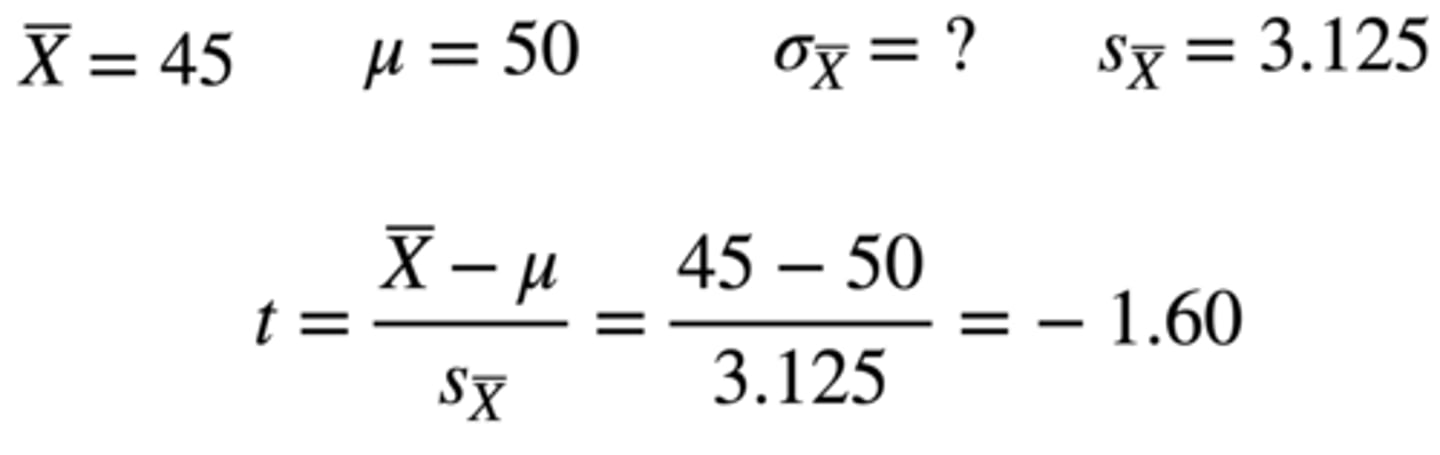
How can we calculate the z-score of the group mean on the sampling distribution of the mean?
Group mean = 45
Sampling distribution of the mean (hypothesized population mean) = 50
Standard error = 3.125
t = 45 - 50 / 3.125 = -1.60
There exists a tricky general knowledge test that is comprised of 100 true/false questions. We take a random sample of n = 64 high-anxiety students. Their mean on this test was 45% and their SD was 25%.
If our t-score is -1.60, what is the critical t-value?
- Find df = 60 on t-table (rounded down from df = 64 - 1 = 63)
- We are using an alpha of 0.05, but we are also using a one-directional test (and in the negative direction)
- Therefore, calculated t-value is -1.60, and critical t-value is -1.671
There exists a tricky general knowledge test that is comprised of 100 true/false questions. We take a random sample of n = 64 high-anxiety students. Their mean on this test was 45% and their SD was 25%.
Are highly anxious students doing worse than chance on this test (chance = 50%)?
Calculated t-value (-1.60) doesn't exceed (not as extreme as) critical t-value (-1.671), so we wouldn't reject the null hypothesis that highly anxious people would not do worse on this test
Although highly anxious people did score lower than 50% (mean = 45% and SD = 25%), this difference was not greater than what would be expected by chance, t(63) = -1.60, p > 0.05 (0.071)
Independent Groups
Between-subject design:
- IV is manipulated between subjects
- A given subject is either in the control group or in the experimental group
Dependent Groups
Within-subject design:
- IV is manipulated within subjects
- A given subject is both the control condition and the experimental condition
- The Picture Superiority Effect study is a within-subjects design: everybody had all conditions (i.e. getting the same people to do picture tests and word tests; testing how many pictures/words correctly recalled)
How can we compare two dependent (within-subject) means?
- With a one-sample t-test, we were comparing one sample mean to a population mean
- For the dependent samples t-test, we are comparing two means to each other, and testing whether their difference is different from zero
- Fortunately, in the dependent samples case, we can reduce this test to a one-sample t-test using difference scores
Difference Scores
If the same person is measured on the same measure in two different conditions, then we can calculate a difference score for each person, which is their score in one of the conditions subtracted by their score in another condition
By doing this, we are now taking two sets of scores and reducing it to one set of score (the difference scores)
Under the null hypothesis, what would we expect the mean difference score to be?
Zero (i.e. no difference between conditions)
- In fact, you could say that zero is the population mean in the null hypothesis, and you could test whether your mean difference is significantly different from zero
- So, a dependent-samples t-test is the same thing as a one-sample t-test on the difference scores
We want to know if students who take a certain course do better or worse on their midterm compared to the final.
One class from this course was sampled (n = 81), and students took both the midterm and the final. Their average difference score was -2.5%, where the negative score means they did better on the midterm.
How can we calculate this difference score?
Midterm: M = 76.3%, SD = 10.0%
Final: M = 73.8%, SD = 12.0%
Final - Midterm Difference Score: M = -2.5% (73.8 - 76.3), SD = 11.0%
We want to know if students who take a certain course do better or worse on their midterm compared to the final.
One class from this course was sampled (n = 81), and students took both the midterm and the final. Their average difference score was -2.5%, where the negative score means they did better on the midterm.
How can we construct null and research hypotheses?
H0: M of midterm equals M of final (difference score equals 0)
Ha: M of midterm does not equal M of final (difference score does not equal 0)
We want to know if students who take a certain course do better or worse on their midterm compared to the final.
One class from this course was sampled (n = 81), and students took both the midterm and the final. Their average difference score was -2.5%, where the negative score means they did better on the midterm.
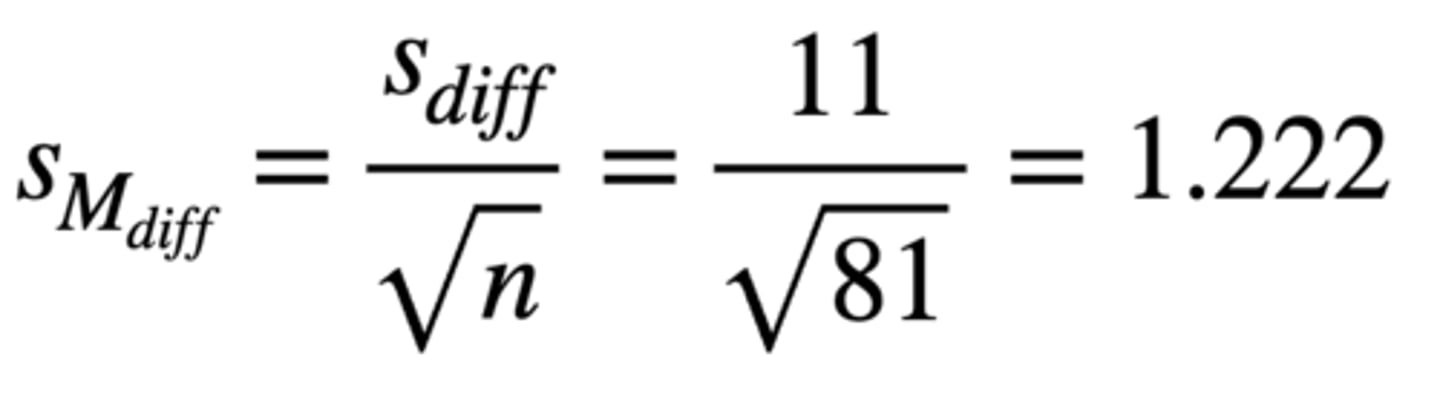
How can we calculate standard error?
Standard Error = difference score of SD / √n = 11 / √81 = 1.222
We want to know if students who take a certain course do better or worse on their midterm compared to the final.
One class from this course was sampled (n = 81), and students took both the midterm and the final. Their average difference score was -2.5%, where the negative score means they did better on the midterm.
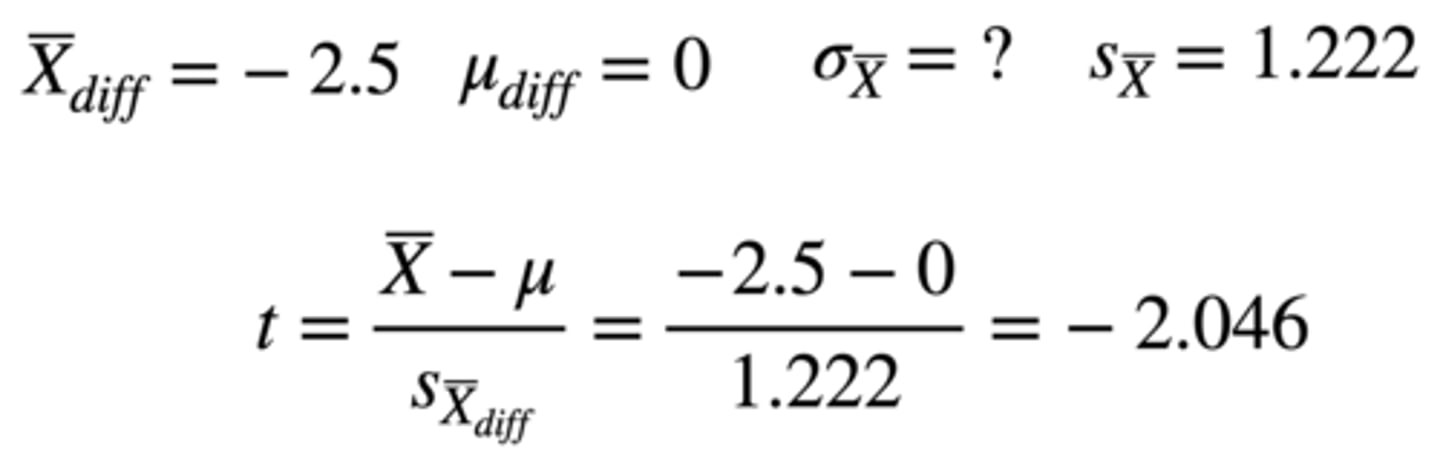
How can we calculate the t-score?
t-score: (final - midterm difference score) - (population mean of null) / standard error
-2.5 - 0 / 1.222 = -2.046
We want to know if students who take a certain course do better or worse on their midterm compared to the final.
One class from this course was sampled (n = 81), and students took both the midterm and the final. Their average difference score was -2.5%, where the negative score means they did better on the midterm.
What is the critical t-value? Can we reject the null?
Use df = 80 from t-table (n - 81 = 80)
Critical t-value: ± 1.99
Calculated t-value: -2.046 (more extreme)
| Calculated t-value | > | critical t-value | = reject null
We want to know if students who take a certain course do better or worse on their midterm compared to the final.
One class from this course was sampled (n = 81), and students took both the midterm and the final. Their average difference score was -2.5%, where the negative score means they did better on the midterm.
Overall, did students do worse on their final than on the midterm?
Students in this course did worse on their final, M = 73.8%, SD = 12.0%, than their midterm, M = 76.3%, SD = 10.0%. This difference was greater than what would be expected by chance, t(80) = -2.046, p < 0.05
The degrees of freedom you use for a t-test is not based on the number of scores that you have (i.e. 81 midterms and 81 finals = 162 scores). What is it based on?
Number of difference scores
Degrees of freedom is n - 1 for a one-sample t-test, so if there are 81 difference scores (final - midterm), 81 - 1 = 80
How does standard error differ in a t-test?
SD of the difference scores