PSY:2811 (Research Methods and Data Analysis in Psych I) Exam #2
1/227
There's no tags or description
Looks like no tags are added yet.
Name | Mastery | Learn | Test | Matching | Spaced | Call with Kai |
|---|
No analytics yet
Send a link to your students to track their progress
228 Terms
What are the two broad classes of statistical methods?
1. Descriptive
2. Inferential
Descriptive Statistics
A set of statistics used to organize and summarize the properties of a set of data
What is the purpose of descriptive statistics?
1. Organize data
2. Screen data for issues
3. Summarize main features of the data
4. Visualize data with graphs
5. Describe data from the sample
What questions can be answered using descriptive statistics?
1. What is the most common value or range of values for a variable?
2. What is the shape of the distribution?
3. How much spread, or variability, is there in values for a variable?
4. Which variables are related to each other?
Inferential Statistics
A set of techniques that uses the laws of chance and probability to help researchers make decisions about what their data mean and what inferences they can make from them
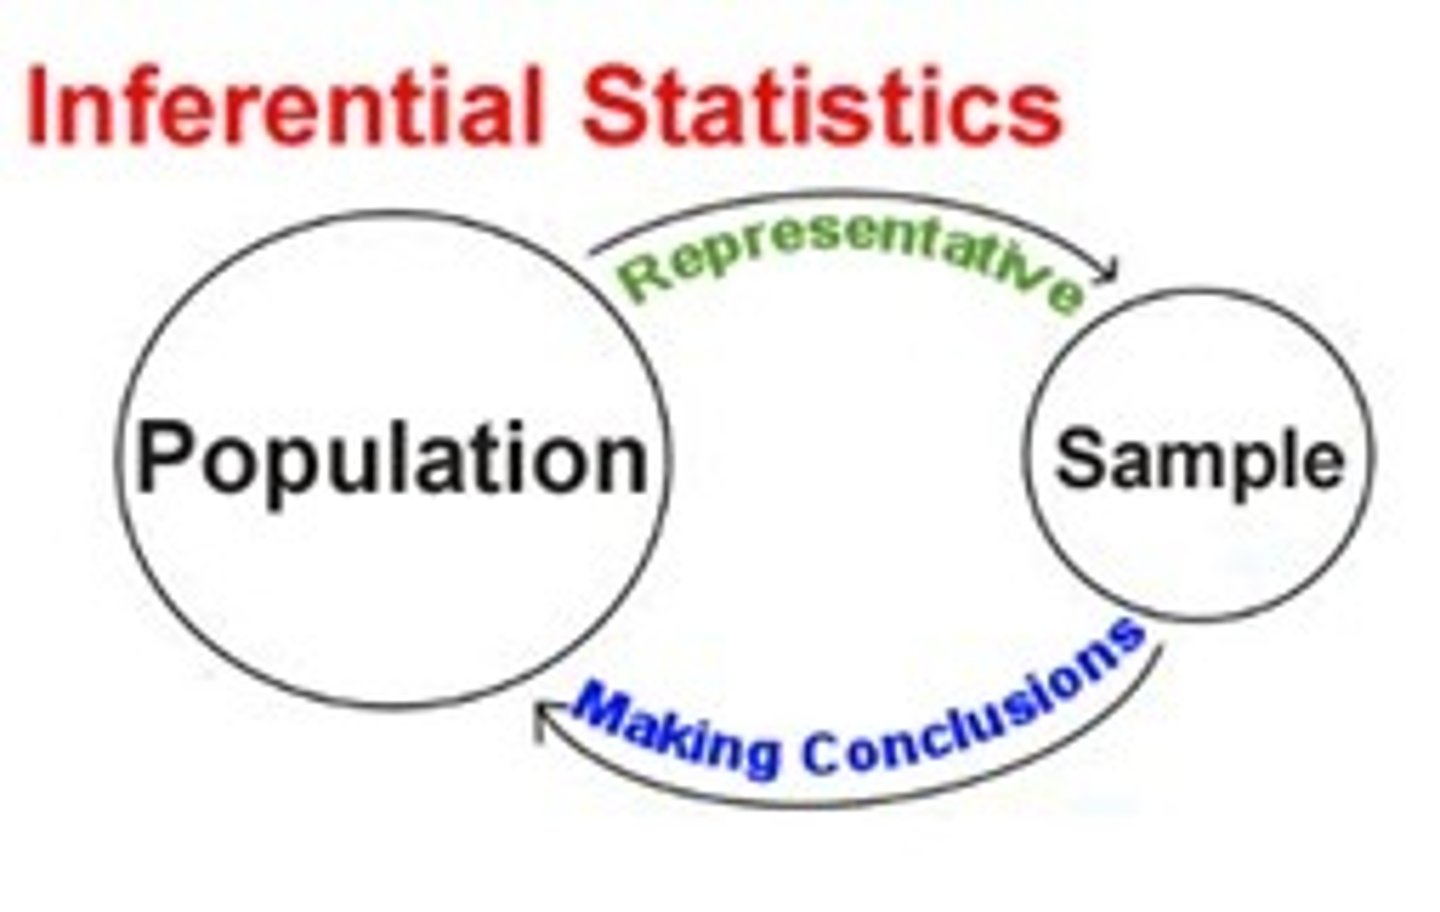
What is the purpose of inferential statistics?
Use data from a sample to infer general patterns and conclusions about a population
Population
The total collection of things (people, trees, animals, etc) that we seek information about

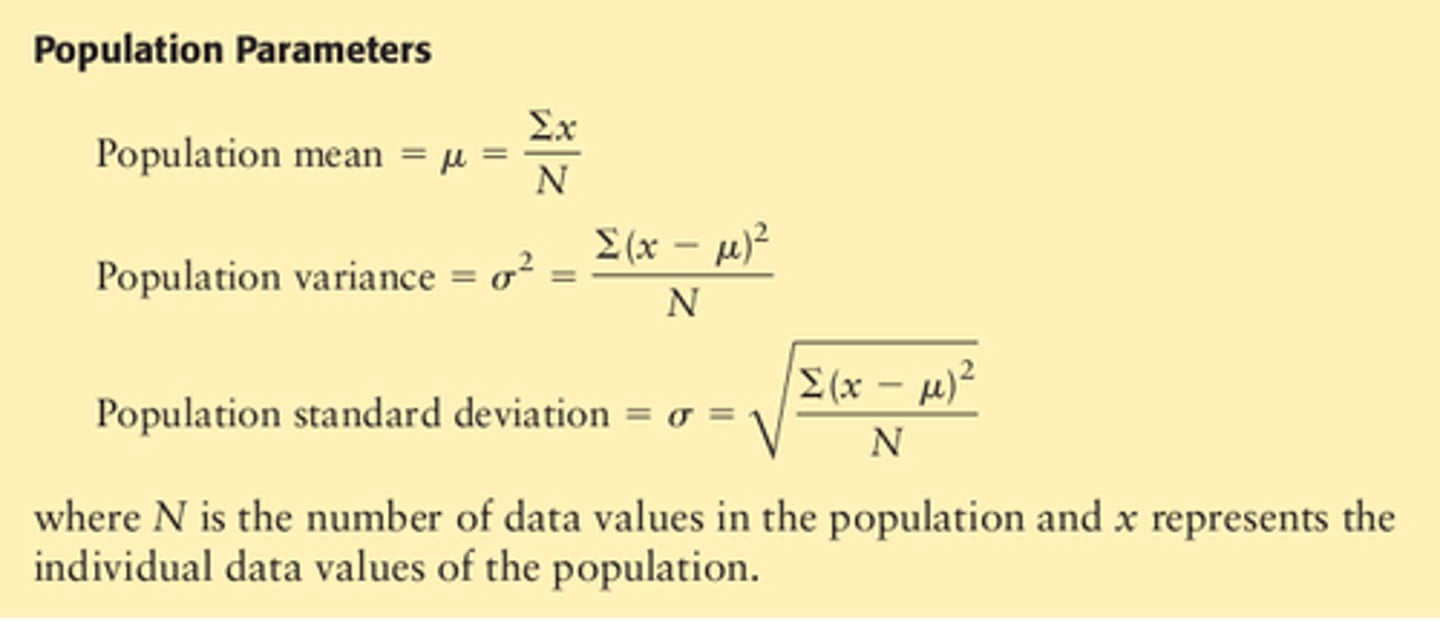
Population Parameter
Any summary number that describes characteristics of the entire population; a fixed quantity or statistical measure that is used as the value of a variable in some general distribution or frequency function to make it descriptive of that population
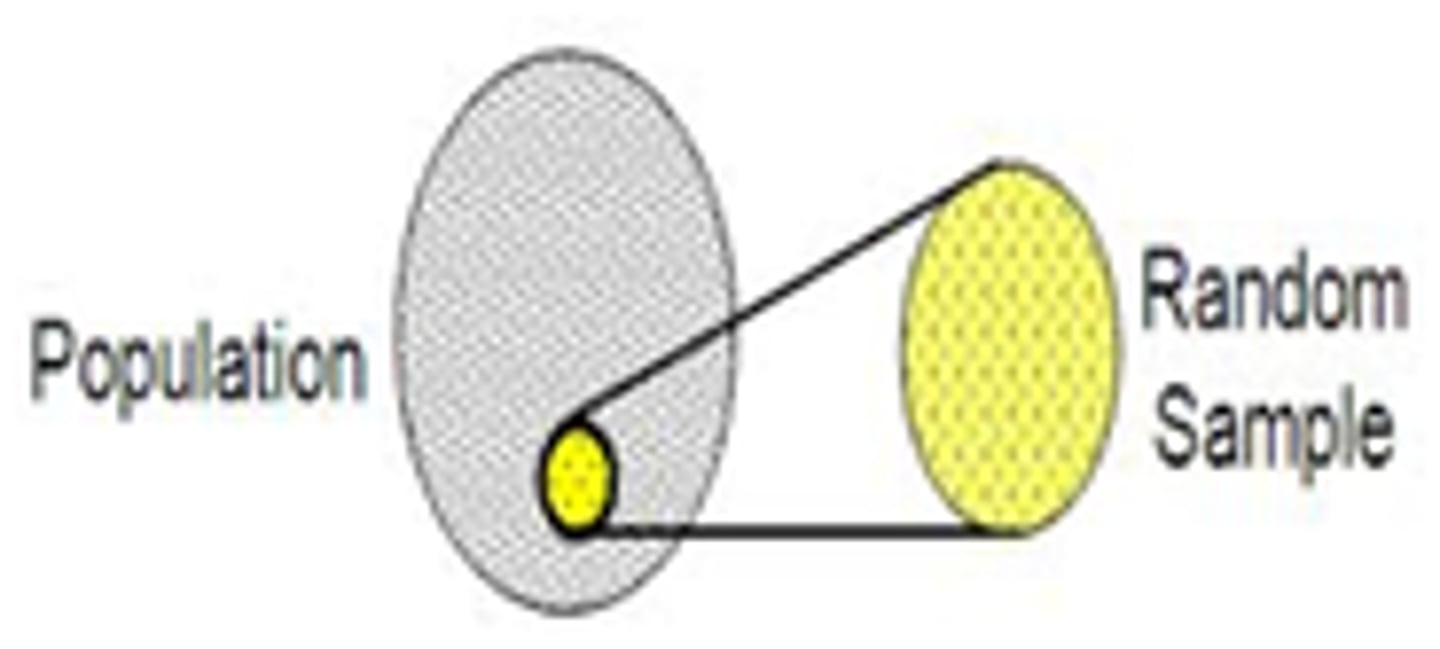
Sample
A representative collection of the things drawn from the population; a subset of the population
Sample (Descriptive) Statistic
Any summary number that describes the sample
Sample Statistic Vs. Population Parameter
Sample Statistic:
n → Number of cases/scores
X̅ → Mean
s² → Variance
s → Standard Deviation
Population Parameter:
N → Number of cases/scores
µ → Mean
σ² → Variance
σ → Standard Deviation
What is the difference between a population parameter and a sample statistic?
1. A population parameter is frequently impractical or impossible to find for large populations while a sample statistic is often easier to find and provides a reasonable approximation to the population parameter
2. Population parameter is a number that describes a whole population while a sample statistic is a number that describes a sample
What are the population, parameter of interest, sample, descriptive statistic, and inference for the question, how much do apples from Wilson's orchard weigh?
Population: All the apples at Wilson's apple orchard
Parameter of Interest: µ (mu) estimated average weight
Sample: A set of 100 apples picked from the trees
Descriptive Statistic: The actual average weight of your sample of apples
Inference: Sample mean = 149 g → population mean = about 149 g
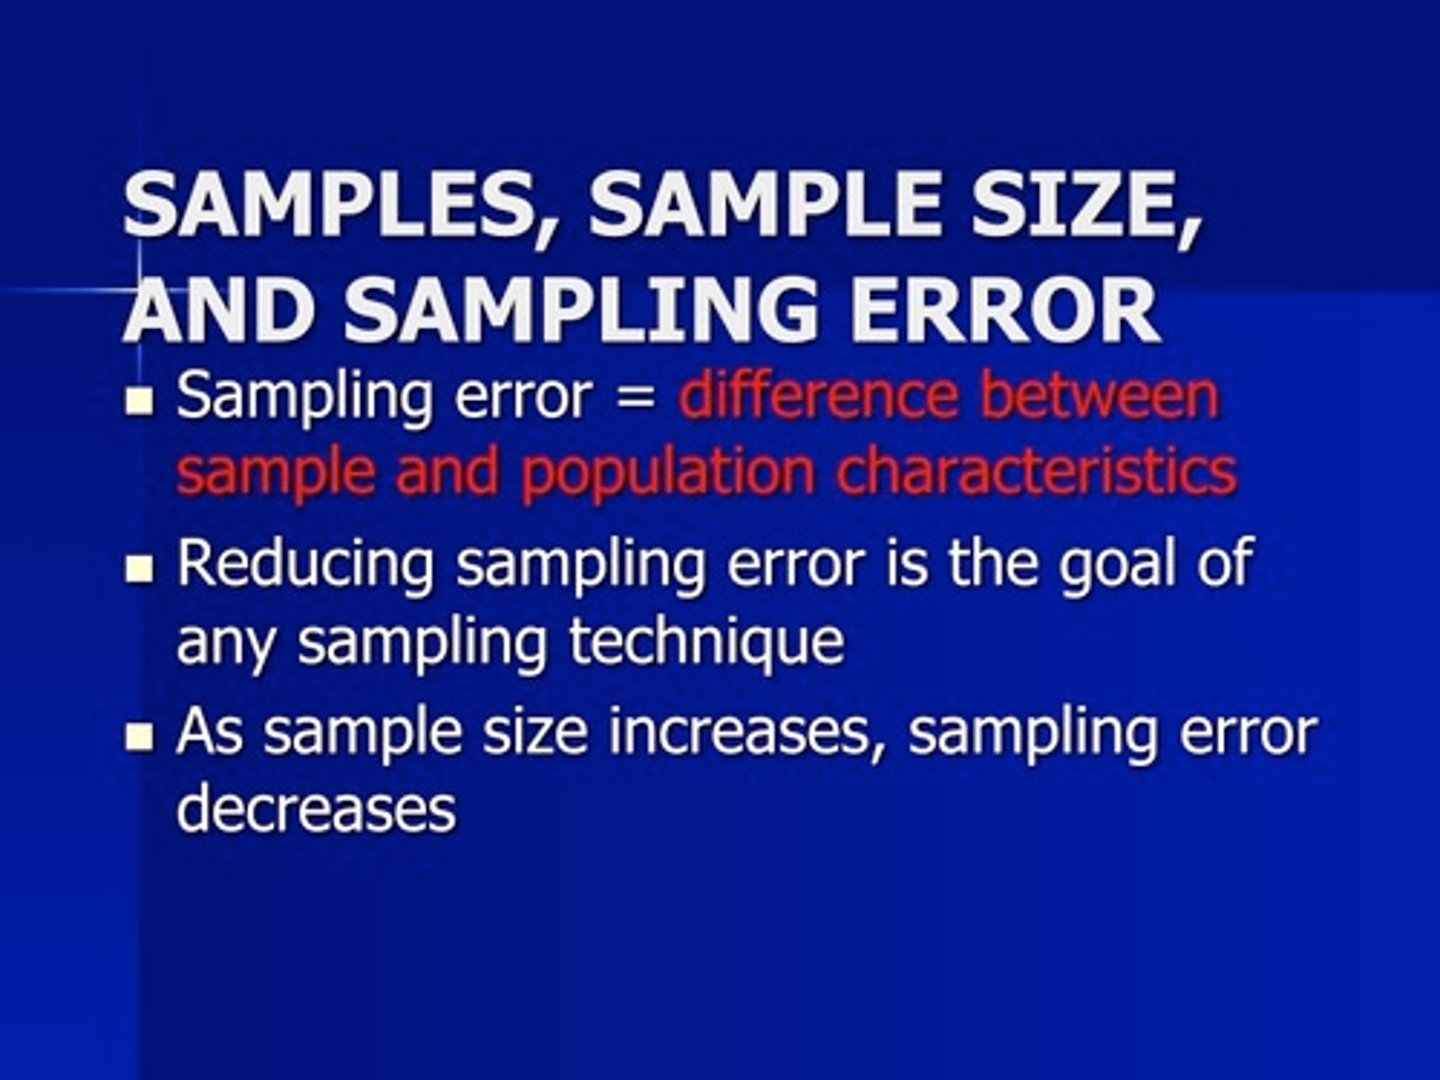
Why can population parameters from samples only be estimated or inferred?
1. Samples differ from each other and may not be able to represent the whole population, which can lead to error
2. A sampling error is the difference between the sample statistic and the population parameter
Sampling Error
An error that occurs when a sample does not represent the target population
What are the population, parameter of interest, sample, and descriptive statistic for the question, how far can a typical University of Iowa undergraduate throw a football?
Population: All of the undergraduate students at the University of Iowa
Parameter of Interest: µ average distance thrown
Sample: A set of 30 students sampled from campus
Descriptive Statistic: The actual average of throwing distance thrown of those in your sample
What are the population, parameter of interest, sample, and descriptive statistic for the question, is there a relationship between social media use and anxiety in teenagers?
Population: All of the teenagers in the world
Parameter of Interest: ρ (rho) correlation between social media use and anxiety
Sample: A set of 200 teenagers sampled from Iowa City
Descriptive Statistic: r correlation between social media use and anxiety computed from your sample
Inference
The process of drawing conclusions about population parameters based on a sample taken from the population
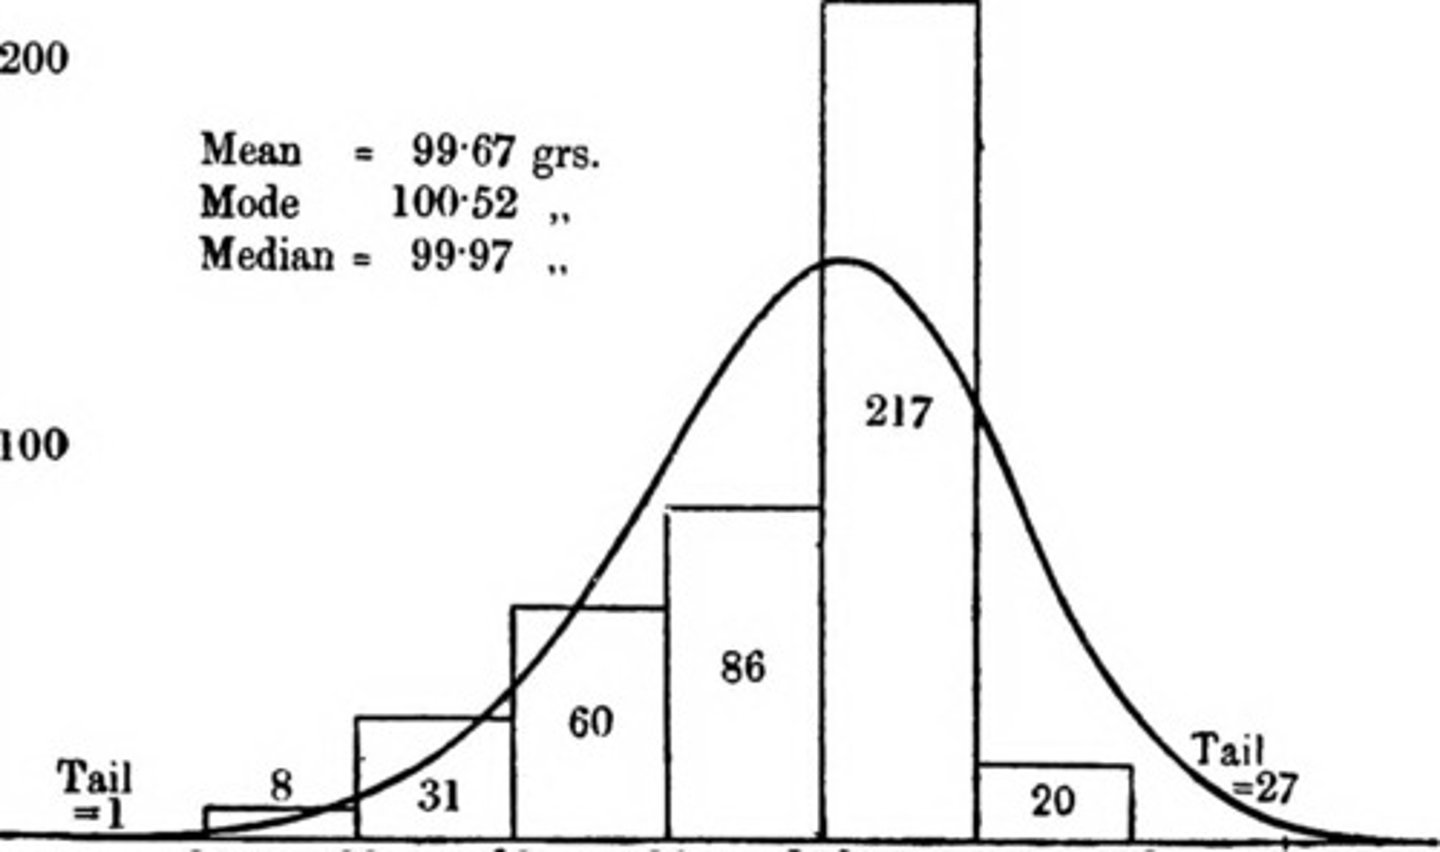
Histogram
A data visualization technique showing how many of the cases in a batch of data scored each possible value (the range of values/distribution) on the variable
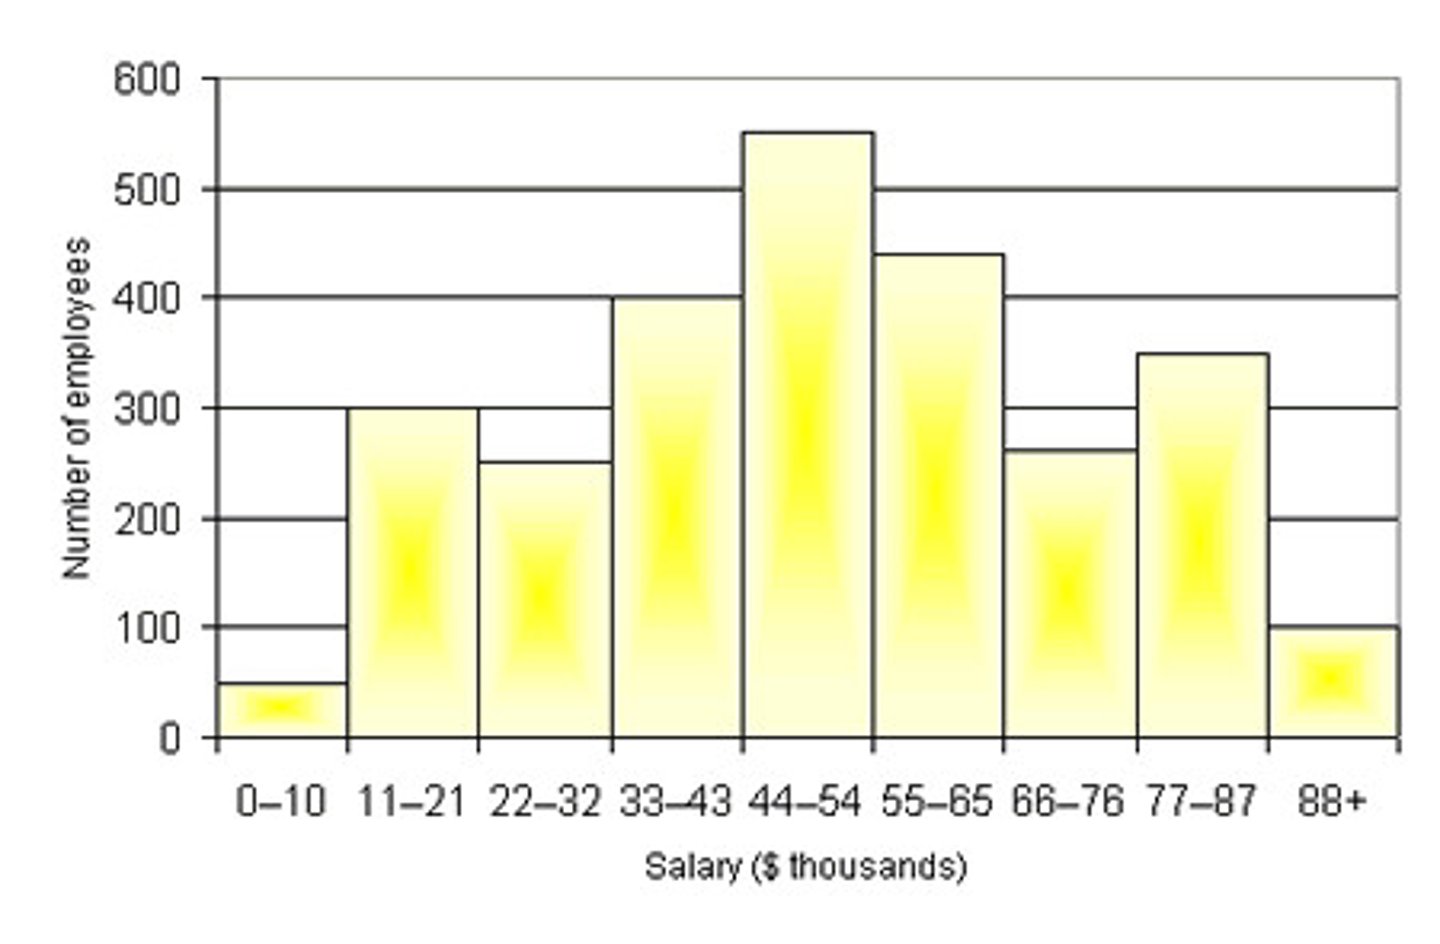
What can be determined from a histogram?
1. Shape of distribution
2. Most common values for each variable
3. The variability of values for each variable
Confidence Interval (CI)
A given range indicated by a lower and upper value that is designed to capture the population value for some point estimate (percentage, difference, or correlation); a high proportion of CIs will capture the true proportion value

What is the purpose of confidence intervals?
1. Helps express a population estimate as a range of best bet
2. Provides a probable range of values that, with a known degree of certainty, includes an unknown population characteristic, such as a population mean
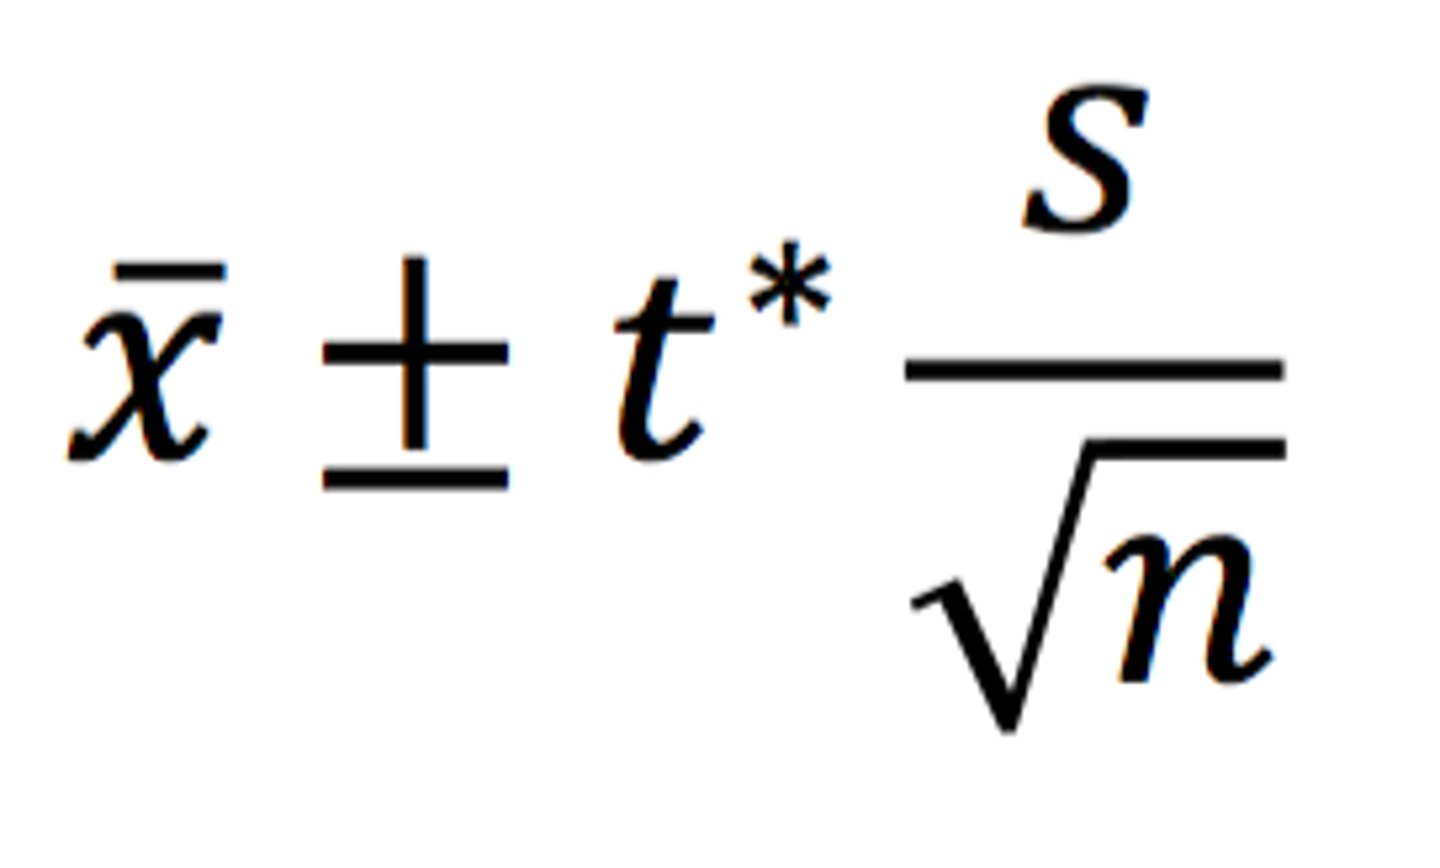
How can you calculate confidence intervals?
CI = X̅ ± z(s/√n)
X̅ = Sample mean
z = Confidence level value
s = Sample standard deviation
n = Sample size
What would the range for a 95% confidence interval be if the sample average is 149?
[147, 151]
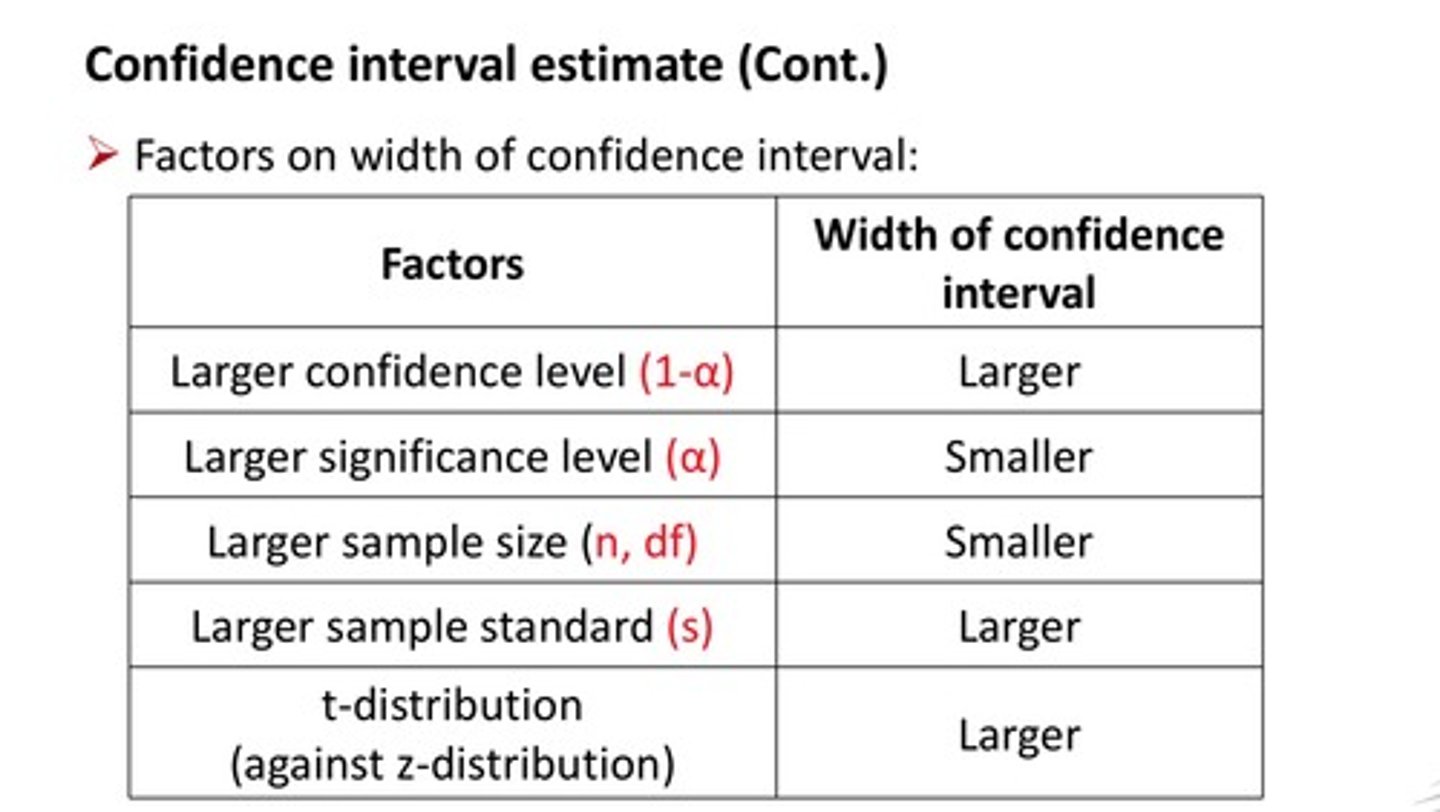
The ___ of confidence intervals gives a probable window for the population parameter
Width
What does the width of the confidence interval measure?
1. The variation within the population of interest (similar population vs. different population)
2. The size of the sample (small sample vs. large sample)
3. Sample size is an important factor in determining confidence interval
What is the relation between population variation and the width of the confidence interval?
1. A population with low variation leads to similar samples with low variation → narrow CI
2. A population with lots of variation leads to varied samples with lots of variation → wide CI
3. Generally speaking, the narrower the CI, the better
4. Narrow CI gives a more precise estimate of the effect size
5. Wider CI gives a less precise estimate of the effect size
6. More studies with similar results and larger studies lead to a narrow CI
Why is the 95% confidence interval used?
1. If repeated samples were taken and a CI was calculated, 95% of the intervals will contain the true mean, and 5% will not
2. Due to the fact that the true mean (population mean) is an unknown value, we do not know if we are in the 5% or the 95%
Ex: "There is a 95% chance that the CI calculated contains the true population"
What does it mean if the mean is 150 with a 95% confidence interval of 147 to 151?
1. 95% of all possible samples should have a mean within this range
2. If the study is repeated 100 times, then the true population mean will be within this range 95/100 times
What are the most typical confidence interval percentages?
1. 90%
2. 95%
3. 99%
What are incorrect ways to state the confidence interval?
1. "95% of apples in the sample weigh between 147 and 151"
Incorrect because confidence interval is not a sample property
2. "There is a 95% chance that the mean weight in the population lies between 149 and 151"
Incorrect because population value is fixed, so it is either within the range or not (the range either contains it or not)
Are confidence intervals only used for means?
No, they can be used for correlation, mean group differences, etc
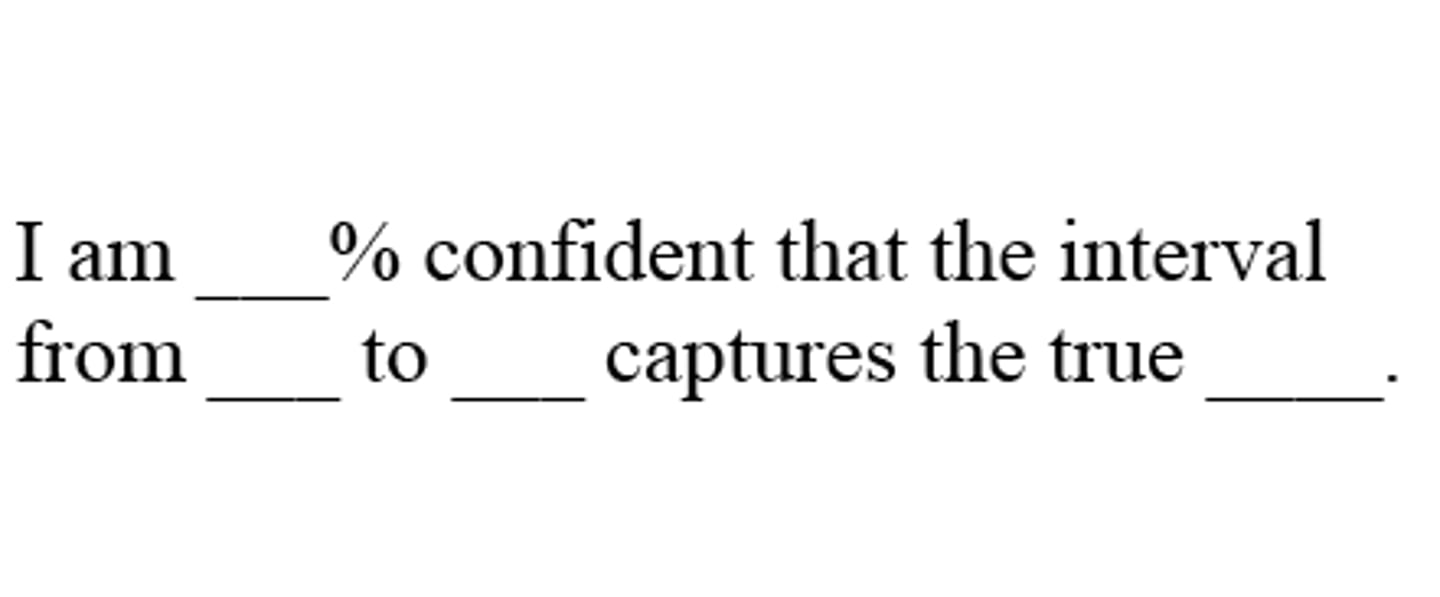
Which one is the correct interpretation?
A. 95% of the apples in Harry's sample weigh between 147 and 151
B. There is a 95% chance that the mean weight of all apples in the population lies between 147 and 151
C. We can be 95% certain that the mean weight of all apples in the population lies between 147 and 151
We can be 95% certain that the mean weight of all apples in the population lies between 147 and 151
A baseball coach was curious about the true mean speed of fastball pitches in his league. The coach recorded the speed in kilometers per hour of each fastball in a random sample of 100 pitches and constructed a 95% confidence interval for the mean speed. The resulting interval was [110, 120]. Which is the correct interpretation?
A. If the coach took another sample of 100 pitches, there's a 95% chance the sample mean would be between 110 and 120
B. About 95% of pitches in the sample were between 110 and 120
C. We're 95% confident that the interval [110, 120] captures the true mean pitch speed
We're 95% confident that the interval [110, 120] captures the true mean pitch speed
___ testing involves testing a prediction against an alternative possibility (falsification)
Hypothesis
What is the purpose of hypothesis testing?
1. Seek to answer a question about population parameters
2. Test a question by collecting data from a sample
Null Hypothesis Significance Testing (NHST)
An inferential statistical technique in which a result is compared to a hypothetical population in which there is no relationship or no difference
What does null hypothesis testing do?
1. Tests against the possibility that there is nothing going on in the data related to the theory
Ex: No association between social media use and anxiety
2. Tests a hypothesis about variables (dependent and independent)
Ex: Students that spend more time outside will have greater wellbeing
3. Tests a hypothesis against a "null model" regarding the dependent variables
Null Hypothesis: H₀: ρ ≤ 0 (against hypothesis)
Alternative Hypothesis: HA: ρ > 0 (consistent with hypothesis)
Ex: People that work outside are happier than people working in offices
Null Hypothesis: H₀: μoutside ≤ μoffice
Alternative Hypothesis: HA: μoutside > μoffice
What questions should be asked regarding null hypothesis testing and probability?
1. What is the probability of the observed data from your sample if the null hypothesis were true?
2. Given the model of the population parameters for the variables, if the null hypothesis were true, what is the probability that you would have observed your data?
What would be the null and alternative hypotheses involving probability for the statement, "Students that spend more time outside will have less anxiety"?
Null Hypothesis: H₀: ρ ≤ 0 (no correlation or positive correlation between time outside and anxiety)
Alternative Hypothesis: HA: ρ > 0 (negative correlation between time outside and anxiety)
What is the Socioemotional Selectivity Theory (SEST), and how can it be tested using null hypothesis testing?
1. As we get older, we perceive we will die soon, and we are motivated to regulate emotions so that we emphasize positive emotions and wellbeing and tune out negative emotions; therefore, we improve our emotional awareness and intelligence with age, which is an explanation for increases in wellbeing during late life, despite all of the other negative ways our body and mind are impacted with age
The theory implies the conceptual prediction that we actually get happier as we get closer to dying
Hypothesis: If SEST, then age should be positively correlated with global wellbeing as measured by the WB ladder for those between 40 and 90 years of age
2. Two possibilities in the population:
Null: This effect does not exist in the population
Alternative: This effect does exist in the population
3. Test these predictions with data from the sample
Compute correlation from sample: r = .60
How close is this estimate to the population relationship? → get confidence interval
What is the probability that I could have gotten this correlation if the correlation in the population were r = 0?
4. Assign a p-value to infer, where p stands for probability
P-Value
In NHST, the probability of getting the results in a sample or one more extreme, by chance, if there is no relationship or difference in the population; the probability that you would have observed your data if the null hypothesis were true
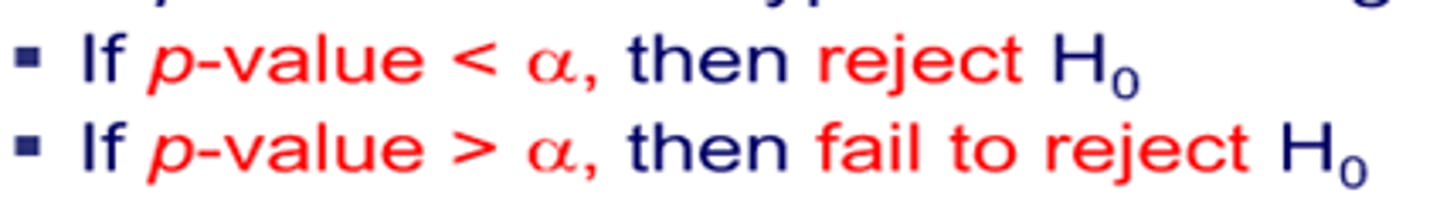
What does a low p-value indicate?
1. A low p-value indicates that the sample result would be unlikely if the null hypothesis were true (p < .05)
2. Strong evidence against null
3. Reject the null hypothesis
What does a high p-value indicate?
1. A high p-value indicates that the sample result would be likely if the null hypothesis were true (p > .05)
2. Not strong evidence against null
3. Observed relation/difference due to chance
4. Retain (fail to reject) the null hypothesis
Why are results about the null hypothesis and not the alternative hypothesis?
Tests are performed with respect to the null hypothesis to determine whether the predicted relationship would be observed if the null hypothesis were true
What does it mean if p < .05?
1. There is less than a 5% chance of obtaining the result if the null model were true for the population (by chance)
2. There is less than a 5% chance for the observed relationship if there was none in the population
3. Reject the null hypothesis
4. Accept the alternative hypothesis
5. If the p-value is less than the chosen cutoff, the result is "statistically significant"
6. Reject null and infer that the predicted effect likely exists in the population → theory supported
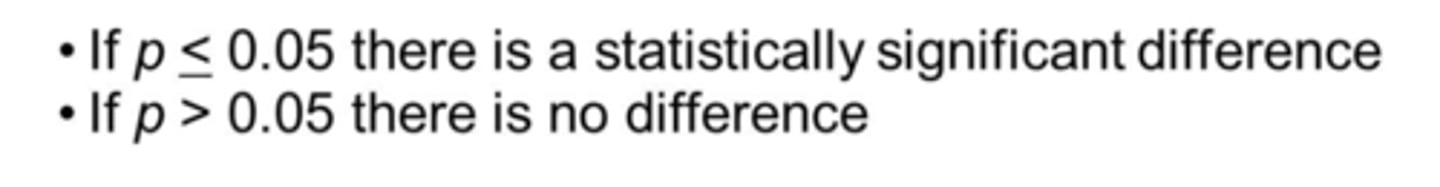
Statistically Significant
In NHST, the conclusion assigned when p < .05; when it is unlikely that the result came from the null hypothesis population
What does it mean if p > .05?
1. There is greater than a 5% chance of obtaining the result if the null model were true for the population (by chance)
2. There is greater than a 5% chance that no relationship exists in the target population
3.. Retain (fail to reject) the null hypothesis
4. Never say a null hypothesis is proven
5. If the p-value is equal to or greater than your chosen cutoff, the result is "not statistically significant"
6. Fail to reject null and infer that the predicted effect unlikely exists in the population → theory is not supported and needs revision

Not Statistically Significant
In NHST, the conclusion assigned when p > .05; when it is likely that the result came from the null-hypothesis population
How can decisions be made regarding the null hypothesis?
1. Truth is effect present (Ho false, HA true) + decision is effect present (Reject Ho, accept HA) = Correct
2. Truth is effect present (Ho false, HA true) + decision is no effect present (Retain Ho, reject HA) = Type II Error (miss)
3. Truth is no effect (Ho true, HA false) + decision is effect present (Reject Ho, accept HA) = Type I Error (false alarm)
4. Truth is no effect (Ho true, HA false) + decision is no effect present (Retain Ho, reject HA) = Correct
Type I Error
Saying an effect exists when it does not (false positive); worst kind of error
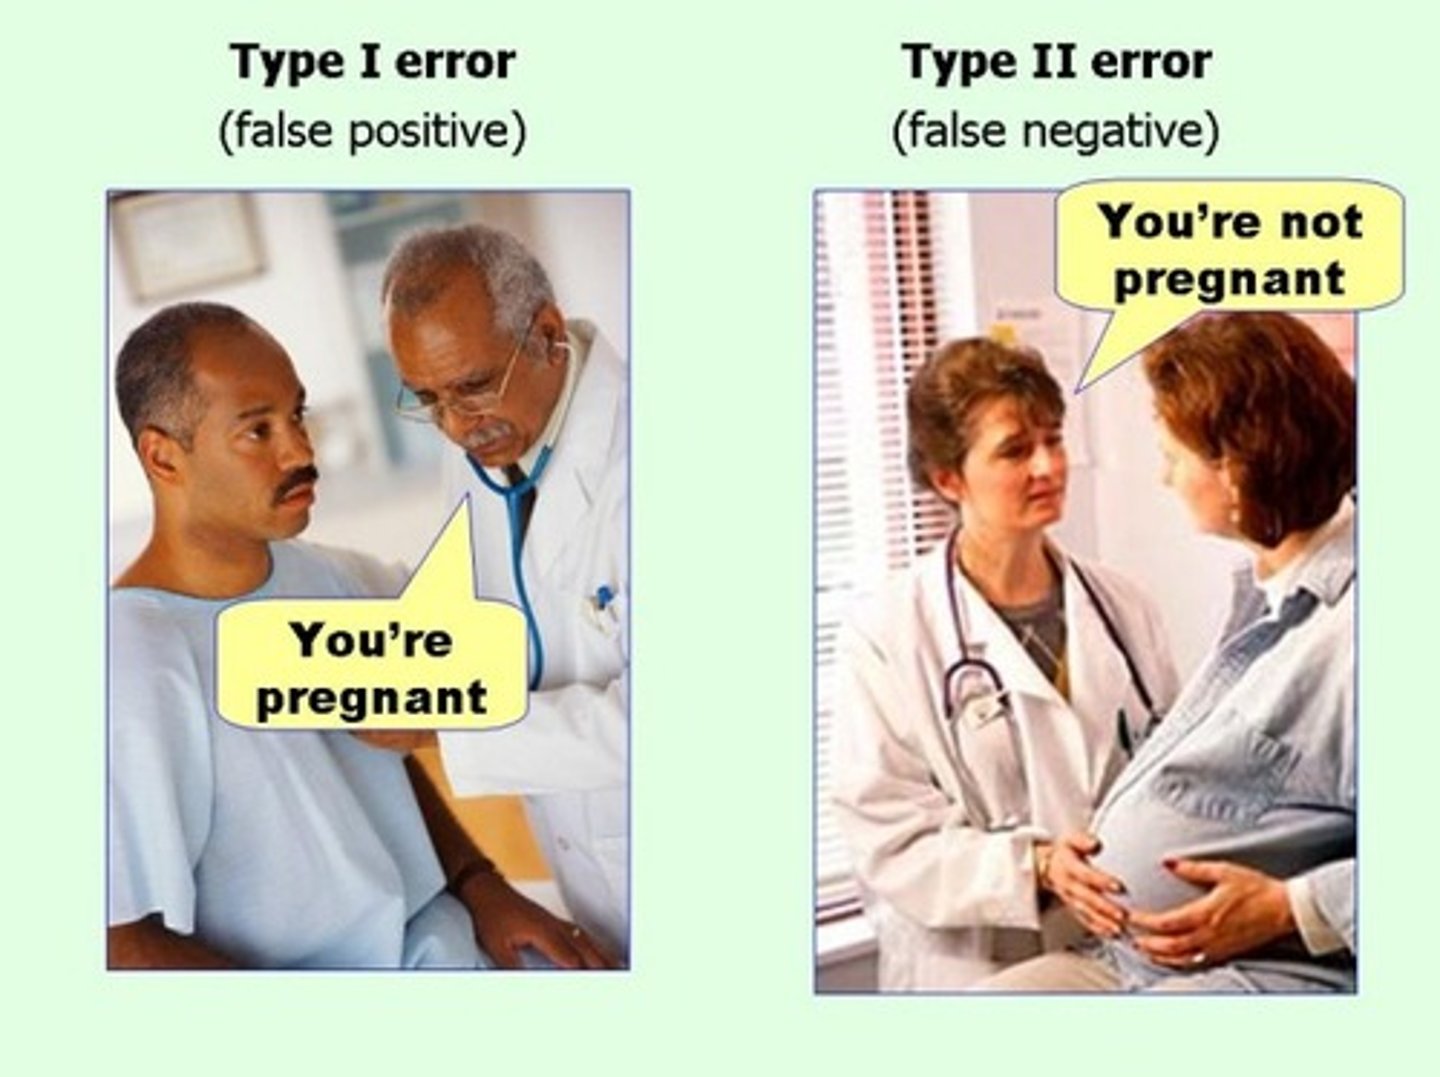
Type II Error
Saying no effect exists when one is there (false negative or miss); not as damaging (conservative approach)

What might be the cause of a type I error?
False positive/alarm (type I error controlled/prevented by using a stringent p-value threshold)
Statistical Power
The probability that a study will show a statistically significant result when some effect is truly present in the population; inversely related to type II error (high power means low type II error)
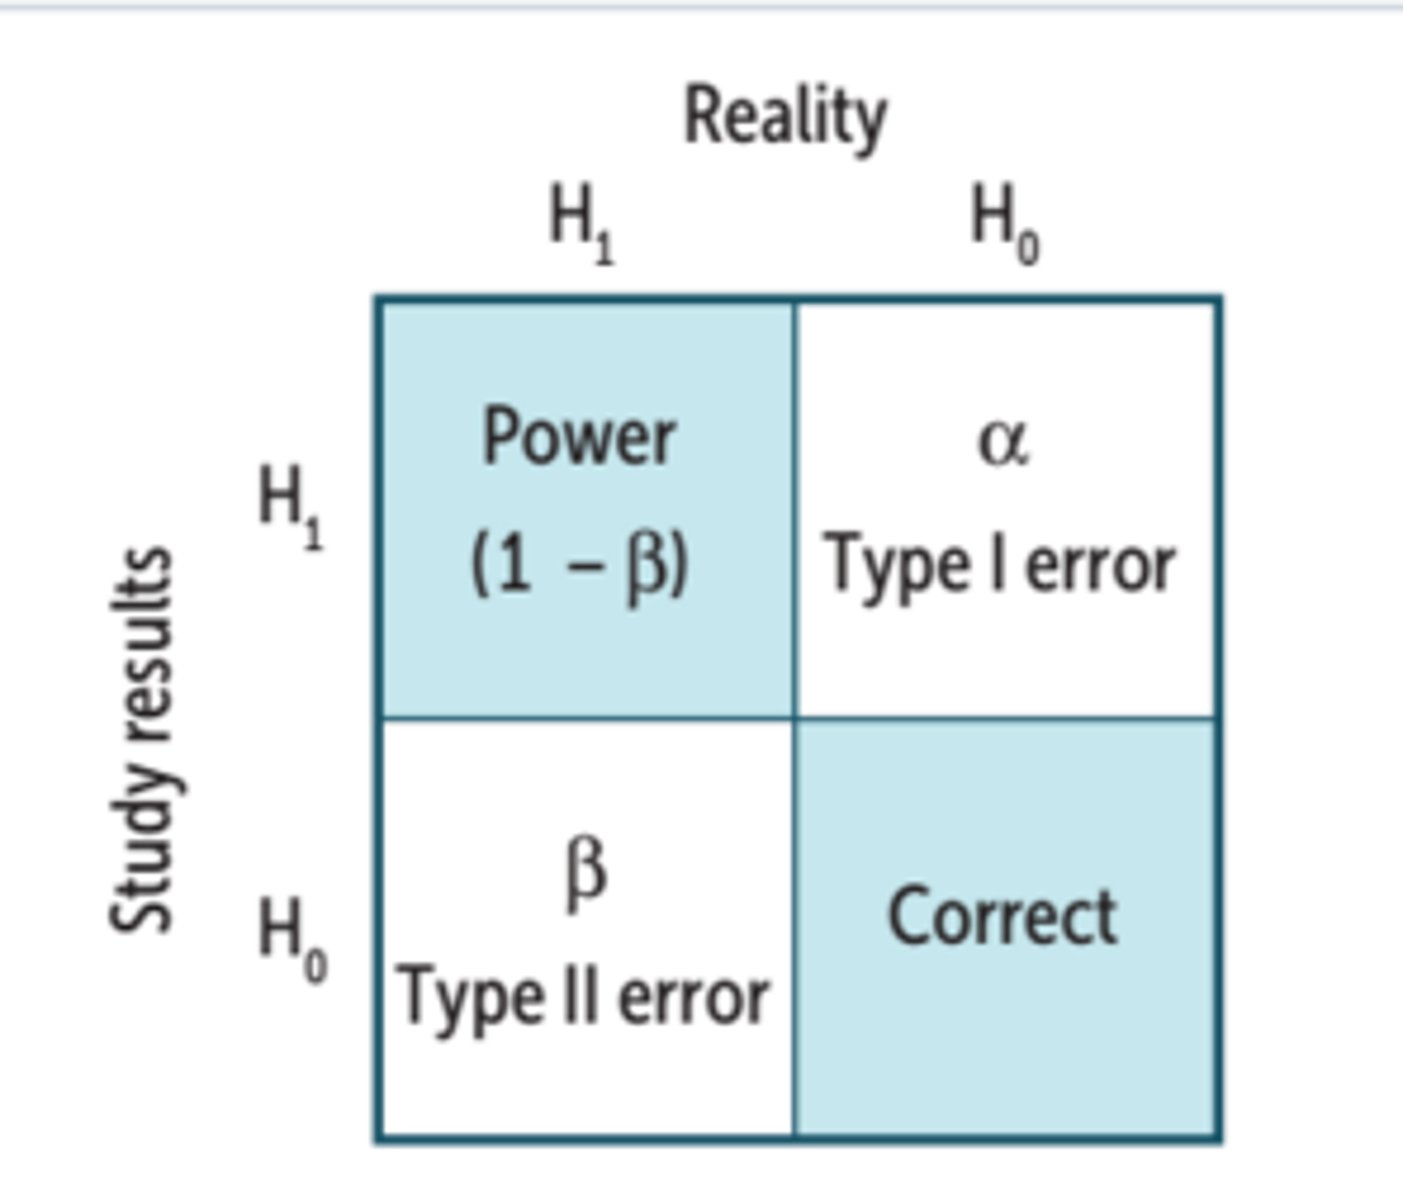
What is the calculation for statistical power?
1 — Probability of type II error
What can cause type I errors when you say an effect exists that really doesn't?
Alpha level = type I error rate
What can cause type II errors when you miss an effect that really exists?
1. Alpha level is too stringent (p < .001)
2. Small sample size
3. Alpha level is too stringent (p < .001)
4. Random variability (measurement error, individual differences, situation noise)
5. Wrong choice of statistical test
How can type II errors be reduced?
1. Make alpha level less stringent (p < .05)
2. Increase sample size
3. Be careful about over-interpreting a null effect
When using inferential statistics, researchers calculate a/an ___ to determine "statistical significance"
A. Null hypothesis
B. Degrees of freedom
C. Population parameter
D. Probability estimate
Probability estimate
My alpha is currently set at p = .05 (5%), but I decide to lower it to p = .001 (.1%). This will ___ my risk of making a type I error, and ___ my statistical power.
A. Decrease; increase
B. Decrease; decrease
C. Increase; increase
D. Increase; decrease
Decrease; decrease
Data-Driven Research
Reasoning from the data to the general theory
Theory-Driven Research
Reasoning from a general theory to the data
Students in research methods last semester had an average of 741 facebook friends and 499 instagram followers. What kind of statistic is reported?
A. Descriptive
B. Inferential
C. Neither
Descriptive
In last semester's class, there was a positive correlation of r = .48 between facebook friends and instagram followers. What kind of statistic is reported?
A. Descriptive
B. Inferential
C. Neither
Descriptive
A random sample of high school students was selected to take an SAT preparation course. After completing the course, the mean SAT score for this group of students was 25 points higher. What kind of statistic is reported?
A. Descriptive
B. Inferential
C. Neither
Descriptive
The 95% confidence interval for how far a University of Iowa undergraduate can throw a football is 15 to 45 yards. What kind of statistic is reported?
A. Descriptive
B. Inferential
C. Neither
Inferential
A student is interested in estimating how far the average University of Iowa student can throw a football. They collect a sample of 500 students from the quad, and another student who is interested in this question collects data from a sample of 50 students. Whose confidence interval is likely larger?
A. Sample N = 500
B. Sample N = 50
Sample N = 50; the sample size is smaller, which results in a larger/wider confidence interval
What is meant by the characteristic of exhaustiveness in the frequency table bins?
A. Outliers are included
B. Each items fits in no more than one bin
C. Every item fits into a bin
D. Each bin has the same range
Every item fits into a bin
As your sample size increases ___.
A. Your confidence interval gets narrower
B. Your confidence level increases
C. Your confidence level decreases
D. Your confidence interval gets wider
Your confidence interval gets narrower
In previous studies, Dr. Schulenberg has established that finding meaning in one's everyday work activities can lead to greater success in the workplace (e.g., productivity, creativity). He is curious as to whether this can happen in the college classroom. Specifically, he is curious whether finding meaning in one's classroom experience can lead to greater academic performance. In the spring semester, he has his teaching assistant randomly assign half the class to write a paragraph each class period about how the material has meaning for their lives (meaning group). The other half writes a paragraph about what they did to prepare for class (preparation group). To measure academic performance, he gives the students a midterm essay exam and a final exam. What is the null hypothesis in this study?
A. There is not sufficient information to answer the question
B. Meaning group has greater academic performance than preparation group
C. Preparation group presents greater academic performance than meaning group
D. There is no difference between the meaning and preparation group in terms of their academic performance
There is no difference between the meaning and preparation group in terms of their academic performance
You test your hypothesis that greater time outdoors is related to less anxiety. Your correlation is r = -.40, p = .08. Your conclusion should be to ___.
A. Report your correlation as statistically significant
B. Fail to reject the null hypothesis
C. Reject the null hypothesis
D. Support the alternative hypothesis
Fail to reject the null hypothesis
Dr. Demir-Lira is interested in examining if there is a correlation between the number of Facebook friends one has and his/her self-esteem. She collects a sample of 800 students from the quad. John, interested in this question, collects data from a sample of 80 students. Ariel collects data from 8 students to address the same question. Sojeong collects data from 8000 students. Whose confidence interval is likely largest?
A. Sample size does not influence the size of the confidence interval
B. n = 80
C. n = 8
D. n = 800
n = 8
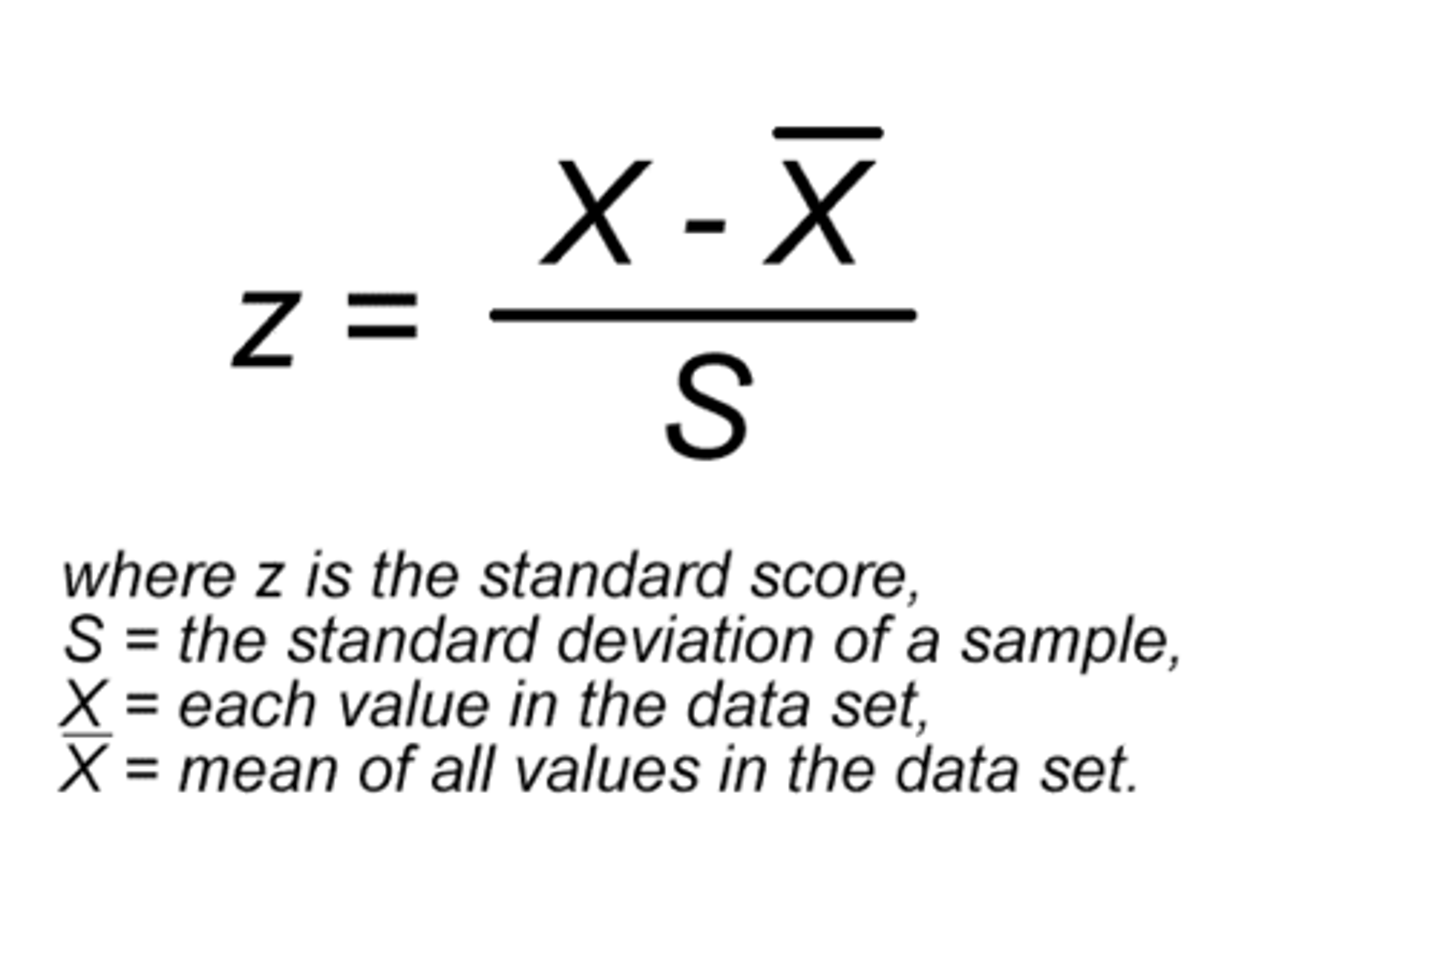
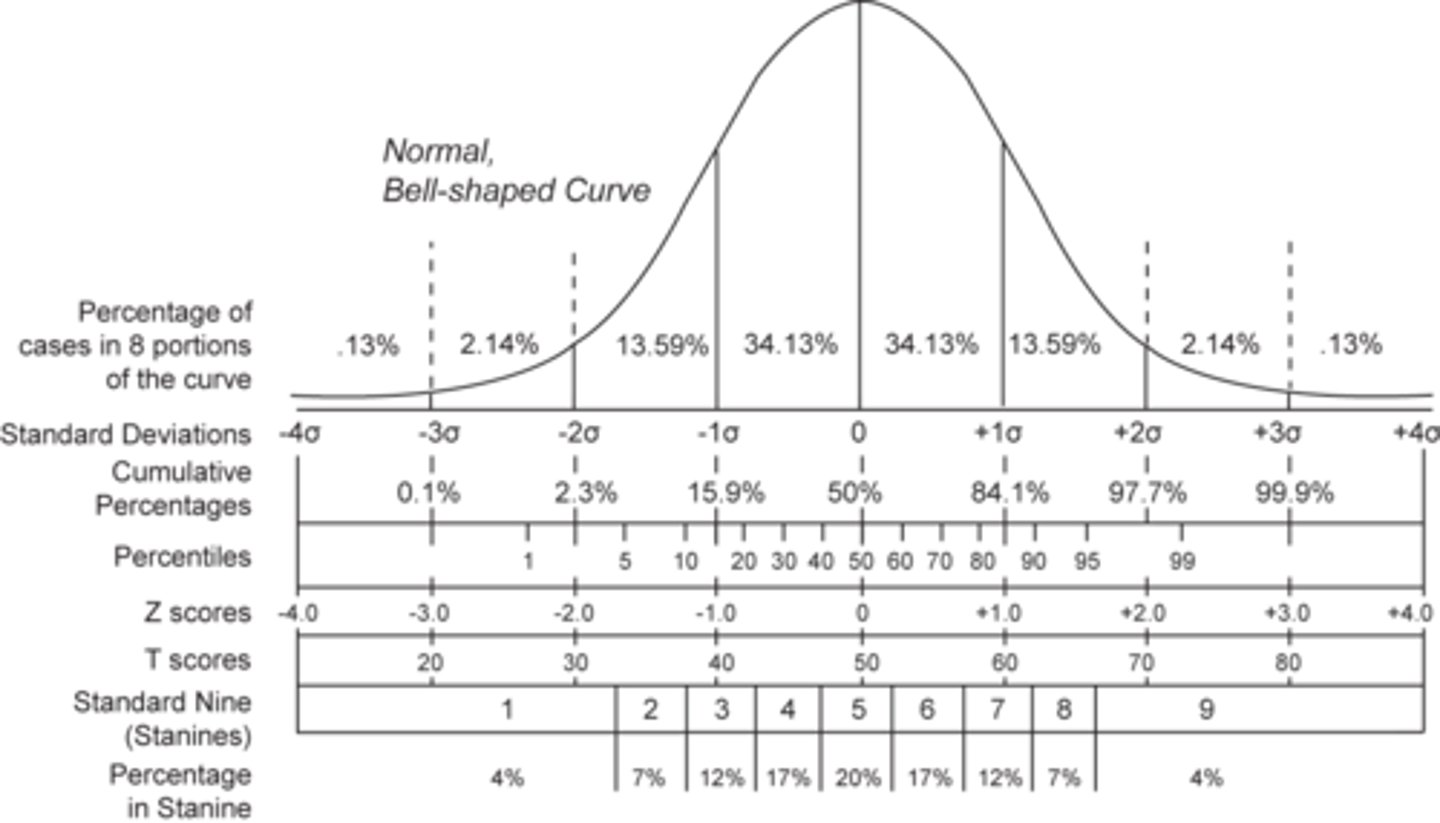
Z-Score
A measure that describes how far an individual score is above or below the mean in units of standard deviations, rather than in units of the original variable
What do z-scores indicate?
Z-scores indicate how many standard deviations a score is above or below the mean of its distribution
What do z-scores less than, greater than, and equal to 0 mean?
1. A z-score less than 0 represents an element less than the mean
2. A z-score greater than 0 represents an element greater than the mean
3. A z-score equal to 0 represents an element equal to the mean
What do z-scores equal to 1 and -1 mean?
1. A z-score equal to 1 represents an element that is 1 standard deviation greater than the mean
2. A z-score equal to -1 represents an element that is 1 standard deviation less than the mean
What do z-scores equal to 2 and -2 mean?
1. A z-score equal to 2 represents an element that is 2 standard deviations greater than the mean
2. A z-score equal to -2 represents an element that is 2 standard deviations less than the mean
What units are used to calculate z-scores?
Units of standard deviation are used when calculating z-scores because it makes them helpful for comparing across measures with different units of measurement
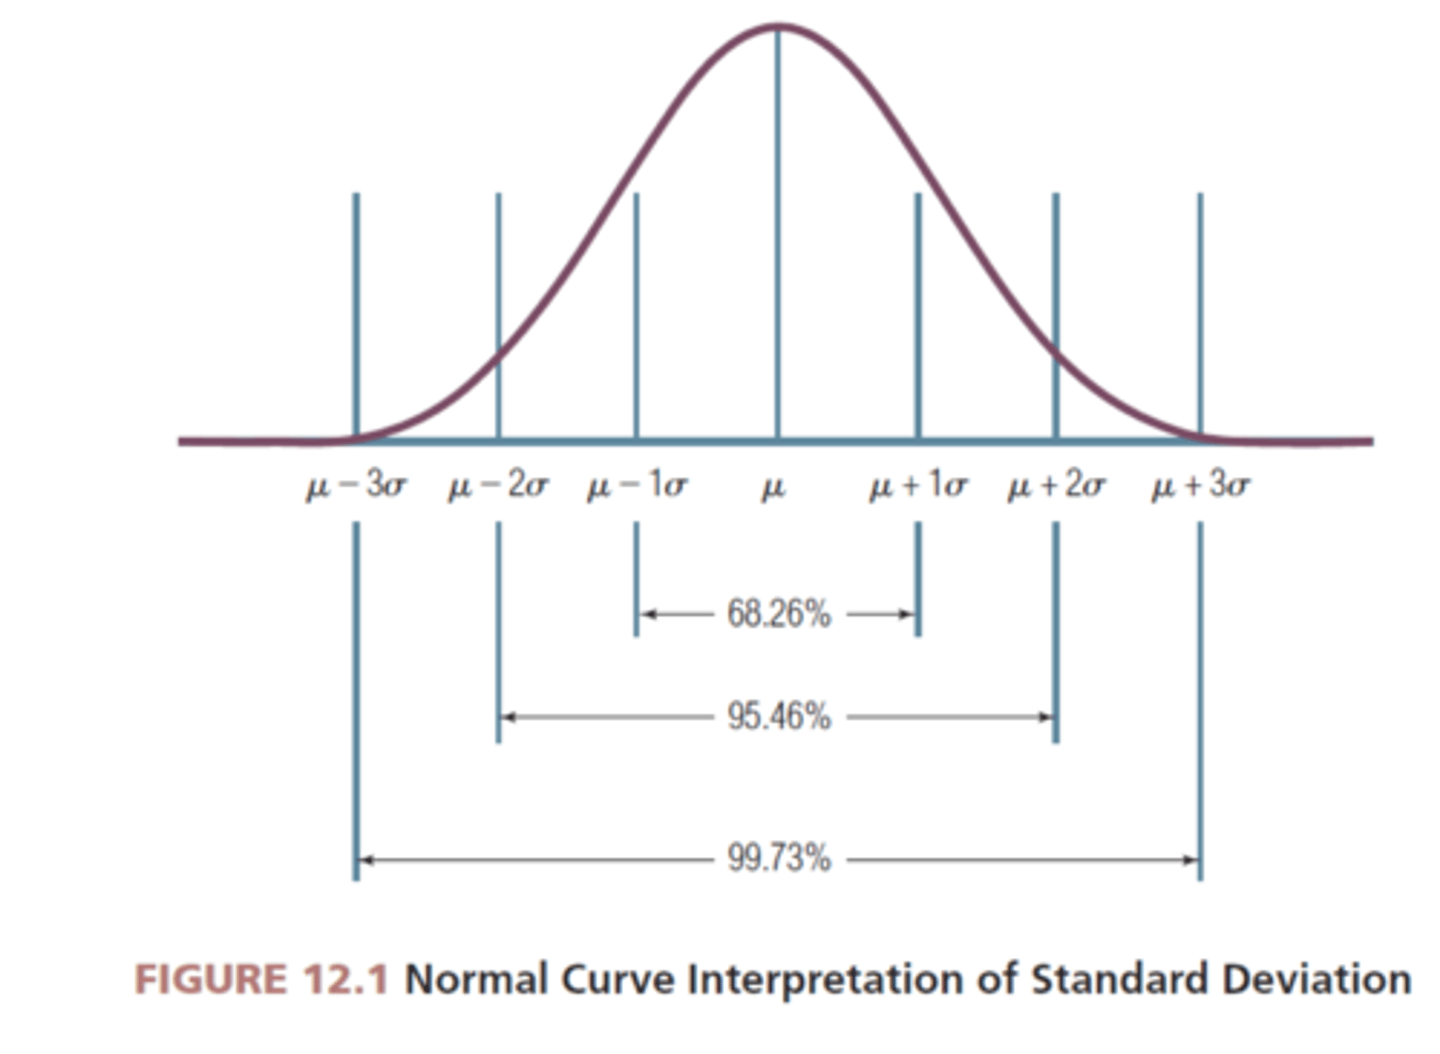
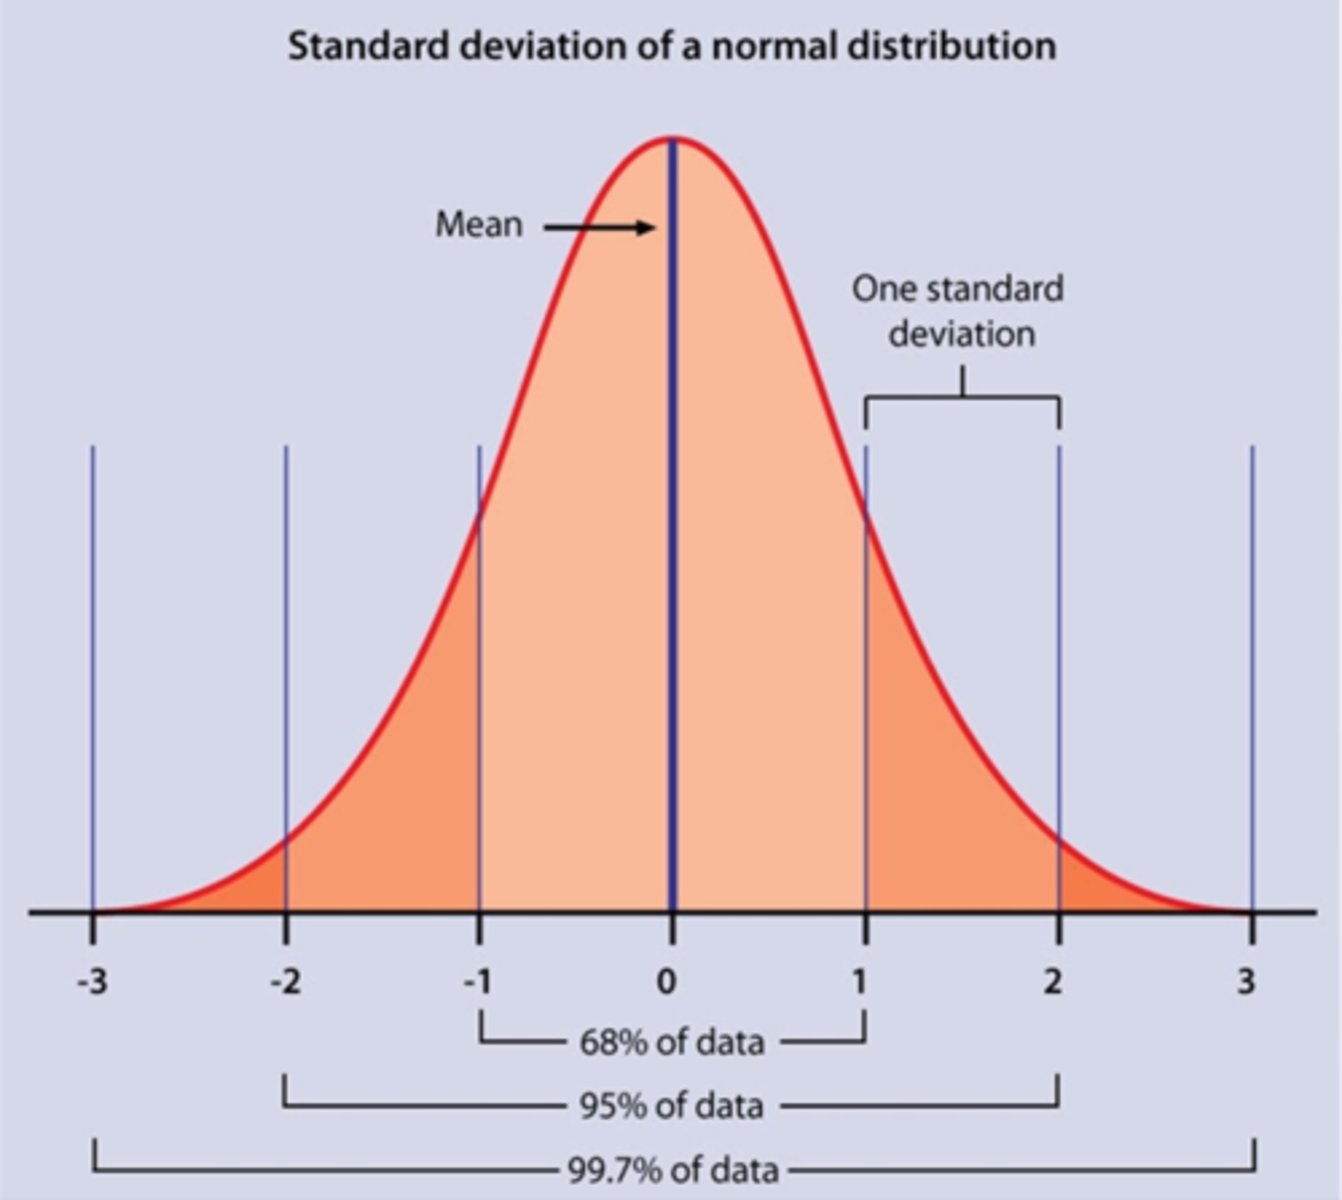
What are the two parameters that describe a normal distribution?
1. Mean
2. Standard deviation

Standard Normal Curve
A theoretical normal distribution with a mean of 0 and a SD of 1
What is the difference between normal distributions and standard normal distributions?
1. The standard normal is one set of parameters for a normal distribution (μ = 0, σ = 1)
2. Any normal distribution can be standardized (z-scored) to a standard normal distribution, which is defined as having a μ = 0 and σ = 1
Z-scores talk about data in terms of distance in ___ from the mean, and initial units are ignored
Standard deviations (SDs)
A z-score of ___ always means 1 SD above the mean
1
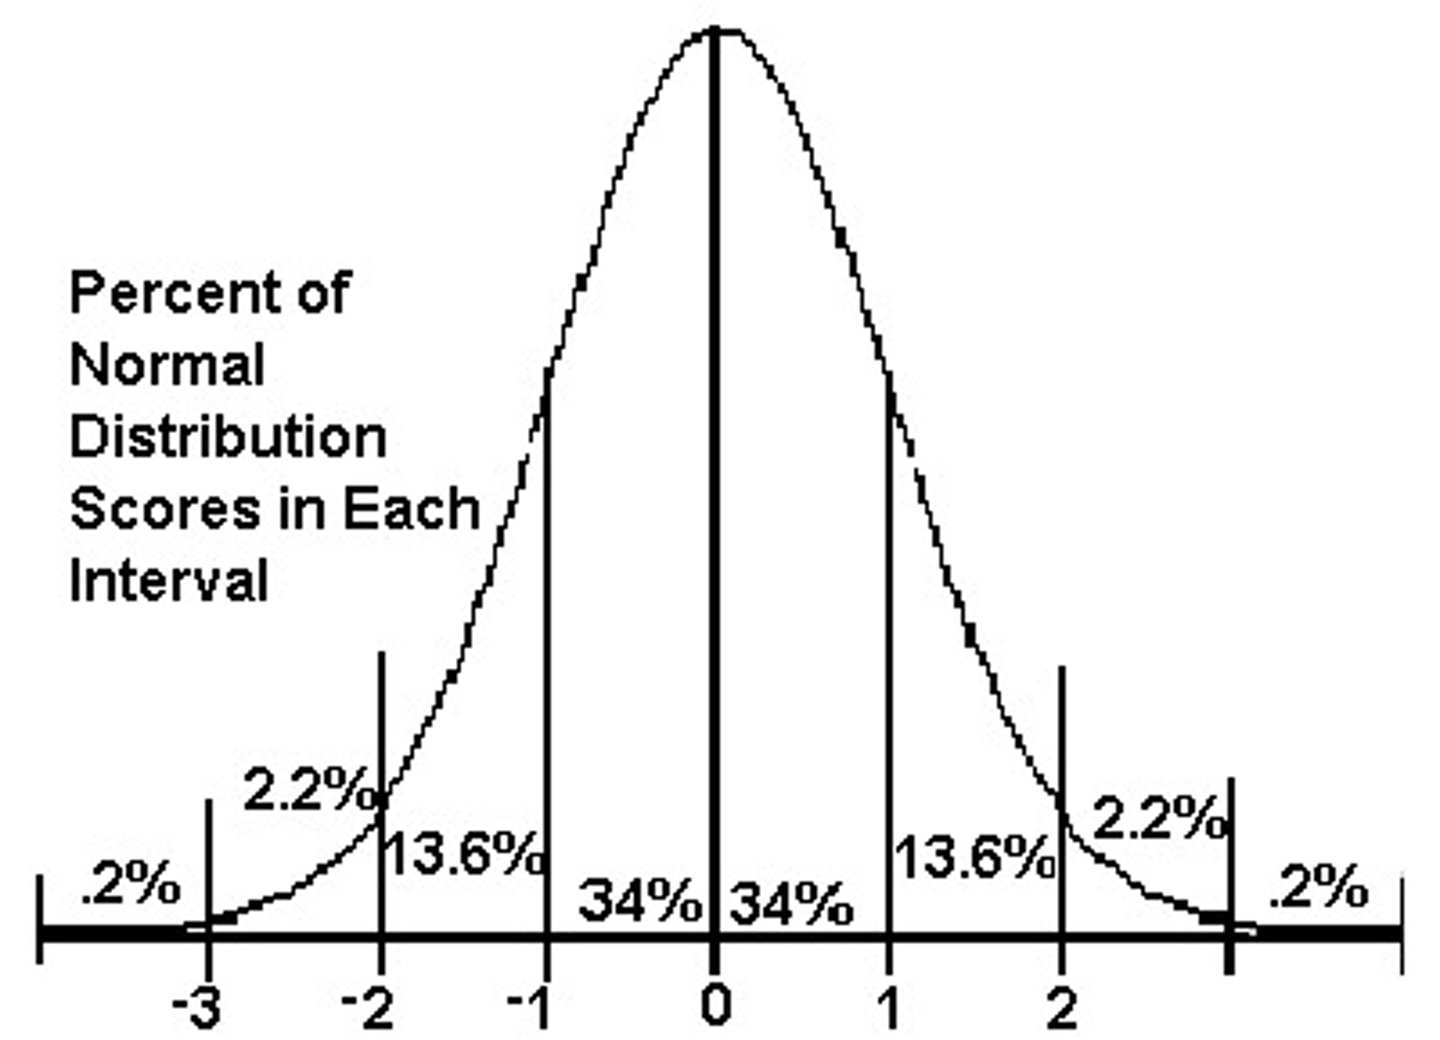
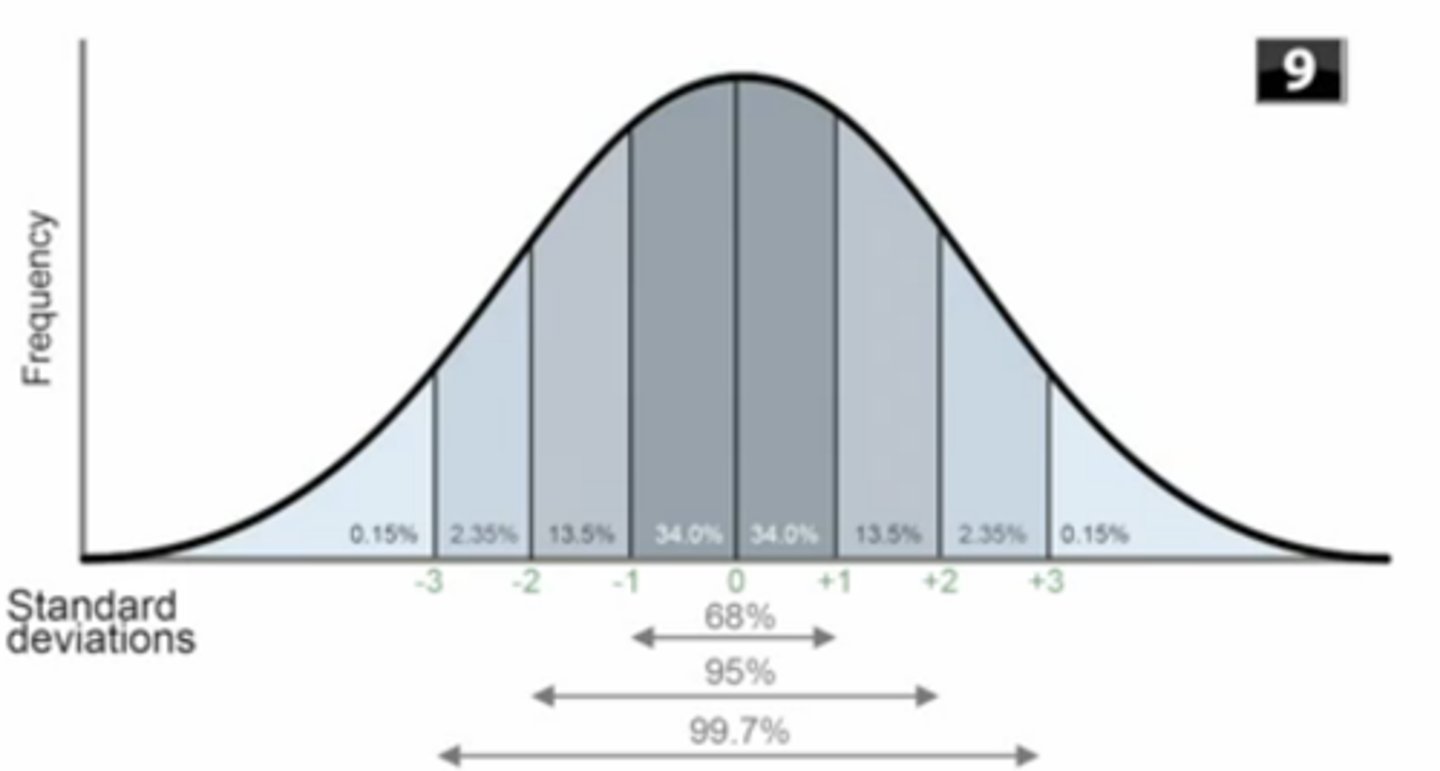
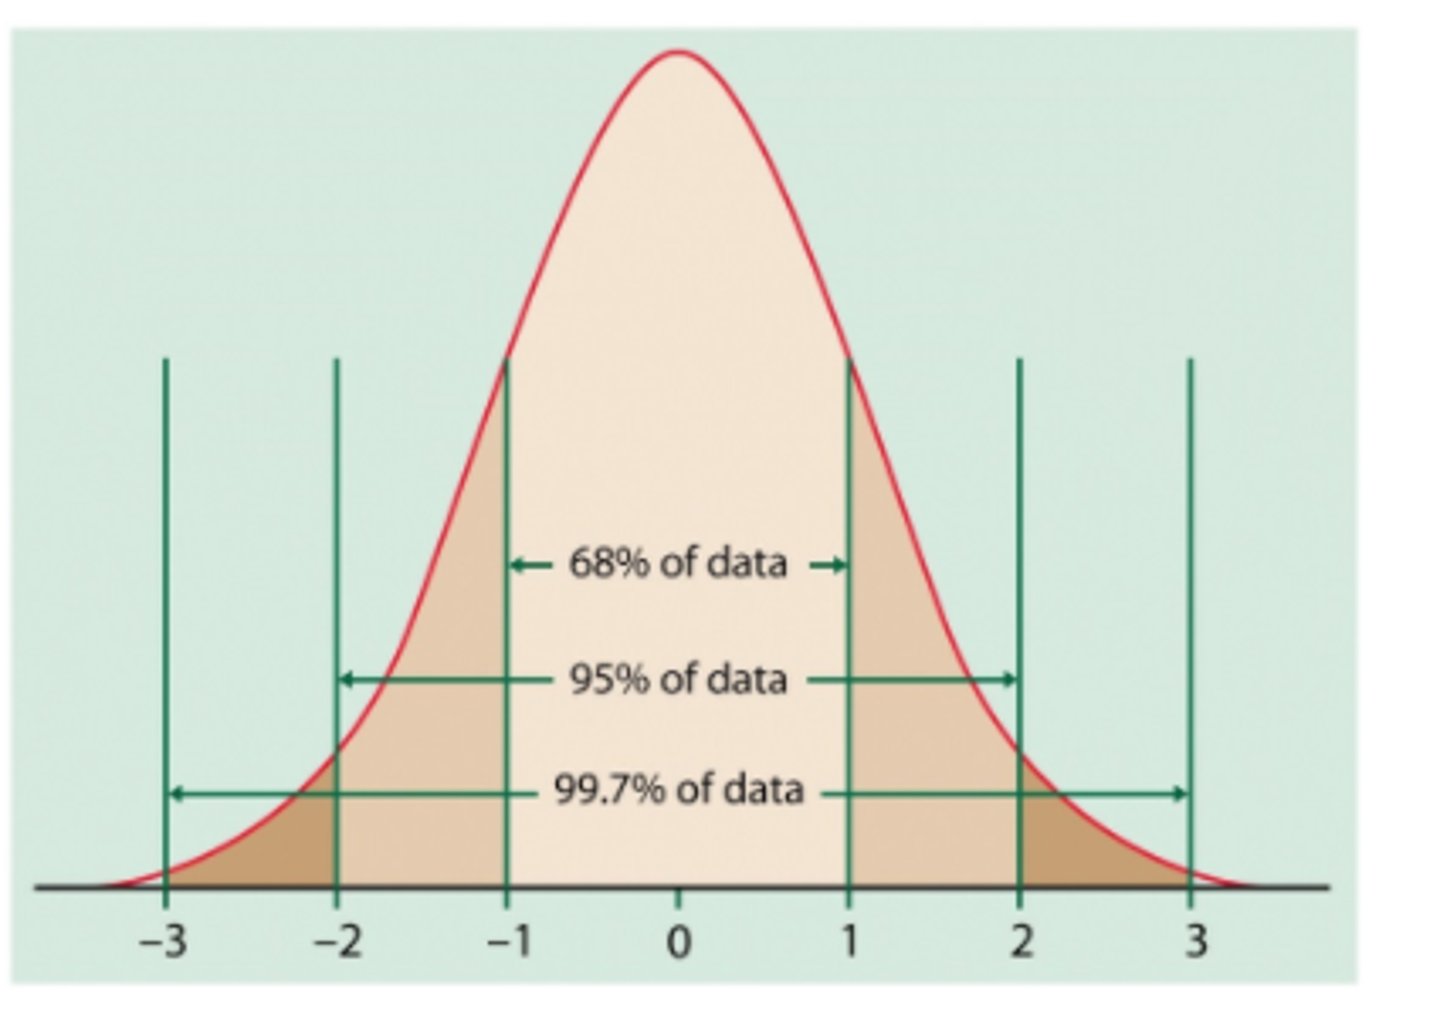
What percentage of scores are within 1 SD from the mean?
68%
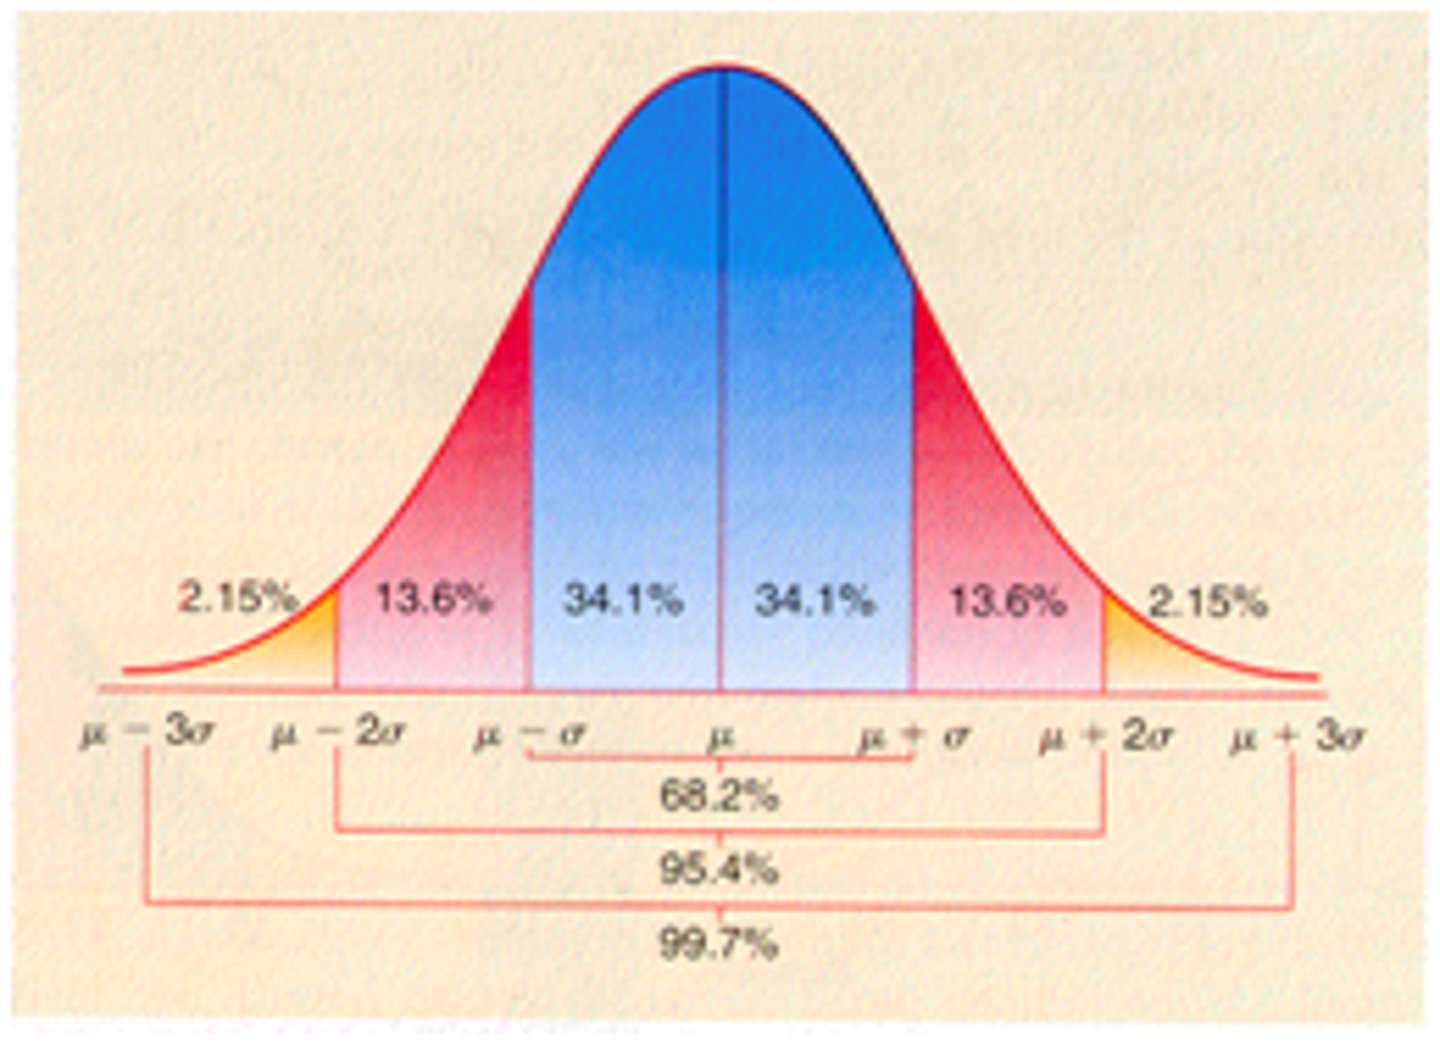
What percentage of scores are within 2 SDs from the mean?
95%
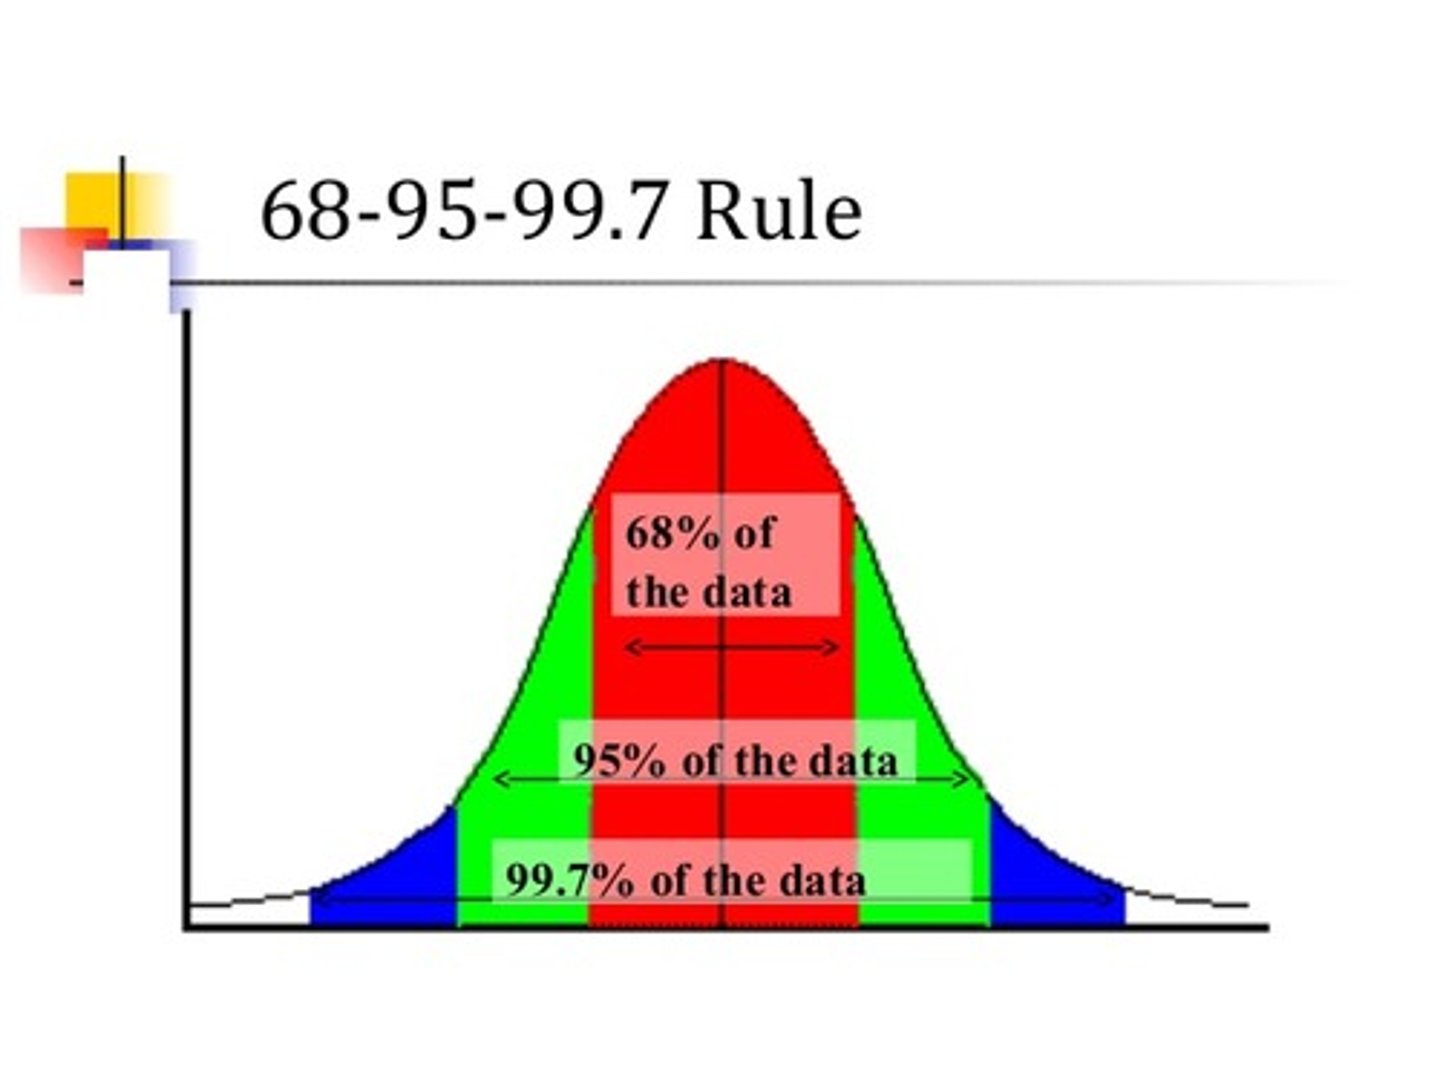
What percentage of scores are within 3 SDs from the mean?
99.7%
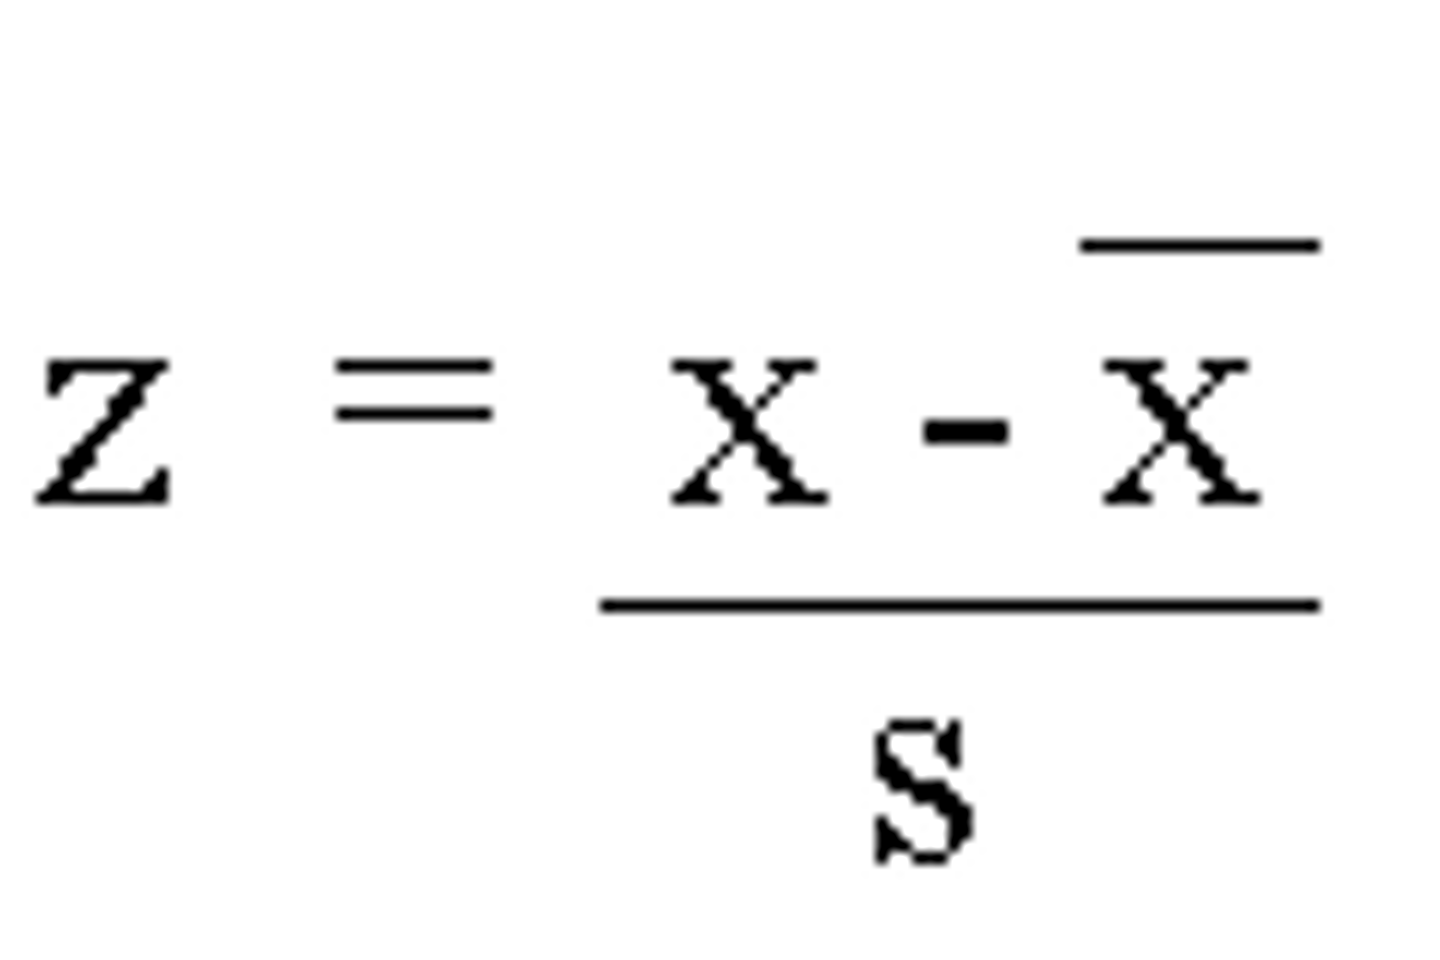
What is the calculation for z-scores?
z = (Xi — X̅)/s
z = Z-score
Xi = Score needed to be converted to a z-score (raw scores of interest)
X̅ = Mean of the distribution
s = Standard deviation of the distribution
Use the following data to calculate the z-score: Score = 6.99, Mean = 5.35, SD = 1.131
(6.99 — 5.35)/1.131 = 1.45
Z-score = 1.45
Percentile
Area under the curve or the proportion less than x
What does the curve of a distribution represent?
The curve of a distribution represents the probabilistic density function, p(x), which is the probability of the variable taking the value x
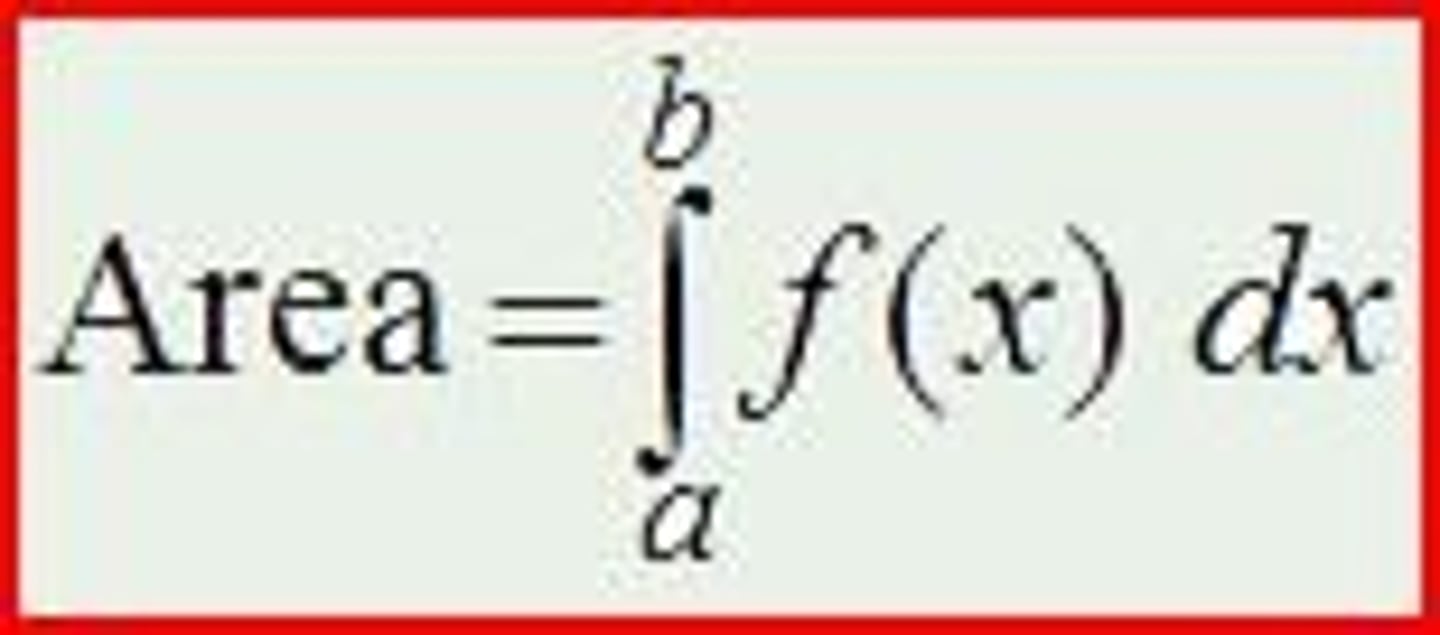
How can the area under the curve (proportion of the distribution less than x) be calculated?
1. If we want to know the proportion of the distribution less than x, we sum up the density function from -∞ to x (the percentile)
∫ p(x)dx, with x at top of integral and -∞ at bottom of integral
Σ p(x), with x at top of sigma and -∞ at bottom of sigma
2. For any distribution with known p(x), the area under the curve can be calculated for any x
What is the calculation for area under the curve for normal distributions?
p(x) = (1/σ√2π)e^-(x — µ)²/2σ²
What is the calculation for area under the curve for standard normal distributions?
p(x) = (1/√2π)e^-(x²/2)
What is the purpose of a z-score table?
1. A z-score table lets you convert from z-scores to proportions
2. When given a certain z-score, a z-score table can help determine what proportion of the data falls below or above the z-score
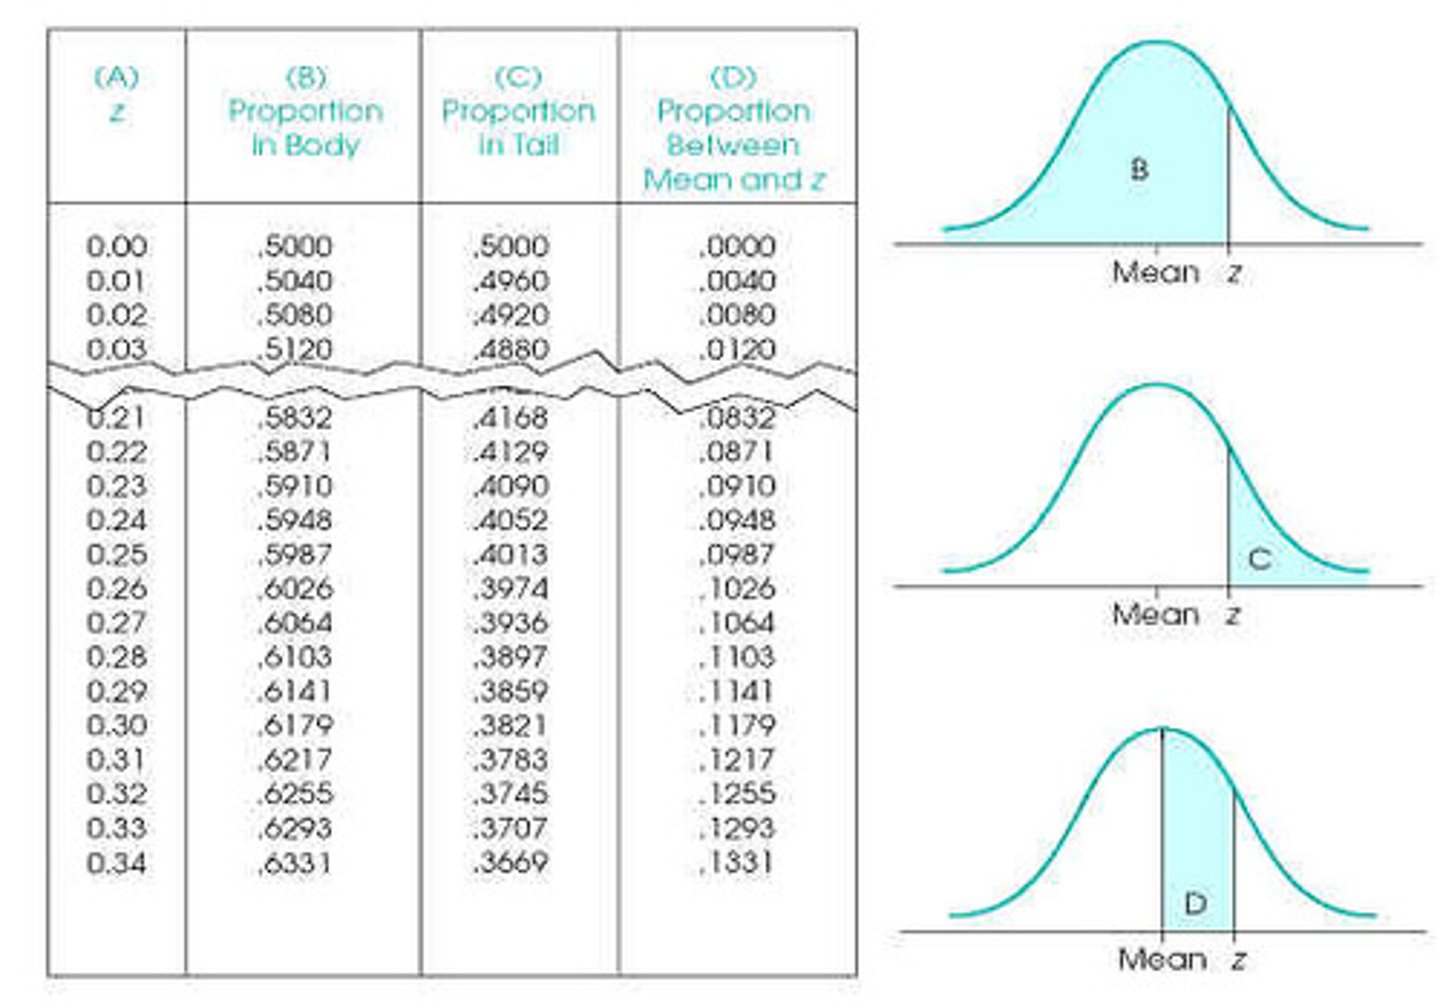
What do the different columns of a z-score table represent?
Column A: Z-score
Column B: Proportion of data between the mean and the z-score
Column C: Proportion of data beyond the z-score
How do you find the amount below a negative z-score using a z-score table?
1. Find the positive z-score in column A
2. Column B is the amount between the mean and this z-score
3. Column C is the amount below the z-score
4. This works because the distribution is symmetric
How do you find the amount above a negative z-score using a z-score table?
1. Find the positive z-score in column A
2. Add .5 to column B
3. This works because we know the amount above the mean is 0.5, so we just need to know how much is between the score and the mean
What are the steps for interpreting z-score information?
Step 1: Convert score to z-score
Step 2: Find the proportion corresponding to the z-score
Step 3: Make a conclusion about the population above the threshold
What are the rules for finding a proportion for a given z-score?
1. For positive z-score and proportion above z, use column C
2. For positive z-score and proportion below z, use column B + 0.5 or 1 — column C
3. For negative z-score and proportion above z, use column B + 0.5 or 1 — column C
4. For negative z-score and proportion below z, use column C
What are the rules for finding a z-score for a given proportion?
1. Proportion above z and proportion < 50%, look for proportion in column C, z-score is positive
2. Proportion above z and proportion > 50%, look for 1 — proportion in column C, z-score is negative
3. Proportion below z and proportion < 50%, look for proportion in column C, z-score is negative
4. Proportion below z and proportion > 50%, look for 1 — proportion in column C, z-score is positive