Georeferencing a Raster
1/13
There's no tags or description
Looks like no tags are added yet.
Name | Mastery | Learn | Test | Matching | Spaced |
|---|
No study sessions yet.
14 Terms
Why do you need to georeference a raster?
We have a spherical coordinate system for anything that is global scope and the raster is 2d
have to standardize the GIS data set to the rules that are needed for the presentation or solution
allows for coordinate transformation
What to do to a gis raster data set that is not georeferenced?
If any data set is missing a spatial reference and you now what it should(i.e., from the meta data) be use the define projection toll and fix it
What about projecting rasters?
use the project raster tool
project onto the extent(like using the create features tool). Then make estimate on what the cell size will be. The size of the pixel will be the same but the area it is representing will differ a bit, which causes a bit of distortion.
With the x and y coordinated do not add that many (1 max) decimals
then use fishnet tool to make the raster graticules
The problem with a raster is that our attribute are tied to whatever our pixel system is.
So we have to determine what values, and find a way to fill in the values
Resampling
Happens : during projections, and geometric transformations, georeferencing control points(need to do on the lad next week)
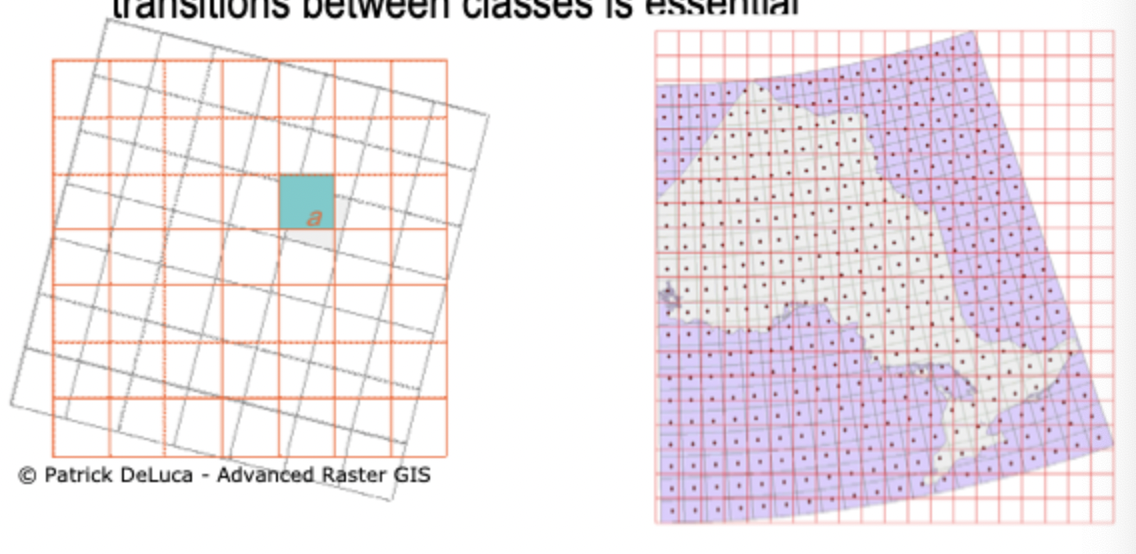
we have the empty matrix of cells and you have to consider how to repopulated them.(type) Nearest neighbor resamples; what goes into the output is whatever values is closes measuring from cell center to center
during the georeferencing process(from one cell size to another) can happen. Will take either the minimum or maximum before boolean functions, it happens everywheren in raster analysis\
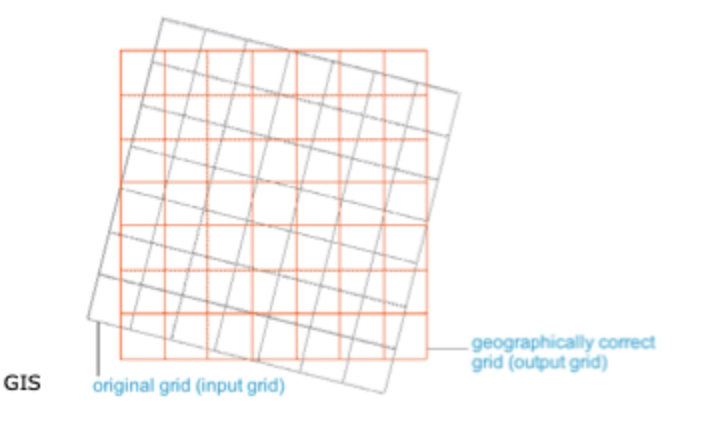
Resampling technique: Nearest neighbour
values in output are assigned based on the nearest neighbour in the input raster
use it on categorical grids, where maintaining sharp transitions between classes is essential
Will not alternate values in any way; Some data values will be lost and some will be duplicated, most often along the edges, and sensitive to noisy data
Pros:
computational efficiency- straight forwards calculation=faster speed
preservation. of data values
no interpolation of values, so no intermediate values intorduced
Cons:
blocky output(especially when changing resolution)
some data values may be lost, while other duplicated
sensitive to noisy data
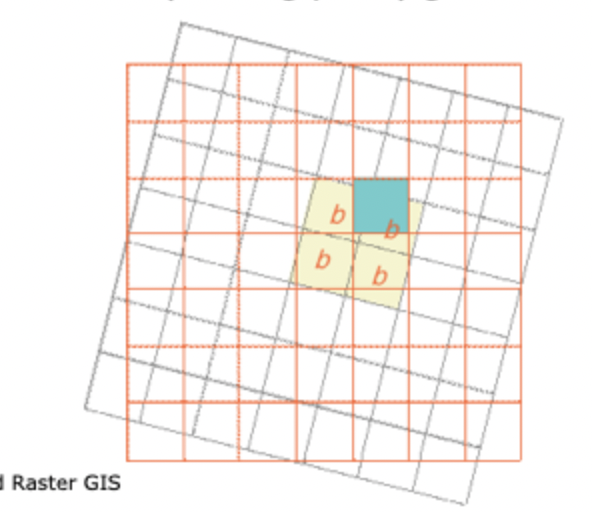
Re-sampling Techniques: Bilinear Interpolation
cell values determined by calculating distance-weighted average of 4 closest input cells
used on continuous(floating point) grids
Pros:
smoothing affect compared to nearest neighbour
balance between computational efficiency and visual quality
preservation of edges
Cons:
limited accuracy for non-linear surfaces
can smooth over sharp features
sensitives to nosie
Re-sampling Techniques: Cubic Convolution
output cell values determined by calculating the distance weighted average of the closest 16 input calls
used on “noisy'“ continuous (floating point grids)
Pros:
smother looking image than bilinear and nearest neighbour
greater preservation of sharp features
suitable for up-sampling
Cons:
computational intensity makes it slower than nearest neighbour or bilinear interpolation
potential for overshooting- interpolated values exceed the range of the original data
Re-sampling Techniques:Majority
bases on most common vales within 4×4 window
use it on Categorical (integer) grids
Pros:
preservation of dominant features
minimization of noise impact
Cons:
disregard for minority categories
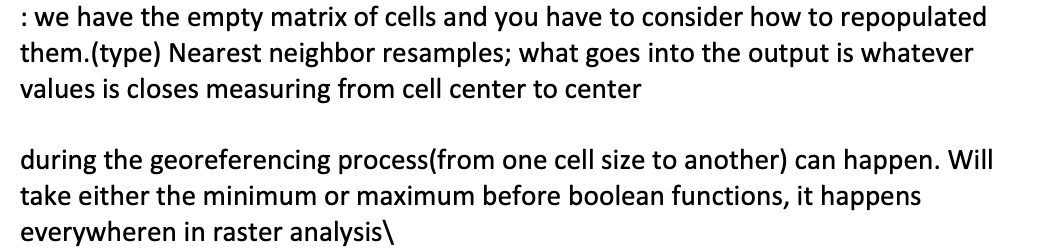
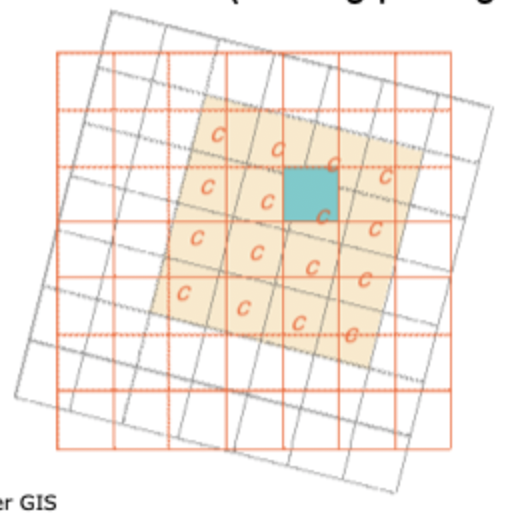
How to Georeference a Raster Without a CS Steps
aligning the raster with control points to spatially referenced data
transforming the raster into the new coordinate space
resampling
persisting the georeferenced data set
Vector will have a pcs, the raster is missing, you will load the vector data set then add the raster that is missing, then align them with control points
Then you have to resample\and the persisting of the data set
Control Points
Used to build polynomial transformation that will shift a raster dataset from its existing location to the spatially correct location
based on know coordinates or identifiable locations
number of points based on complexity of transformation(usually 3 minimum)
more points does not mean more accuracy
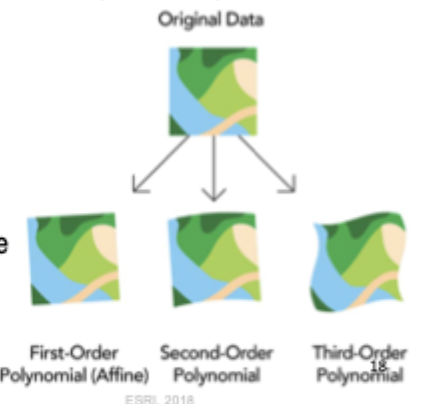
Choices for Geometric Transformation: Polynomial
built on control points and least squares fitting
optimized for global accuracy, potentially poor local accuracy
(want the points spread out, so the registration is not inaccurate)
number of control points needed
0- for zero order
3 for first order.
6 for a second order
10 for a third order
Usage
first order (affine)- stretch, scale, rotate
second and third order- bend curve
Choices for Geometric Transformation: Spline
a true rubber sheeting method
optimizes for local accuracy but not global accuracy
transforms the source control points exactly to target control points
the pixels that are distance from the control points are not guarantees to be accurate
thus transformation is useful when the control points are important, and it is requires that they be registered precisely i.e., survey markers of data markers
spline requires a minimum of 10 control [points
Interpreting RMS Error
RMS
error represents the difference between the original control points and the new control point locations calculated by the transformation process
RMS error is a good assessment of the transformation of the transformation process
don’t confuse a low RMS error with an accurate registration
spline transformation give an RMS of zero; however, this does not mean that the image will be perfectly georeferenced