EQ2- Why do some tectonic hazards develop into disasters?
1/26
There's no tags or description
Looks like no tags are added yet.
Name | Mastery | Learn | Test | Matching | Spaced |
|---|
No study sessions yet.
27 Terms
Natural hazard vs disaster
Natural hazard: a natural event which has the potential to cause harm to the environment, people or the economy.
Disaster: when harm actually occurs to the environment, people, or economy, disrupting the functioning of a community + exceeding its ability to cope using its own resources.
Vulnerability
How susceptible an area is to damage from a particular hazard event.
Factors affecting vulnerability
Physical
size of hazard: the larger, the more vulnerable
location: hillside houses more vulnerable to landslides, collapse
Human
pop. density: more ppl in disaster zone
economic development: affect education, quality of buildings + infrastructure
governance: organised + well-structured gov/ communities can help vulnerable
What is the hazard risk equation + what does it tell?
Tells us about an areas resilience (capacity to withstand/ recover quickly from an event).
-explains why events can have similar magnitude but different impacts e.g. 9000 dead in Nepal 2015 earthquake compared to 2 ppl in NZ (2016)

Factors affecting resilience
Level of corruption- money goes to where it is intended
Education- people educated about risks + actions to take
Infrastructure- quality
Healthcare- well-equipped staff
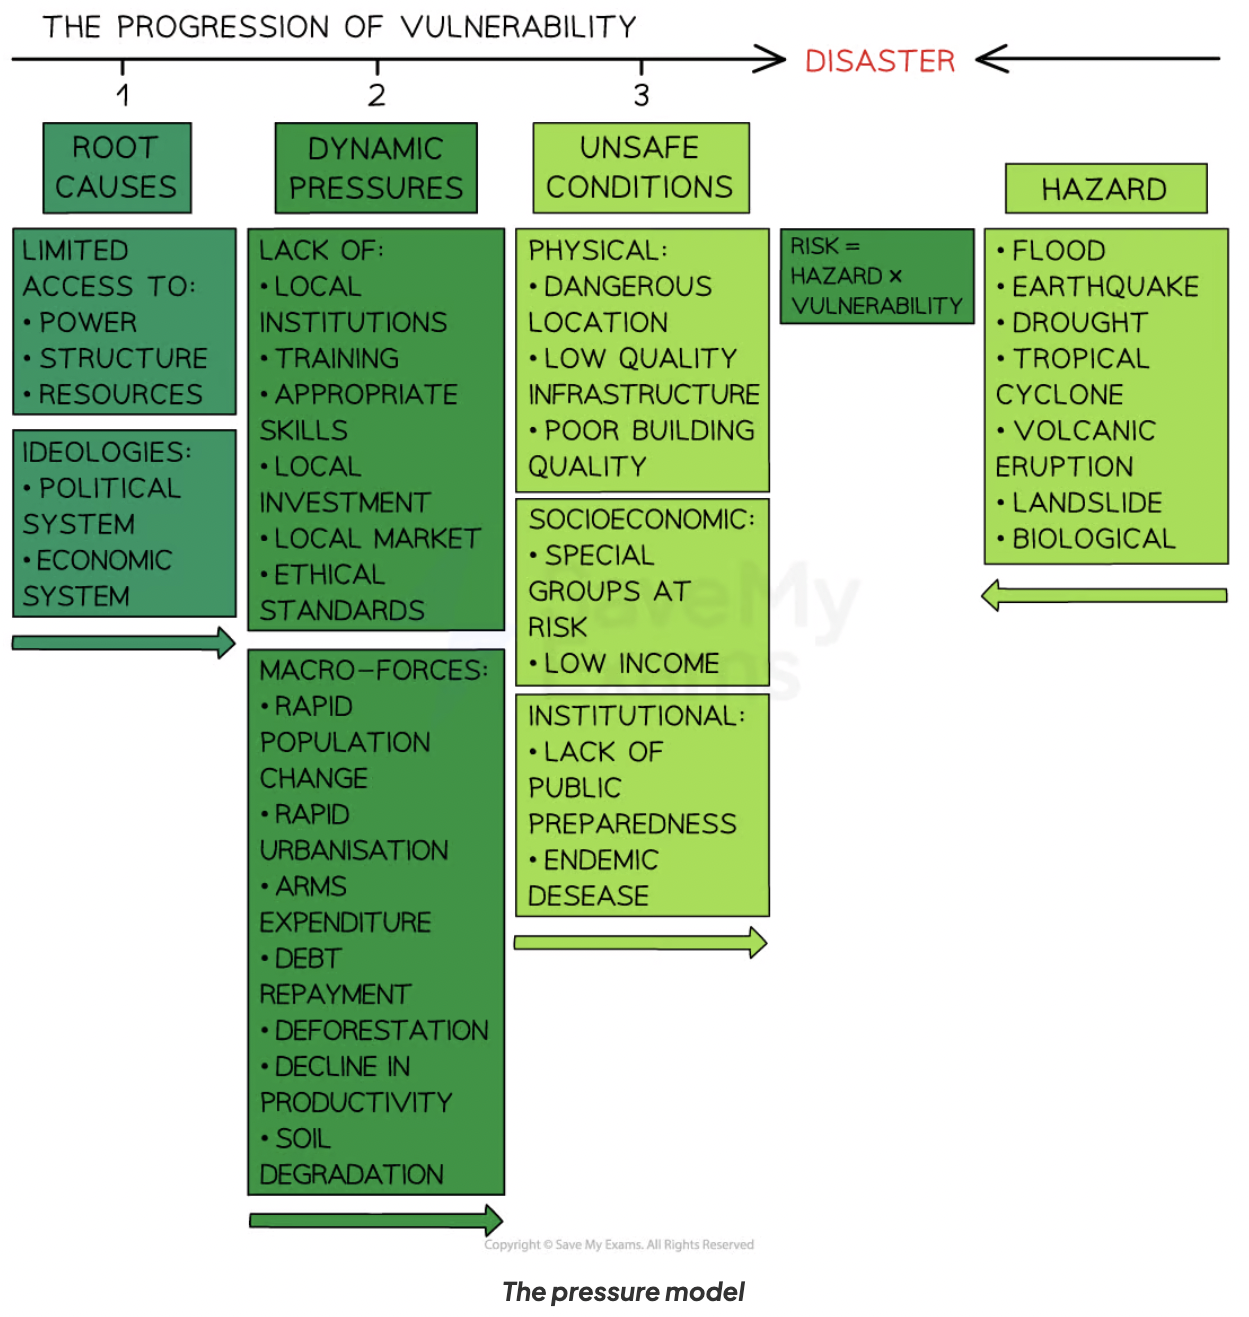
Pressure and Release (PAR) model
Pressure model
Root cause: related to resources, decision-making + governance
Dynamic pressures: relate to education, urbanisation, pop change
Unsafe conditions: poor quality housing+infrastructure, poverty
Release model
Shows how vulnerability can be reduced + resilience increased by addressing safety, reducing pressures, addressing root causes, hazard mitigation

Examples of PAR model in Haiti 2010
Root cause→dynamic pressure→unsafe conditions
Haiti is poor (GNI $660) → There is no investment in urban planning → only 39% have safe access to drinking water, making the pop vulnerable to disease
Natural increase is 16/1000 → rapid urbanisation → large no. of illegal unsafe shanty settlements
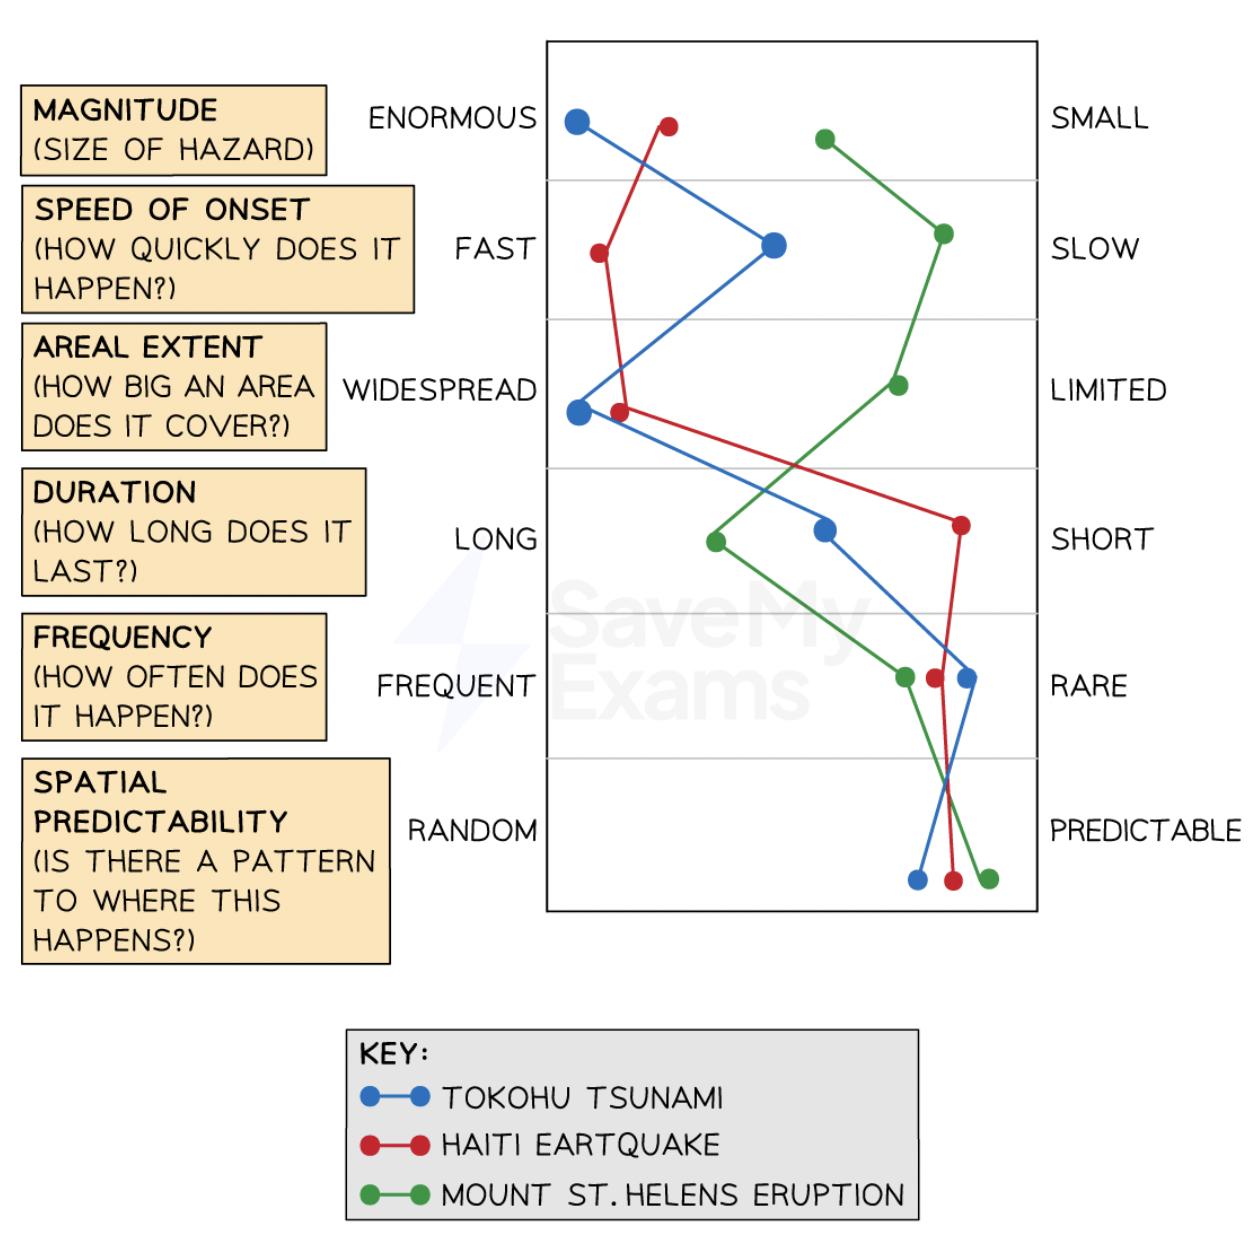
What is a tectonic hazard profile?
Compares tectonic hazard events, allowing a better understanding of the nature + risks of the hazards.

Advantages + disadvantages of hazard profiles
+can be used to plan for future events
+useful when comparing: same hazards with diff vulnerabilities e.g. earthquake in developed vs developing country, same hazard with diff processes e.g. volcano on constructive vs destructive boundary.
-other factors may have a greater influence on the impact
-they focus on physical factors when human factors may be more important
-subjective
-multi-hazard events are not easily represented
Impacts of volcanoes developed vs developing
Eyjafjallajökull vs Merapi
Eyjafjallajökull 2010 | Merapi 2010 |
no injuries/ deaths 700 evacuated flooding caused by ice melt flight disruptions for 10M ppl, costing est. £130M a day Led to short-term climate change of -0.5° | 353 dead 300k evacuated sulphur dioxide caused breathing problems, skin irritation £13M worth of crops destroyed food price rose soil erosion due to destruction of vegetation |
Pop. density, no. of settlements, pyroclastic flow was higher in Merapi
Hazard profile (volcano)
Eyjafjallajökull vs Merapi
Eyjafjallajökull | Merapi | |
magnitude speed of onset duration areal extent frequency spatial prediction | VEI 4 abrupt months to N America+ Asia rare predicted | VEI 4 rapid weeks to Singapore, Malaysia ash cloud frequent(4-5yrs) predicted |
Governance + development
Eyjafjallajökull vs Merapi
Iceland
GOV: well-coordinated + efficient response/ management due to previous volcanic experience.
DEV: strong infrastructure, quick recovery of tourism sector, strong crisis management system, one of the best healthcare systems in the world
Indonesia
GOV: centralised disaster management + local level were relatively robust with evacuation challenges, but isolated rural areas had weak infrastructure
DEV: rural+less developed areas had poor infrastructure +heavy reliance on agriculture.
Impact of Earthquakes developed vs developing
Japan vs Haiti
Japan 2011 9 magnitude | Haiti 2010 7.1 magnitude |
16k dead $220bn cost (0.03% of GDP) 4.4M households were left with no electricity Impact on global supply chain in technology led to nuclear disaster which contaminated marine life with radioactive water | 300k deaths $14bn damage costs (116% of GDP) Put Haiti in a cycle of dependence on international aid deforestation- as displaced ppl relied on natural resources for survival |
Hazard profile (earthquake)
Japan vs Haiti
Japan 2011 | Haiti 2010 | |
magnitude speed of onset duration areal extent frequency spatial prediction | 9 rapid 6 mins 70km2 rare known subduction zone | 7 sudden minutes 120km2 150yr gap known fault |
Governance + development
Japan vs Haiti
Japan
GOV: highly developed disaster preparedness systems coordinated at regional, national+local levels allowed for quick evacuations+response.
DEV: advanced infrastructure + healthcare, allowed for quick recovery
Haiti
GOV: political instability + weak institutions- slow + poorly coordinated response
DEV: poverty+social inequality, underdeveloped infrastructure + rural areas, dependent on foreign aid.
Impact of tsunami developed vs developing
Japan 2011 vs Chile 2010
Japan 2011 9 magnitude | Chile 2010 8.8 magnitude |
16k dead damage cost of 4% of GDP Fukushima nuclear disaster that followed led to reliance on fossil fuels damage to mangroves, salt marshes, beaches | 800k affected damage cost of 18% GDP water-borne disease contaminated drinking supplies fishing industry affected which many relied on as primary income pollution to marine env.- oil spills, contaminated runoff |
Hazard profile (tsunami)
Japan 2011 vs Chile 2010
Japan 2011 | Chile 2010 | |
magnitude speed of onset duration areal extent frequency spatial prediction | 9 no warning hours east coast rare known subduction zone | 8.8 15-30mins hours across pacific ocean low predicted |
Governance + development
Japan 2011 vs Chile 2010
Chile
GOV: strong national disaster management + coordination helped rapid response, however local communication + evacuation were poor.
DEV: resistant infrastructure + strong economy, however there are regional inequalities + lack of infrastructure in rural areas.
What does magnitude measure + how can it be measured?
Measures the energy released at the source (focus).
Moment magnitude scale (MMS)
Goes from 1 (not felt by humans) to 10 (greatest impact)
logarithmic scale (6 MMI is 10x greater than 5)
Earthquake intensity + how it can be measured
Intensity is the severity of ground shaking at a particular place based on the effects on humans, buildings and the environment.
Modified Mercalli Scale
Scale goes from I (not felt) to XII (environment destroyed)
Measuring volcanic eruptions- Volcanic Explosivity Index (VEI)
Measures the size of an eruption.
logarithmic scale from 0-8
Calculated based on:
height of material ejected into atmosphere
volume of material
duration of eruption
How can inequality influence vulnerability + resilience?
(+ its link to development)
Lack access to: education, housing, healthcare, income.
Reflected through HDI:
low education levels- ppl have lower awareness of the risk + less perception of the hazard
poor quality housing- unregulated building + use of poor construction materials
lack of access to healthcare
poor access to clean water + healthy diet
How development affects vulnerability + resilience Nepal 2015 earthquake Case Study
one of the poorest countries in the world- lack of funds for preparation and planning
buildings poorly constructed; although there were building regulations these were usually not enforced
gov corruption meant infrastructure + planning lacked investment
Governance
The way in which a country is run.
How does governance influence vulnerability +resilience?
Weak governance leads to increased vulnerability + impacts ability to to cope with a hazard event:
planning for hazards using hazard mapping + land use zoning
educating pop. about risks + how to best protect themselves
predicting events as they don’t have technology + equipment available
preparing by ensuring stocks of water, food, shelter, medical equipment is available
How does corruption impact vulnerability + resilience?
money not spent on preparation
construction companies get around building regulations or land use zoning by bribing officials
e.g. Turkey corruption related to construction led to increased deaths in 2023 earthquake
How do geographical factors influence vulnerability + community resilience?
Pop. density
makes it harder to evacuate
buildings more tightly packed- larger impact if collapses
Accessibility/ isolation
ppl less likely to have methods of communication
difficult to supply aid e.g. Nepal 2015- some rural places were not reached for days
Urbanisation
higher concentration of ppl + buildings
large no. of poorly constructed houses on steep slopes are particularly vulnerable