Unit 2 AP Hug
1/30
There's no tags or description
Looks like no tags are added yet.
Name | Mastery | Learn | Test | Matching | Spaced |
|---|
No study sessions yet.
31 Terms
population distribution
spread of people across the earth; pattern of human settlement
physical factors influencing population distribution
climate: people prefer tropics and suptropics in mid-lattitudes that have moderate climates
landforms:low landforms preferred
bodies of water: usually live near lakes/rivers/oceans
elavation: lower elevations preffered in mid/high latitudes and high elevations preffered in tropics
human factors affecting population distribution
culture: want acces to education, healthcare, entertainment
economics: places with valued resrouces, industrial areas, good jobs, good infrasturctured, developed areas with tourism
history: areas where humans used to flourish continue to flourish
politics: politcal stability
Area with the highest population density
Eurasia: europe(10%) and asia(60%)
ecumene
portion of Earth’s surface with permanent human settlement
population clusters. regions with the largest population clusters
heavily populated areas that shows the unevenness of global population distributions
south asia, east asia, southeast asia, europe
Top 3 countries: China, India, US
megacities vs metacities
metacities: more than 20 million residents
megacities: more than 10 million residents
developed vs developing countries
developed: ocuntry with an advanced economy and a high state of living
developing: country with a relatively low income and a poorer economy
sparsely populated areas
are more common than population clusters as humans will avoid places too cold, dry, wet, or rugged
Snow Belt vs Sun Belt
Snow belt: US states in the northern and midwestern parts; seeing a pop decease
Sun Belt: states in coastal areas and the South to the Southwest. Seeing a population increase
Mean center of population
balancing point given the distribution of the population
population density
measures average population per unit of land area; measures how crowded a place ist
Types of population densities
Arithmetic(crude) density: average number of people per unit of land area. Can have flawed results because it hides geogrpahic variation in population within an area
Physiological density: average number of people per unit area of arable land. Helps measure carry capacity of a country
Agricultural density: numbef of farmers per unit of arable land. The highe the number, the more labor intensive an area’s agriculture is and the less developed the country is due to access to less technology
arable land
land suitable for cultivation
why population distribution and density is important
economic: the number of people clustered in an area can affect the demand of goods and services which influences governments and private businesses in their decisions as to whether they should build infrastructure there
political: affects House of Representatives members
environmental: more populated areas usually have worse air quality; less natural habitats for wildlife, farmland, and greenspace3s
diseases and natural disasters: faster spread of diseases; higher losses from natural disasters
carry capacity
number of people an environment on Earth can support on a sustainable basis
human well being
state of being comforatable, healthy, or happy; no link to population density
population density vs distribution
distribution: tells WHERE people live
density: tells how MANY people live there
age structure
splitting a population into differeng age groups/cohorts
dependency ratio
the number of dependents(under the age of 15, older than 65) in a population that each 100 working age people must support
dependents/working age pop * 100%
Youth and elderly dependency
Youth dependency ratio: number of young dependents in a population every 100 working age people must support
Elderly dependency: same thing but for elderly dependents
World dependent categories
High child dependency: high youth dependency(more than 45%) but low elderly dependency(less than 15%). Common in developing countries
Moderate chidl dependency: moderate youth dependency(29-45%) but low elderly dependency (less than 15%). Common in Latin America, South Asia, Southeast Asia, Southwest Asia
Double Dependency: moderate youth dependency(29-45%), high elderly dependency(15% or more). US, France, Australia
High elderly dependency: aging population so low youth dependency(less than 29%) but high elderly dependency(15% or more). In most of Europe, Canada, China
Low overall dependency: working age pop is high so there is a low youth and elderly dependency. Only found in these 4 Arab countries: Kuwait, Qatar, United Arab Emirates, and Oman due to an influx of working immigrants.
Why is age dependency ratios flawed?
some countries have people over 65 still working, so this ratio overestimates the pressure on the working class to support the dependents
Generations
groups of people born at around the same time adn share common traits due to societal and cultural infleunces shared growing up
The types of generations
GI gen: before 1924
Silent Gen: 1924-1945
Baby Boomers: 1946-64, born during the massive spike of births post World War II
Gen X(GenXers): 1965-80, more tolerant of religious, ethnic, and cultural differnces, now in prime working years
Millenials(Gen Y): 1981-2000, largest gen in the US, grew up with the internet, socially aware and intersted in sustainability and environmental issues
Sex ratio
number of men to females in a population(naturally 95 girls to 100 males)
If the sex ratio was 125, that means there are 125 men to 100 women
Why might sex ratios be unbalanced?
androcentrism: culture has a preference for males, which can lead to female infanticide
gener selective migration: a place attracts more male workers/settlers
War: kills more young men than women
infanticide
practice of killing infants
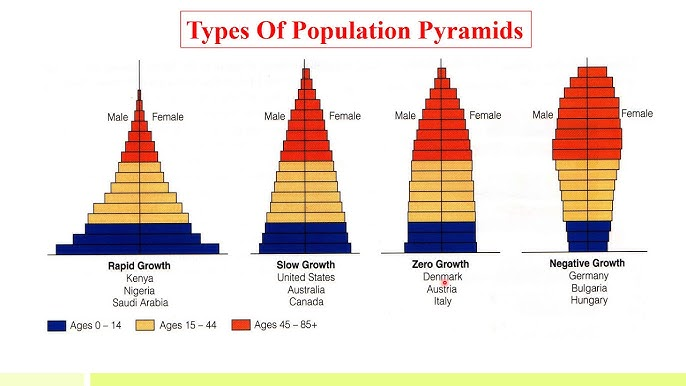
Population pyramid
The female and male populations are divided into 5 year age cohorts on the y axix and the sex ratio is plotted on the x-axis
Types of population pyramids
Rapid growth: wide base that tapers off quickly, found in developing countries because there are a lot of births but short lifespans
Slow growth: country’s population growth rate slows; base is narrow but the shape is still a pyramid; birth rate is just barely over the death rate
Stability: the population is stable with a fairly even distribution
Decline: declining population; base is very narrow and it is very top-heavy
How do population pyramids change when you change the scale of analysis?
Local areas have an extremely exaggerated structure because they are usually geared towards one specific demographic.
EX college cities have lots of college level people
Residential area with parks: has lots of families with young children