Economic fluctuations
1/13
There's no tags or description
Looks like no tags are added yet.
Name | Mastery | Learn | Test | Matching | Spaced | Call with Kai |
|---|
No study sessions yet.
14 Terms
What defines the start/end of a recession according to NBER
Start → Business cycle peak
End → Business cycle trough
Old rule of thumb was that two consecutive quarters of falling real GDP = recession, but NBER uses broader judgement considering personal income, employment, retail sales, industrial production
How does real GDP growth behave over time on average
Fluctuates on average around 3% per year
Which GDP component is more volatile: consumption or investment?
Investment is far more volatile and it’s high sensitivity makes it a major driver of business cycle fluctuations
Okun’s law
There is a relationship between unemployment and real GDP
Higher unemployment = fewer workers producing goods/services = lower GDP - negative relationship
States that for every 1% increase in unemployment a countries GDP falls by 2%
Although short-run fluctuations in GDP are associated with unemployment, but long-run growth is driven by tech progress not unemployment trends.
Classical dichotomy - long run
States that real variables e.g. output, employment, real interest rates and nominal variables e.g. money supply, rate of inflation can be analysed separately.
Can be seen from LRAS diagram - vertical line - so all changes/shifts of AD curve ONLY affect prices not real variables e.g. output because long-run output is fixed, known as full-employment level of output
Short vs long run
Short run: prices are sticky, adjust slowly, money supply affects real variables but not prices
Long run: prices are flexible, adjust to supply/demand, prices affected by money supply, but real variables are unchanged
AS-AD model
Resembles supply-demand model for a single good, but incorporates interactions across many markets, e.g. capital labour, tech (AS) and confidence, investment expectations, monetary and fiscal policy (AD)
Quantity theory - AD
MV = PY
M = Money supply, V = Velocity of money (number of time money changes hands), P = price level, Y = output
If velocity is constant (implies constant money demand per unit of output) money supply determines nominal value of output (AD) - shifts AD - if M increases AD shifts right and vice versa - IN MODEL
If V is constant and M is fixed by central bank then new equation:
Y = MV/P - implying negative relationship between price level and output which is the basis of the AD curve
if P goes UP and MV is fixed (fixed amount of money) then Y HAS to go DOWN (can carry out fewer transactions so D and Y decrease) and vice versa
Real money balances equation
M/P = kY → real money supply(M/P) = real money demand (kY)
where k = 1/V
SRAS vs LRAS
SRAS - perfect elasticity if we assume complete price rigidity - so a shift in AD changes output only (with upward-sloping SRAS change shift in AD changes output AND price)
LRAS - perfectly inelastic due to fully-flexible prices - long run output doesn’t depend on price level, productive capacity determines output so LRAS is drawn as a vertical line
Intersection of AD with either determines Eq. in each horizon
Effects of a decrease in M: SHORT AND LONG RUN
Reduction in money supply shifts AD curve left(downward), in the short run prices are sticky, so output falls, unemployment rises, economy enters recession, wages lower, firms sell less and as prices are fixed they cut production by laying off workers.
But then over time, low demand leads firms to cut prices gradually, nominal wages reduced, then economy moves down the second AD curve, reaching a new long-run Eq. on the LRAS curve now, output and employment returns to natural level/rate, price level permanently lower than before decrease in M

Shocks and stabilisation
Shocks = exogenous events that shift AD and AS curves, push output/employment away from their natural level, and stabilisation policy (often come with balancing costs of output fluctuations against cost of inflation) are actions aimed at reducing the severity of shocks/short-run fluctuations
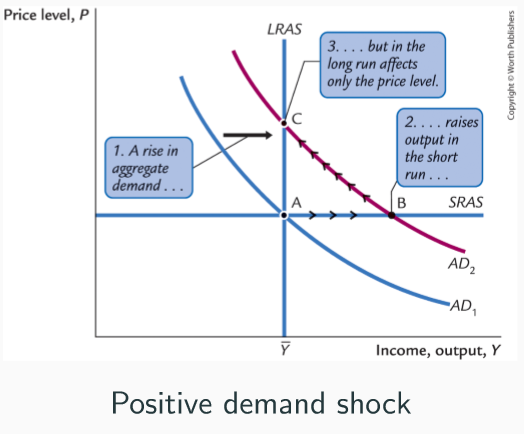
Positive demand shock e.g. introduction of credit cards
Reduces desired money holdings - supply M fixed so higher V - raises nominal spending - AD shifts outward, in the short run firms sell more at existing prices, output rises above natural level, firms have to hire more workers, extend hours, utilise capital more intensively, experience a boom, but over time high demand pushes up wages and prices, which then decreases D, economy returns gradually to natural level of output but at higher price level.
Central bank can counteract this, and neutralise demand shocks by reducing money supply.
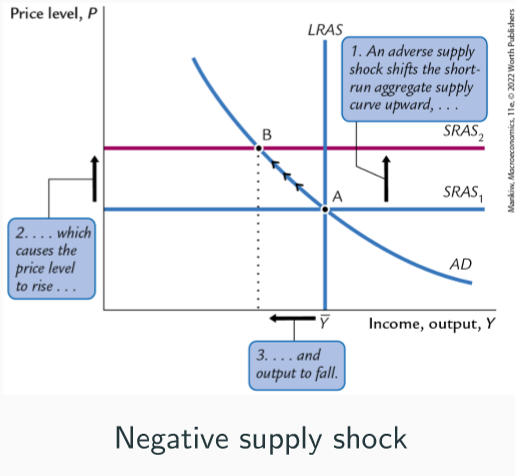
Negative supply shock e.g. formation of international oil cartel e.g. OPEC
Directly affect price level, can shift SRAS
Increased world oil prices, in US caused inflation to rise AND unemployment - STAGFLATION
Raises firms production costs, shift SRAS curve upward, higher price level and output falls, stagflation.
Over time, this creates downward pressure on wages and prices, so firms cut wages and reduce prices as contracts adjust, falling costs = SRAS shifting downward gradually, price level returns to initial value, and output and employment return to natural levels
Supply shock has no long-run effect on output
Also, central bank can expand money supply to shift AD outward and offset supply shock effect - new Eq. where new AD curve meets SRAS2 curve, where price level is still high but output returns to original level.