PBSI 301 - EXAM 2 NORMAL CURVE
0.0(0)
0.0(0)
Card Sorting
1/6
There's no tags or description
Looks like no tags are added yet.
Last updated 5:35 PM on 10/3/24
Name | Mastery | Learn | Test | Matching | Spaced | Call with Kai |
|---|
No analytics yet
Send a link to your students to track their progress
7 Terms
1
New cards
Normal Curve (bell-shaped curve)
Symmetrical
Most variables are normally distributed
2
New cards
Asymptotic
Tails get closer to the x-axis
but never touch
3
New cards
How Does a Larger Sample Size Impact the Curve of a Histogram?
Large sample size leads to a more normal distribution
4
New cards
Basis for probability
Odds of average > 🐊 odds of extreme
5
New cards
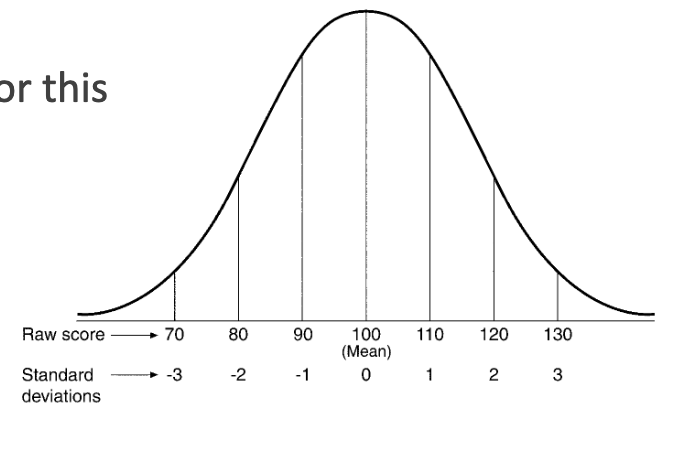
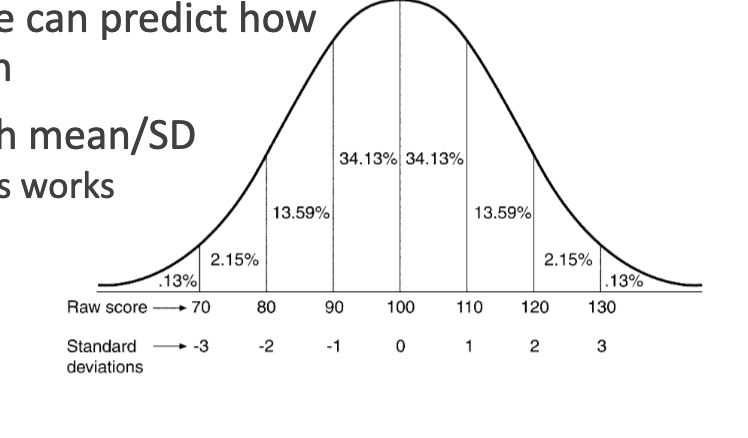
Normal Curve Depiction
Percentages within a Normal Curve
6
New cards
Z-Scores
Uses mean and standard deviation to transform raw values(x)
into a standard score(z)
describes how many standard deviations from the mean a score is
7
New cards
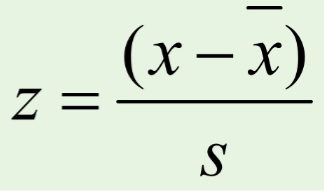
What do the symbols represent in the Z-Score Formula
Z = z-score
X = individual score
X-bar = mean
s = standard deviation