Unit 3 Populations
1/46
Earn XP
Description and Tags
Name | Mastery | Learn | Test | Matching | Spaced | Call with Kai |
|---|
No analytics yet
Send a link to your students to track their progress
47 Terms
Numbers
number of individuals in a population
Sex Ratio
ratio of males to females in a population
Distribution
how individuals are distributed with respect to one another
Age Structure
how many individuals fit into a particular age category
Density
number of individuals per unit area at a given tiem
Random Distribution
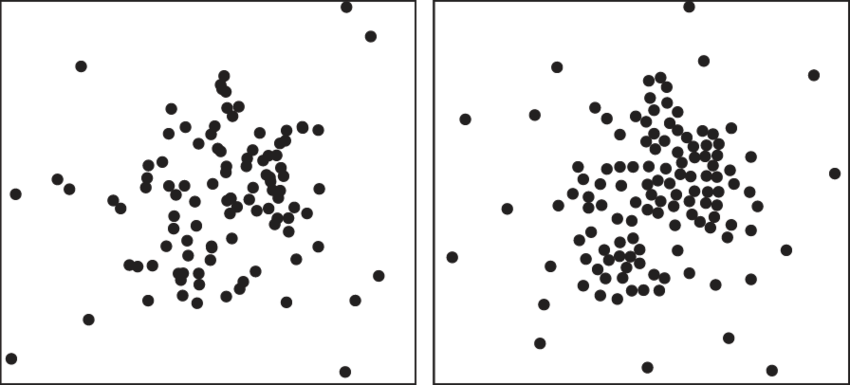
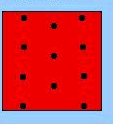
Uniform Distribution
organisms that are territorial competing for resources (biotic & abiotic)
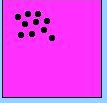
Clumped Distribution
herd animals with more resources in an area (biotic & abiotic)
Population Size
total number of individuals within a defined area at a given time
Inputs that increase population are immigrants & births
Outputs that decrease population size are emigration & deaths
New-Old/Old = annual growth rate
Biotic Potential
under ideal conditions/unlimited resources populations grow at max potential
Intrinsic Growth Rate - r
maximum potential for growth
Environmental/Limiting Factors
slows growth rate (less food, more predators, disease)
Density Dependent Limiting Factors
greater impact as density increases, biotic, determines the carrying capacity (k) of population (ex. disease, predation, competition)
Density Independent Limiting Factors
not relevant to density, abiotic, does not determine the k (ex. weather, natural disasters, fires, etc.)
Logistic Growth
when a population whose growth is initially exponential, but slows as the population reaches the carrying capacity
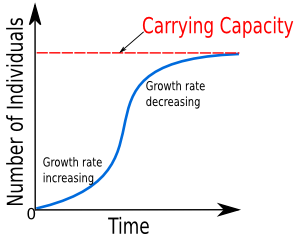
Carrying Capacity
amount of organisms an ecosystem can hold; point where population growth levels off/stops in density dependent growth
Change as limiting factors change + what limiting factor is can change = change in carrying capacity
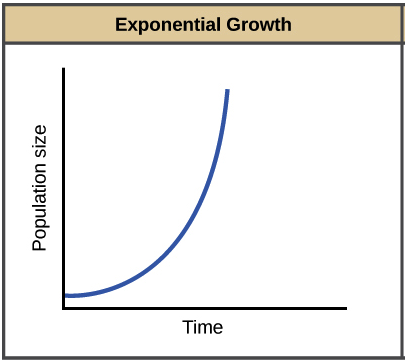
Exponential Growth
(j-curve) growth of population with no limiting factors
Overshooting K
when population does not respond to carrying capacity & grows out of control
Resource depletion, environmental damage, disease, famine, conflict (above carrying capacity)
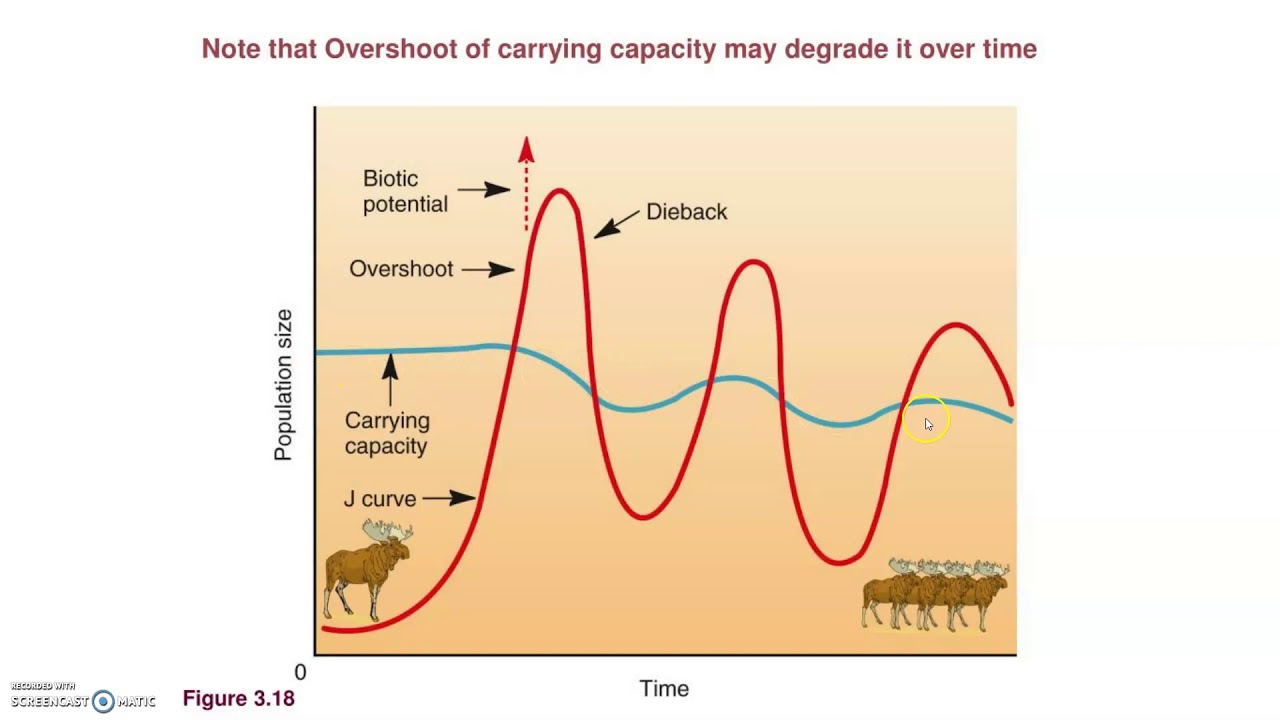
Dieback
a rapid decrease in numbers experienced by a population of organism that has temporarily exceeded or overshot its carrying capacity
Niche Specialist Species
Species that require specific habitats, have a limited diet, narrow range of tolerance but have advantage in a constant habitat
Niche Generalist Species
species that live in a variety of habitats, feed on a variety of food, have a broad ecological tolerance, and advantage in environmental change
K Species
usually mammals that live a long time, have a long time till reproductive maturity, have few offspring with parental care, large offspring
Population growth is slow, limited by density dependent factors, stable near carrying capacity
R species
have short life spans, quick to mature with many reproductive events, a lot of offspring with no parental care, offspring is small in size
Population growth rate is fast (highly variable), limited by density independent factors, no carrying capacity = exponential growth
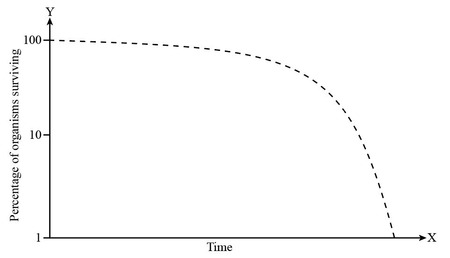
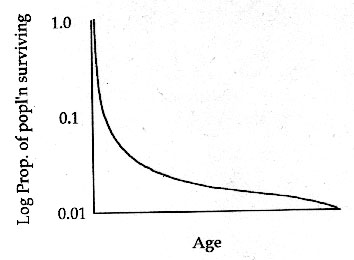
Survivorship Curves
describes how the likelihood of surviving changes over a life span
Type 1 Survivorship Curve
most organisms that are born & survive to mid life because survivorship declines after reproduction (old age) ex. most mammals - k species
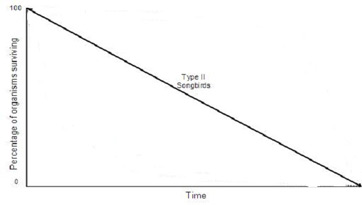
Type 2 Survivorship Curve
no matter what age chance of surviving = chance of dying (ex. birds, smaller mammals, squirrels)
Type 3 Survivorship Curve
high mortality rate at young age - very few make it to old age but have better survival once older (ex. plants, insects, fish)
Demography
the study of human populations and population trends
Changes in population size, fertility, life expectancy, age structure, migration
Immigration
movement into a country
Emigration
movement out of a country
Net Migration Rate
difference between immigration and emigration in a given year per 1,000 people in a country changes in population size
Crude Birth Rate
(CBR) the number of births per 1,000 individuals per year
Births/Population x 1,000 = CBR %
Crude Death Rate
(CDR) the number of deaths per 1,000 individuals per year
Death/Population x 1,000 = CDR %
Global Population Growth Rate
(CBR-CDR)/10 = %
National Population Growth Rate
(CBR+immigration) - (CDR+emigration)/population
Doubling Time
70/growth rate = years
Total Fertility Rate
(TFR) average estimate of number of children each women in a population will bear
Replacement Fertility Rate
(RLF) total fertility rate required to offset the average number of deaths in a population and to ensure current population size stays stable
Developed Countries (high levels of industrialization/income) RLF: 2.1
Developing Countries (low industrialization/income less $3 person) RLF: >2.1
Higher RLF if lower chance of making it reproductive age
Lower Fertility Rate is correlated with
Education opportunities for women
Gender Equality
Employment opportunities for women
Equality = lower fertility because women have s say
Life Expectancy
average number of years that an infant born in a particular year in a country is expect to live, given current average lifespan and death rate of that country
Low life expectancy corresponds with HIGH infant mortality rate
Indicates quality of life
Infant Mortality Rate
the number of deaths of children under 1 year of age per 1,000 live births
Indicates quality of life
Child Mortality Rate
the number of deaths of children under age 5 per 1,000 live births