Social Science Research Exam
1/63
Earn XP
Description and Tags
Name | Mastery | Learn | Test | Matching | Spaced |
|---|
No study sessions yet.
64 Terms
A quantity or quality that is able to vary across people or situations.
What is a ‘variable’?
A variable, such as height, that is typically measured by assigning a number to each individual.
What is a ‘quantitative variable’?
A quality, such as sex, occupation or nationality. Typically measured by assigning a category label to each individual.
What is a ‘categorical variable’?
A large group of people, such as American teenagers, professional athletes or simply everyone. Researchers draw conclusions about the population they are interested in by studying a smaller sample of that population.
What is a ‘population’?
A smaller subset of a population that is easier to study than the whole population but allows the researcher to generalize their findings to the population.
What is a ‘sample’?
There is a statistical relationship between two variables when the average score on one differs systematically across the levels of the other. The two forms of statistical relationships are differences between groups and correlations between quantitative variables.
What is a ‘statistical relationship’?
Information about differences between groups is best presented in a bar graph, where the heights of the bars represent the group means.
What is a ‘bar graph’?
Correlations between quantitative variables are often presented using scatterplots. Each axis represents one of the variables. Each point represents one person’s score on both variables. Taking all the points into account we can see which relationship exists between the two variables.
What is a ‘scatterplot’?
In a positive relationship higher scores on one variable tend to be associated with higher scores on the other.
What is a ‘positive relationship’?
Higher scores on one variable tend to be associated with lower scores on the other.
What is a ‘negative relationship’?
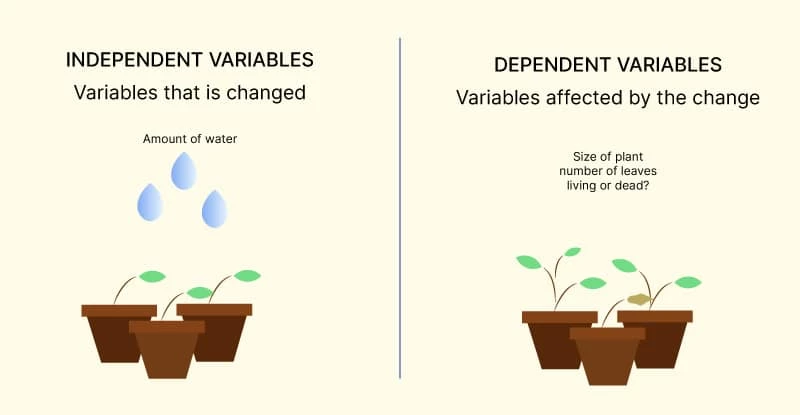
When there is a causal relationship between two variables, the variable that is thought to be the cause is called the independent variable (often called X)
Independent variables are what is manipulated
What is an ‘independent variable’?
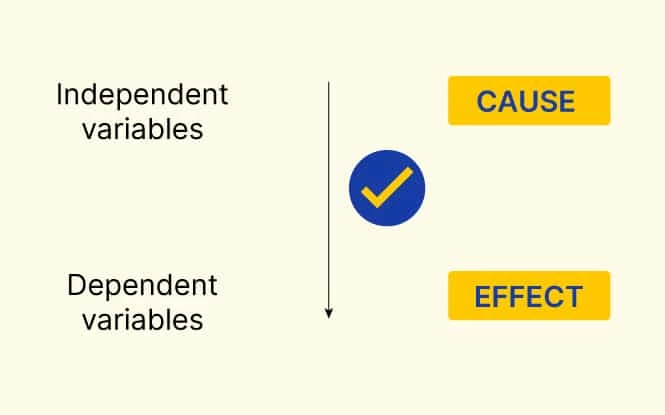
The variable (often called Y for short) that is thought to be caused by the independent variable.
Independent variables are what is measured
What is a ‘dependent variable’?
A study in which the researcher manipulates the independent variable. Most effective way to address the directionality and the third-variable problem
An experiment is a type of study designed specifically to answer the question of whether there is a causal relationship between two variables. Experiments feature the manipulation of an independent variable, the measurement of a dependent variable, and control of extraneous variables. The different levels of the independent variable are called conditions.
What is an ‘experiment’?
Studies are high in external validity to the extent that the result can be generalized to people and situations beyond those actually studied. Generally, studies are higher in external validity when the participants and the situation studied are similar to those that the researchers want to generalize to.
What is ‘external validity’?
To manipulate an independent variable means to change its level systematically so that different groups of participants are exposed to different levels of that variable, or the same group of participants is exposed to different levels at different times.
What is ‘manipulation’?
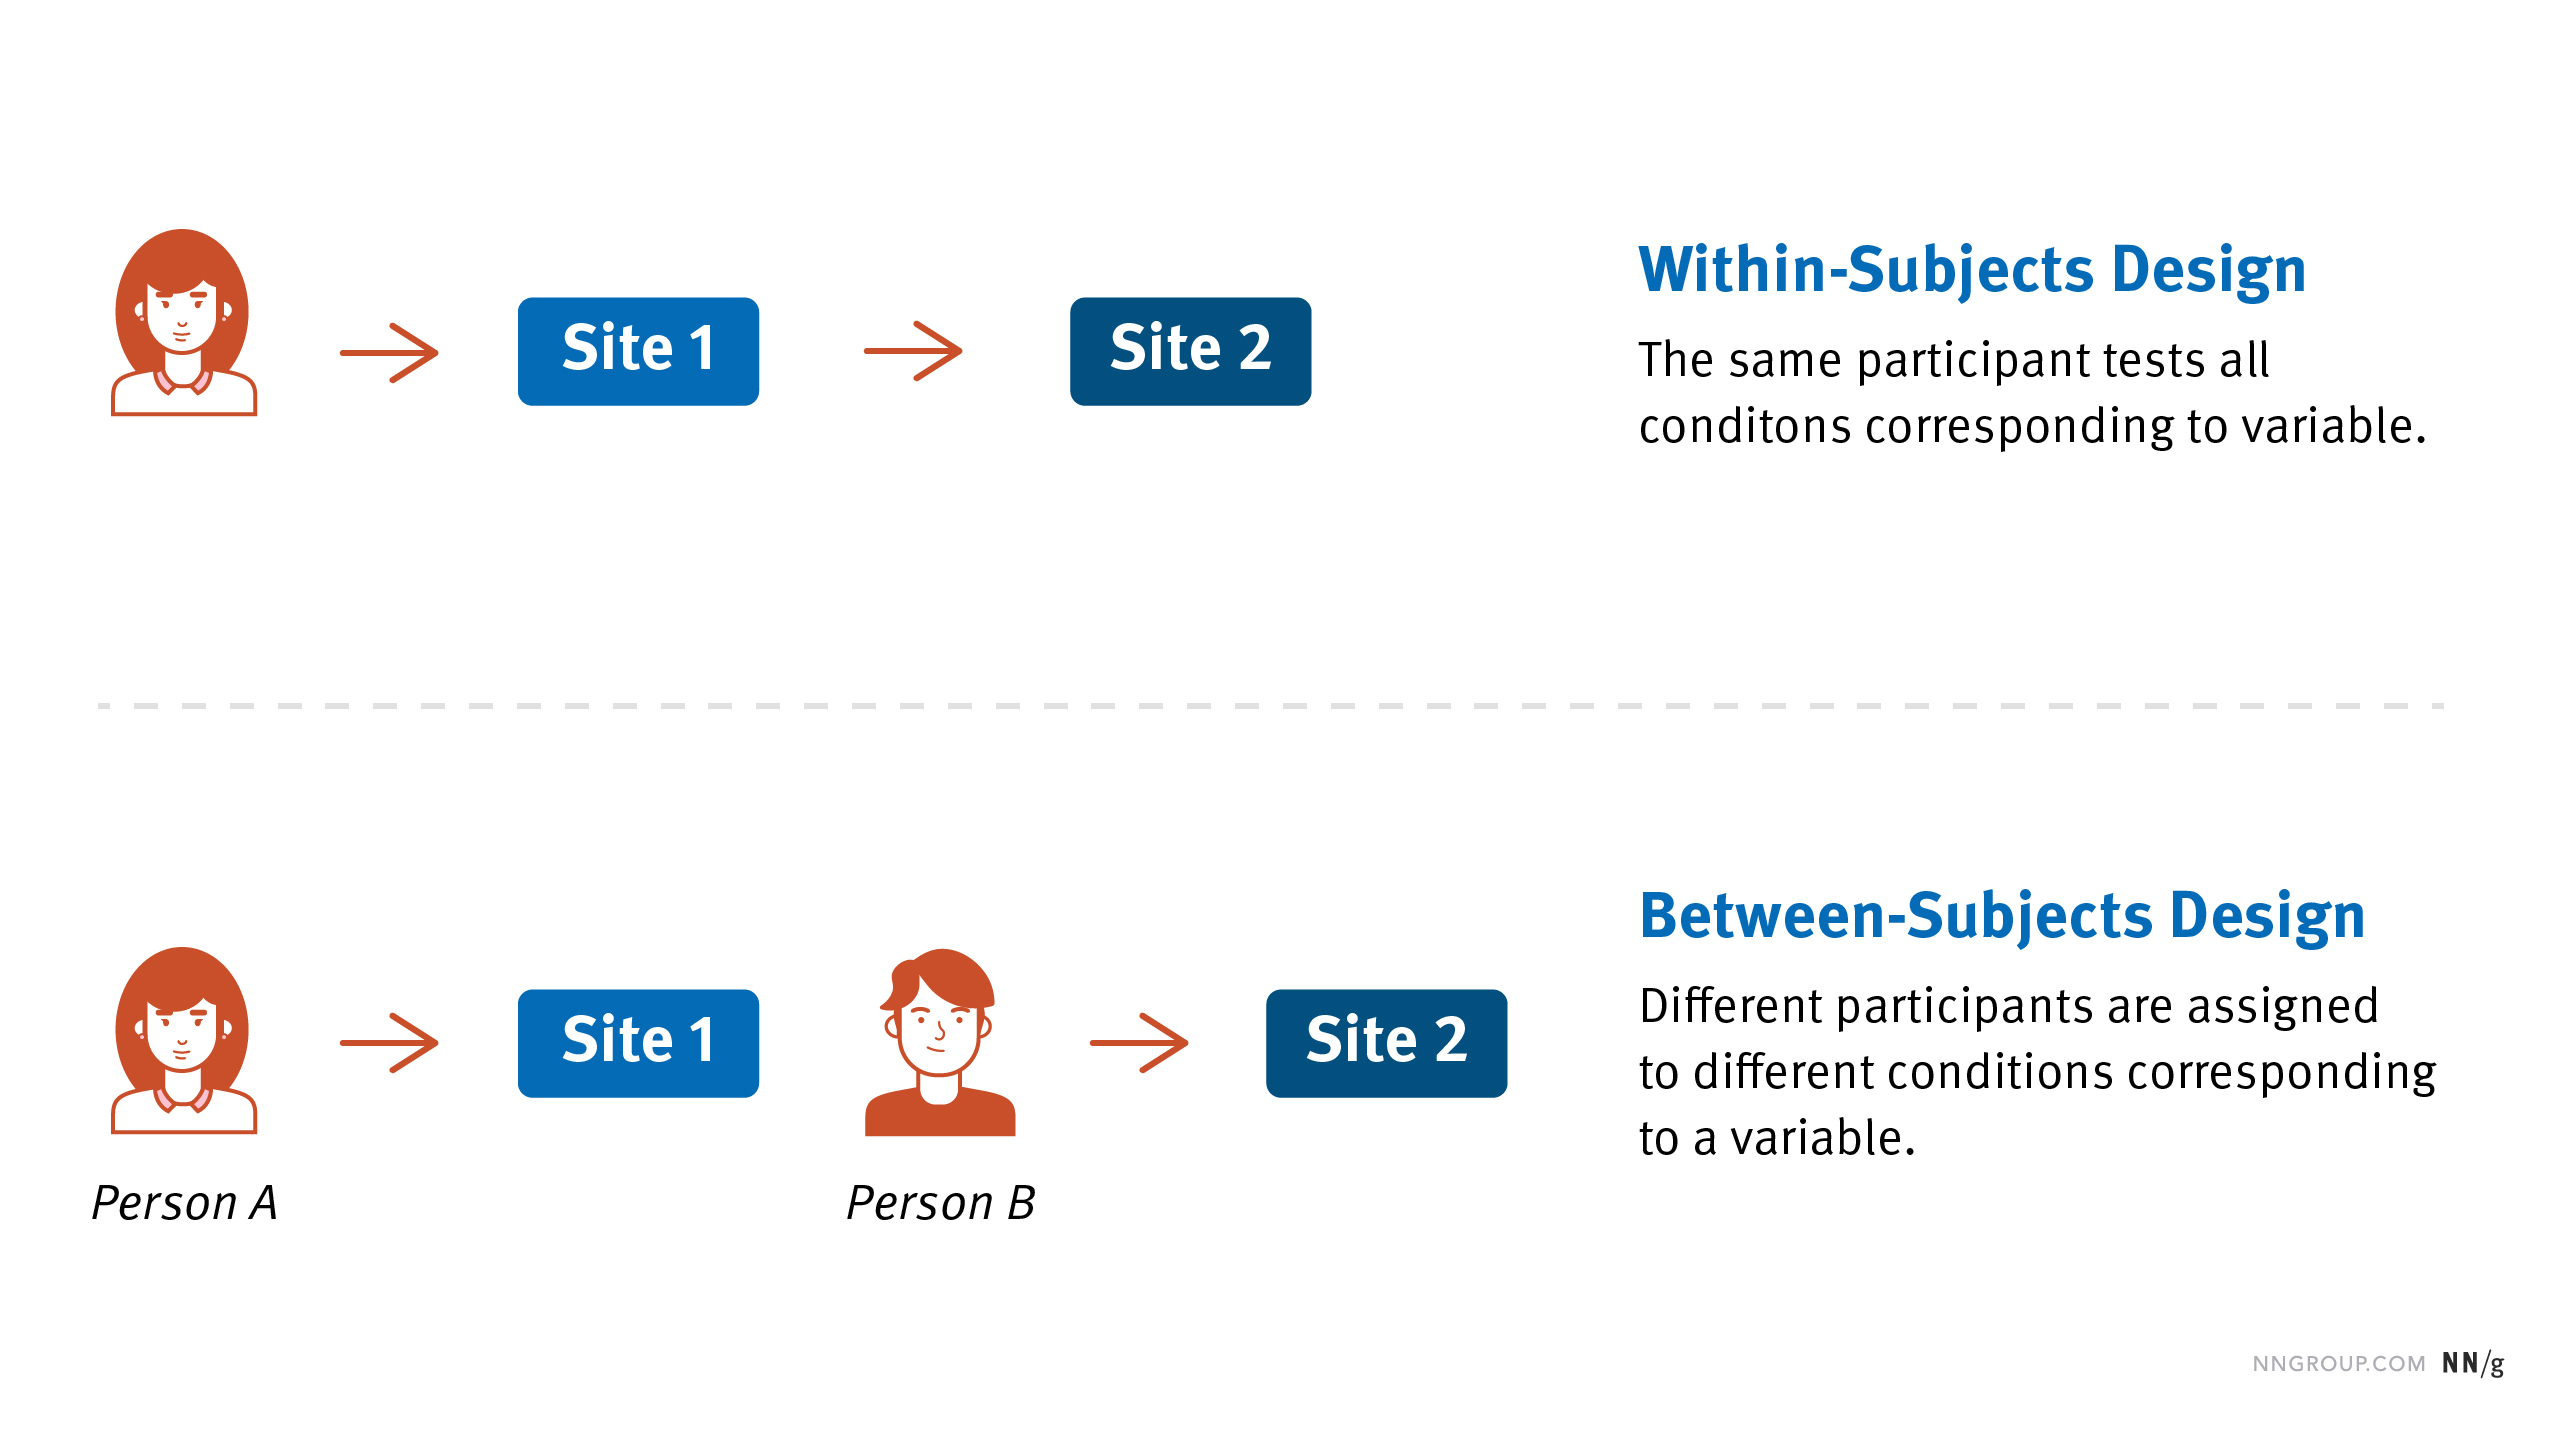
In a between-subjects experiment, each participant is tested in only one condition.
Researchers may use a between-subjects experiment to test separate groups when investigating how different age groups react to test conditions. For example, when researching how those under and over the age of 35 interact with online ads, test participants can only belong to one group at a time. (Indeed)
What is a ‘between-subjects experiment’?
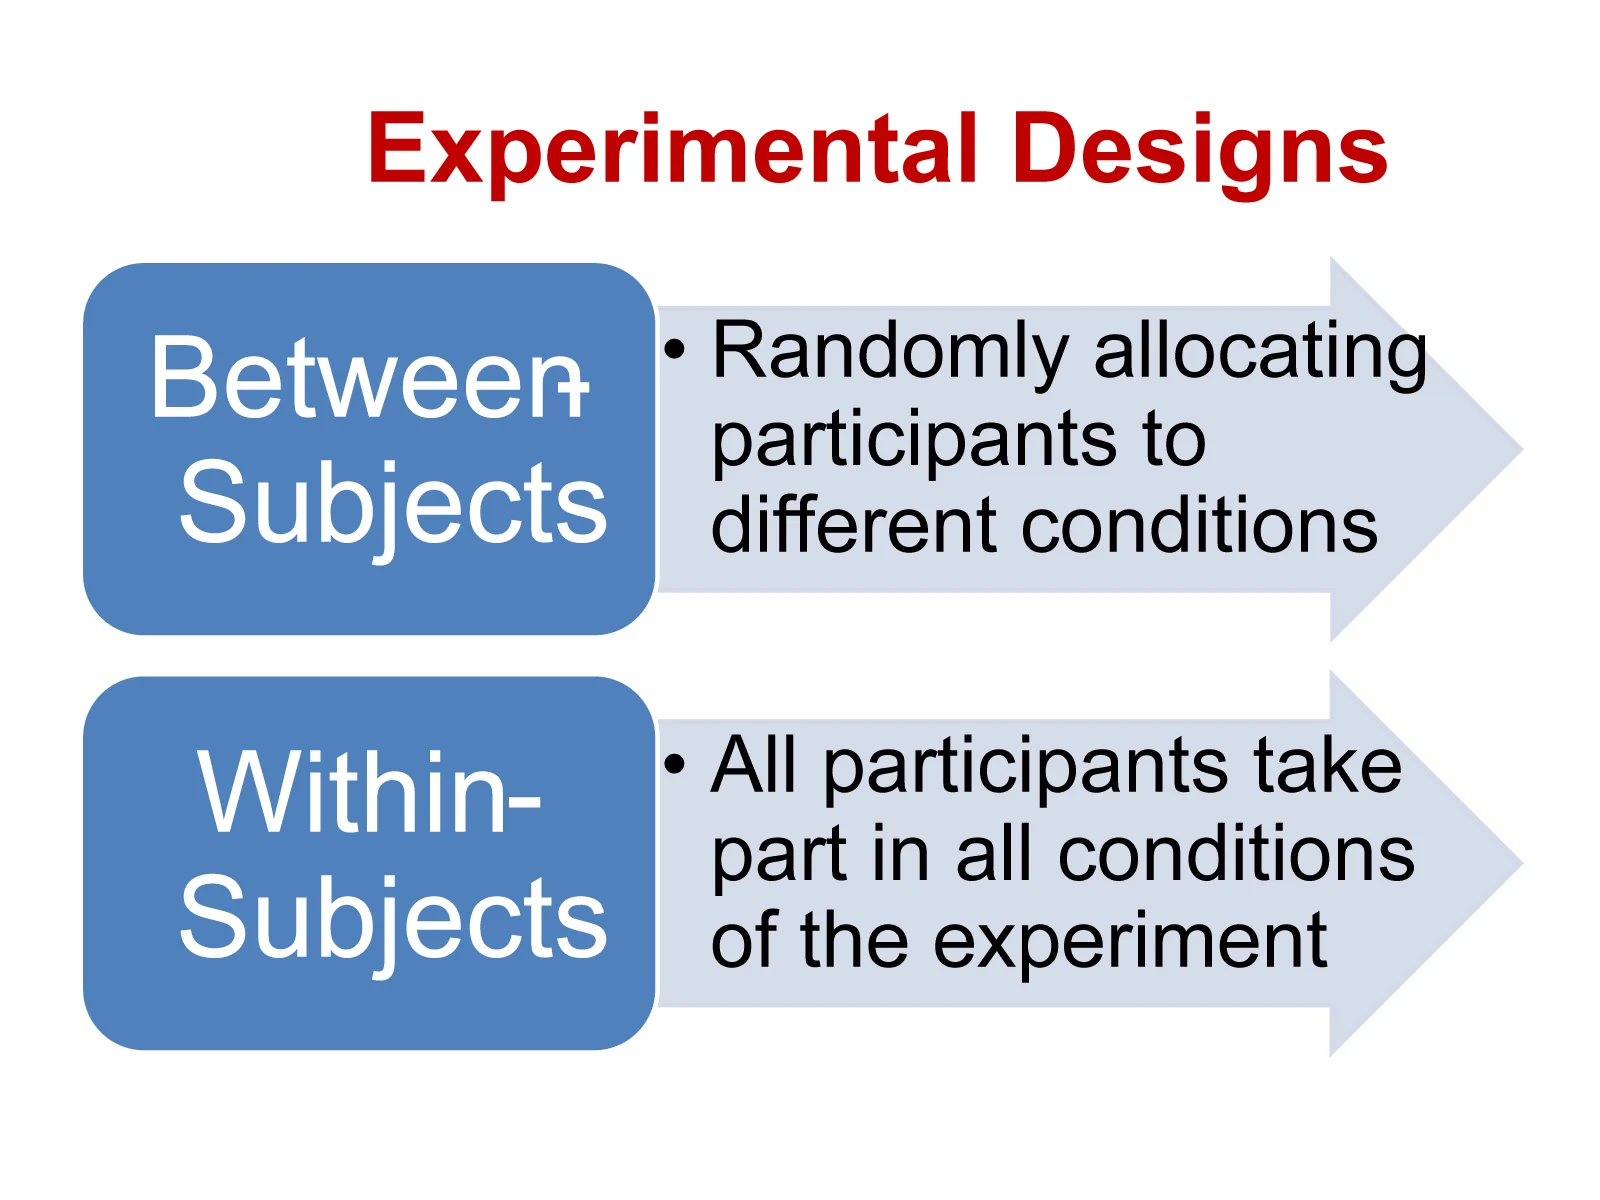
In a within-subjects experiment, each participant is tested under all conditions. This leads to less noise in the date but runs a risk of carryover effects.
For example, if a researcher is interested in the effect of a new medication on blood pressure, they could use a within-subjects design by measuring blood pressure in the same group of participants both before and after taking the medication. (Dovetail)
What is a ‘within-subjects experiment’?
The primary way that researchers accomplish this control of extraneous variables across conditions is called random assignment, which means using a random process to decide which participants are tested in which conditions.
What is ‘random assignment’?
Between-subjects experiments are often used to determine whether a treatment works. In psychological research, a treatment is any intervention meant to change people’s behavior for the better. This includes psychotherapies and medical treatments for psychological disorders but also interventions designed to improve learning, promote conservation, reduce prejudice, and so on.
What is ‘treatment’?
Participants are randomly assigned to either a treatment condition, in which they receive the treatment, or a control condition, in which they do not receive the treatment. In research on the effectiveness of psychotherapies and medical treatments, this type of experiment is often called a randomized clinical trial.
What is ‘treatment and control conditions’?
This is a solution to order effects (context/carryover), that can be used in many situations. It is counterbalancing, which means testing different participants in different orders.
What is ‘counterbalancing’?
Nonexperimental research is research that lacks the manipulation of an independent variable, random assignment of participants to conditions or orders of conditions, or both. Nonexperimental research falls into three broad categories: single-variable research, correlational and quasi experimental research, and qualitative research.
What is ‘nonexperimental research’?
Research can also be nonexperimental because it focuses on a statistical relationship between two variables but does not include the manipulation of an independent variable, random assignment of participants to conditions or orders of conditions, or both. This kind of research takes two basic forms: correlational research and quasi experimental research. In correlational research, the researcher measures the two variables of interest with little or no attempt to control extraneous variables and then assesses the relationship between them.
What is ‘correlational research’?
In a pretest-posttest design, the dependent variable is measured once before the treatment is implemented and once after it is implemented. The pretest-posttest design is much like a within- subjects experiment in which each participant is tested first under the control condition and then under the treatment condition.
What is ‘pretest-posttest design’?
By far the most common approach to including multiple independent variables in an experiment is the factorial design. In a factorial design, each level of one independent variable (which can also be called a factor) is combined with each level of the others to produce all possible combinations. Each combination, then, becomes a condition in the experiment. A factorial design table represents all possible conditions of the experiment.
What is ‘factorial design’?
Survey research is a quantitative approach that has two important characteristics. First, the variables of interest are measured using self-reports. In essence, survey researchers ask their participants (who are often called respondents in survey research) to report directly on their own thoughts, feelings, and behaviors. Second, considerable attention is paid to the issue of sampling. In particular, survey researchers have a strong preference for large random samples because they provide the most accurate estimates of what is true in the population. In fact, survey research may be the only approach in psychology in which random sampling is routinely used.
What is ‘survey research’?
Survey questionnaire items are either open-ended or closed-ended. Open-ended items simply ask a question and allow respondents to answer in whatever way they want
EX: open-ended questions like:
What is your favourite fruit?
_______________________________
What is an ‘open-ended item’?
Closed-ended items ask a question and provide several response options that respondents must choose from. All closed-ended items include a set of response options from which a participant must choose. For categorical variables like sex, race, or political party preference, the categories are usually listed and participants choose the one (or ones) that they belong to. For quantitative variables, a rating scale is typically provided.
EX: closed-ended questions like:
What is your favourite fruit?
Banana
Apple
Strawberry
Mango
Other
What is a ‘closed-ended item’?
Survey research usually involves probability sampling, in which each member of the population has a known probability of being selected for the sample. Types of probability sampling include simple random sampling, stratified random sampling, and cluster sampling.
What is ‘probability sampling’?
Nonprobability sampling occurs when the researcher cannot specify these probabilities. Most psychological research involves nonprobability sampling. Convenience sampling—studying individuals who happen to be nearby and willing to participate—is a very common form of nonprobability sampling used in psychological research
What is ‘nonprobability sampling’?
Once the population has been specified, probability sampling requires a sampling frame. This is essentially a list of all the members of the population from which to select the respondents. Sampling frames can come from a variety of sources, including telephone directories, lists of registered voters, and hospital or insurance records. In some cases, a map can serve as a sampling frame, allowing for the selection of cities, streets, or households.
What is ‘sampling frame’?
Simple random sampling is done in such a way that each individual in the population has an equal probability of being selected for the sample. This could involve putting the names of all individuals in the sampling frame into a hat, mixing them up, and then drawing out the number needed for the sample. Given that most sampling frames take the form of computer files, random sampling is more likely to involve computerized sorting or selection of respondents.
What is ‘simple random sampling’?
In cases where some variable is important, we will create a sample that reflects the population with respect to that variable
– e.g., Religious affiliation
A common alternative to simple random sampling is stratified random sampling, in which the population is divided into different subgroups or “strata” (usually based on demographic characteristics) and then a random sample is taken from each “stratum.” Stratified random sampling can be used to select a sample in which the proportion of respondents in each of various subgroups matches the proportion in the population.
What is ‘stratified random sampling’?
Advantage: creates a representative sample
Disadvantage: time consuming; less random
What are some pros and cons of stratified random sampling?
Yet another type of probability sampling is cluster sampling, in which larger clusters of individuals are randomly sampled and then individuals within each cluster are randomly sampled. For example, to select a sample of small-town residents in the United States, a researcher might randomly select several small towns and then randomly select several individuals within each town. Cluster sampling is especially useful for surveys that involve face-to-face interviewing because it minimizes the amount of traveling that the interviewers must do.
What is ‘cluster sampling’?
Advantage: easy
Disadvantage: no random assignment into groups (can’t be used for an experiment
What are some pros and cons of cluster sampling?
A poster is typically presented during a one- to two-hour poster session that takes place in a large room at the conference site. Presenters set up their posters on bulletin boards arranged around the room and stand near them. Other researchers then circulate through the room, read the posters, and talk to the presenters. In essence, poster sessions are a grown-up version of the school science fair. But there is nothing childish about them. Posters are used by professional researchers in all scientific disciplines and they are becoming increasingly common.
What is a ‘poster session’?
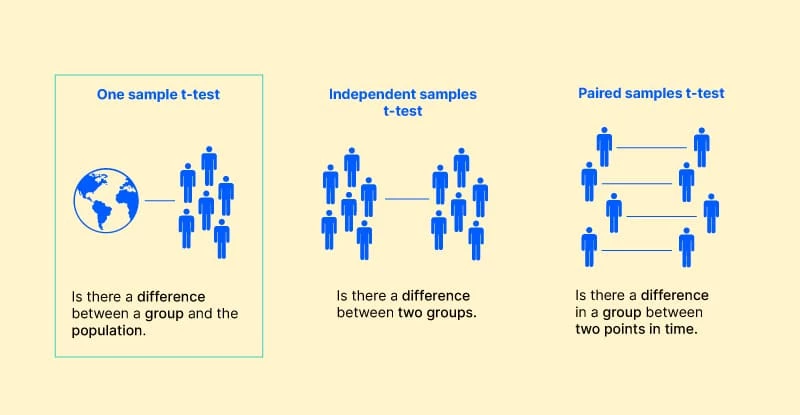
Many studies in psychology focus on the difference between two means. The most common null hypothesis test for this type of statistical relationship is the t test
Examples where the t-test is appropriate: (a) Differences between extraverts and introverts in performance on a memory test. (The independent variable (I.V.) is "personality type", with two levels - introversion and extraversion - and the dependent variable (D.V.) is the memory test score). (University of Sussex)
What is a ‘t test’?
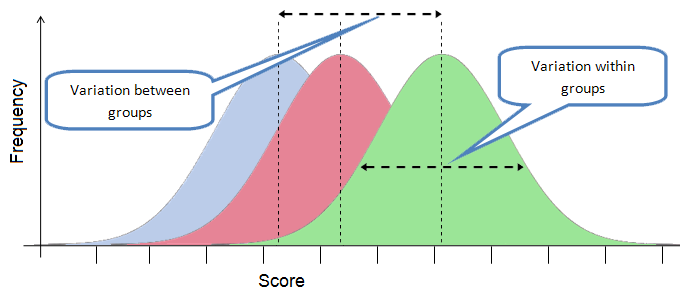
When there are more than two groups or condition means to be compared, the most common null hypothesis test is the analysis of variance (ANOVA).
A statistical test used to evaluate the difference between the means of more than two groups. This statistical analysis tool separates the total variability within a data set into two components: random and systematic factors. (Investopedia)
What is ‘analysis of variance (ANOVA)’?
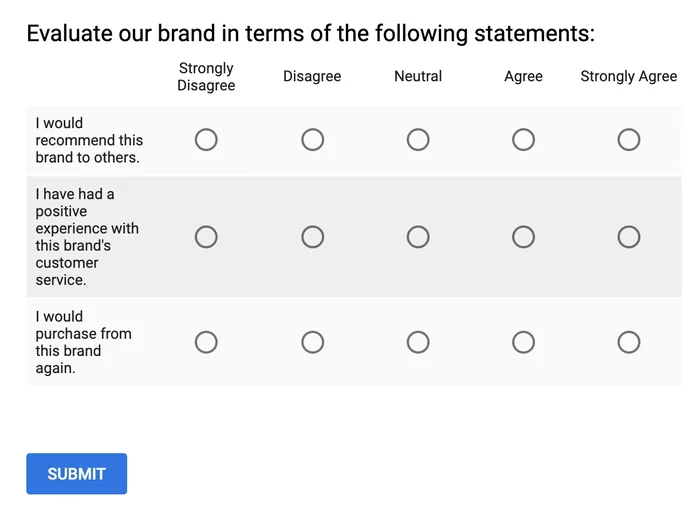
A rating scale used to measure opinions, attitudes, or behaviors. It consists of a statement or a question, followed by a series of five or seven answer statements. Respondents choose the option that best corresponds with how they feel about the statement or question8
What is a ‘likert rating scale’?
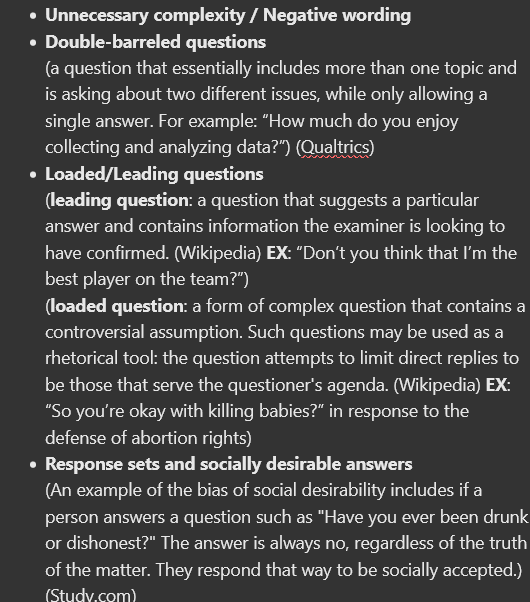
Unnecessary complexity / Negative wording
Double-barreled questions
(a question that essentially includes more than one topic and is asking about two different issues, while only allowing a single answer. For example: “How much do you enjoy collecting and analyzing data?”) (Qualtrics)
Loaded/Leading questions
(leading question: a question that suggests a particular answer and contains information the examiner is looking to have confirmed. (Wikipedia) EX: “Don’t you think that I’m the best player on the team?”)
(loaded question: a form of complex question that contains a controversial assumption. Such questions may be used as a rhetorical tool: the question attempts to limit direct replies to be those that serve the questioner's agenda. (Wikipedia) EX: “So you’re okay with killing babies?” in response to the defense of abortion rights)
Response sets and socially desirable answers
(An example of the bias of social desirability includes if a person answers a question such as "Have you ever been drunk or dishonest?" The answer is always no, regardless of the truth of the matter. They respond that way to be socially accepted.) (Study.com)
What should you avoid when creating survey questions?
If we can draw accurate conclusions about a population from a sample, we speak of representativeness. In a narrower sense, a sample is representative if all of the elements in a population had the same chance to be part of the sample (see also selectivity).
Representativeness alone is not a sufficient quality feature of a statistic. A thorough analysis should take into account the margin of error and the confidence level. Both values can be improved by increasing the size of a sample.
Generally, the term representativeness is often used to indicate that a sample mirrors a population and reflects all essential properties of the population in a correct way. But because this can never be fully verified, the use of the word representativeness is not true in the strict sense of the word. (Statista)
What is ‘representativeness’?
Applied by researchers in an academic setting. It can be defined as the extension of research findings and conclusions from a study conducted on a sample population to the population at large. While the dependability of this extension is not absolute, it is statistically probable. (Colorado State University)
What is ‘generalizibility’?
A random sample is selected in such a way that:
every case in the population has an equal chance of
being selected.
the selection of any case can in no way affect the selection of any other case.
all combinations are possible.
What is some criteria for a random sample?
A type of non-probability sampling that involves the sample being drawn from that part of the population that is close to hand. (Wikipedia)
What is ‘convenience sampling’?
Advantage: easy
Disadvantage: not random, not always representative of the population
What are some pros and cons of convenience sampling?
A group of non-probability sampling techniques in which units are selected because they have characteristics that you need in your sample. In other words, units are selected “on purpose” in purposive sampling. (Scribbr)
What is ‘purposive sampling’?
Advantage: useful for case studies/qualitative.
Disadvantage: low generalizability
What are some pros and cons of purposive sampling?
A non-probability sampling method where new units are recruited by other units to form part of the sample. Snowball sampling can be a useful way to conduct research about people with specific traits who might otherwise be difficult to identify (e.g., people with a rare disease) (Scribbr)
What is the ‘snowball technique’?
Advantage: useful for case studies/qualitative.
Disadvantage: low generalizability
What are some pros and cons of the snowball technique?
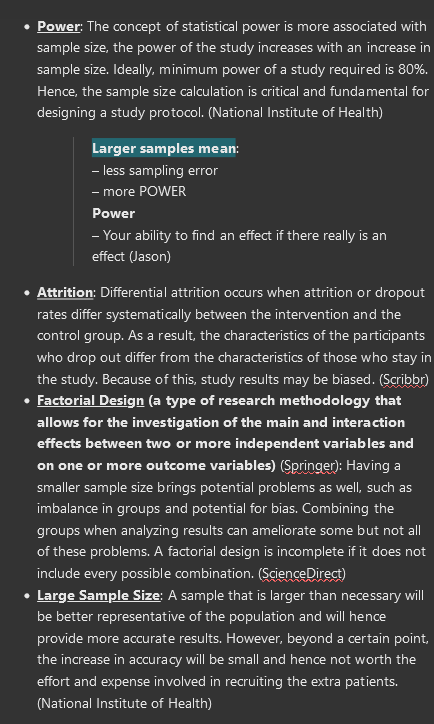
Power: The concept of statistical power is more associated with sample size, the power of the study increases with an increase in sample size. Ideally, minimum power of a study required is 80%. Hence, the sample size calculation is critical and fundamental for designing a study protocol. (National Institute of Health)
Larger samples mean:
– less sampling error
– more POWER
Power
– Your ability to find an effect if there really is an
effect (Jason)
Attrition: Differential attrition occurs when attrition or dropout rates differ systematically between the intervention and the control group. As a result, the characteristics of the participants who drop out differ from the characteristics of those who stay in the study. Because of this, study results may be biased. (Scribbr)
Factorial Design (a type of research methodology that allows for the investigation of the main and interaction effects between two or more independent variables and on one or more outcome variables) (Springer): Having a smaller sample size brings potential problems as well, such as imbalance in groups and potential for bias. Combining the groups when analyzing results can ameliorate some but not all of these problems. A factorial design is incomplete if it does not include every possible combination. (ScienceDirect)
Large Sample Size: A sample that is larger than necessary will be better representative of the population and will hence provide more accurate results. However, beyond a certain point, the increase in accuracy will be small and hence not worth the effort and expense involved in recruiting the extra patients. (National Institute of Health)
What are some issues with sample size?
Used to describe characteristics of a population or phenomenon being studied. It does not answer questions about how/when/why the characteristics occurred. Rather it addresses the "what" question. (Wikipedia)
What is ‘descriptive research’?
A kind of study that rigidly follows a scientific research design. It involves testing or attempting to prove a hypothesis by way of experimentation. As such, it uses one or more independent variables, manipulating them and then using them on one or more dependent variables. (Pollfish)
What is ‘experimental research’?
Cause and effect questions designed to determine whether one or more variables causes or affects one or more outcome variables.
EX: What is affect of exercise on heart rate? (CSUN)
What are ‘causal research questions’?
Directional research occurs when researchers are attempting to predict the direction of the outcome. In a nondirectional research, there is no prediction being stated. (fhsu.edu)
EX:
Directional - do people who sleep more than eight hours a night perform better on tests than people who sleep less than eight hours a night?
Nondirectional - What is the affect of sleep on academic success?
What is the difference between directional and nondirectional research questions?
A statement of expectation or prediction that will be tested by research. Before formulating your research hypothesis, read about the topic of interest to you. (Oakland University)
What are ‘research hypotheses’?
An experimental design whereby two groups are exposed to different experimental conditions. Usually half of the participants are assigned to the experimental group where they are exposed to a condition where the independent variable is manipulated. (mytutor.co.uk)
The main advantages of independent group design are that there are no order effects, there is increased external validity, and it can save time, effort, and money because both groups can go through testing simultaneously. (StudySmarter UK)
Different participants need to be recruited for each condition, which can be difficult and expensive. There is a risk of participant variables (individual differences between participants) affecting the results between conditions, rather than solely manipulation of the independent variable. (Tutor2u)
What are ‘independent research groups’, and what are some pros and cons of this design?
A research design in which subjects are measured two or more times on the dependent variable. Rather than using different participants for each level of treatment, the participants are given more than one treatment and are measured after each. (National Institute of Health)
In a repeated measures design, the same participants participate in each condition, so extraneous participant variables such as individual differences can be eliminated. By reducing the influence of participant variables, the repeated measures design has good internal validity. (StudySmarter UK)
One of the major limitations of repeated measures is order effects. Order effects mean that tasks completed in one condition may affect task performance in another. For example, participants may perform better in the second condition either because of the practice effect or worse because of boredom or fatigue. (StudySmarter UK)
What are ‘repeated measures research groups’, and what are some pros and cons of this design?
Research studies can have built-in demand characteristics: cues to how the researcher expects participants to behave. These expectations can bias participants’ behaviors in unintended ways and lead to socially desirable responding.
What are ‘demand characteristics’?
One variable is categorical with two levels. One variable is continuous.
EX: “Are minivan drivers taller than drivers of other vehicles?”
Variables
Type of vehicle: Categorical with two levels (Minivan vs Other)
Height in Inches: Continuous
You’ll calculate the mean height for the minivan drivers and compare it to the mean height for ‘other’ drivers.
A t-test is required to determine whether two means are significantly different.
Appropriate figures:
Table of means.
Bar graph.
When is it appropriate to use a t test?
One variable is categorical with more than two levels.
One variable is continuous.
EX: “Is there a difference in the number of cruises taken by people who voted Liberal, NDP, or Conservative in the last election?”
Variables
How people voted in the last election: Categorical with more than two levels (LIB, NDP, CON)
# of cruises they’ve taken: Continuous
You’ll calculate the mean # of cruises for each type of voter (LIB, NDP, and CON) and compare those three means.
An Analysis of Variance (ANOVA) test is required to determine whether 3 or more means are significantly different from each other.
Appropriate figures:
Table of means.
Bar graph.
When is it appropriate to use an analysis of variance (ANOVA)?
Both are continuous.
EX: “Do taller people tend to go on more cruises?”
Variables
Height in inches: Continuous.
# of cruises taken: Continuous
A correlation test is required to determine whether there is a significant correlation between two continuous variables.
Appropriate figures:
Scatterplot
When is it appropriate to use a correlation test?
Both are categorical..
EX: “Are minivan drivers more likely to be vegetarian than drivers of other types of vehicles?”
Variables
Type of vehicle: Categorical with two levels (Minivan vs Other)
Diet: Categorical with two levels (Vegetarian or Omnivore)
A Chi-squared test is required to determine whether there is an association between two categorical variables.
Appropriate figures:
Table of proportions.
Bar graph.
When is it appropriate to use a chi square test?
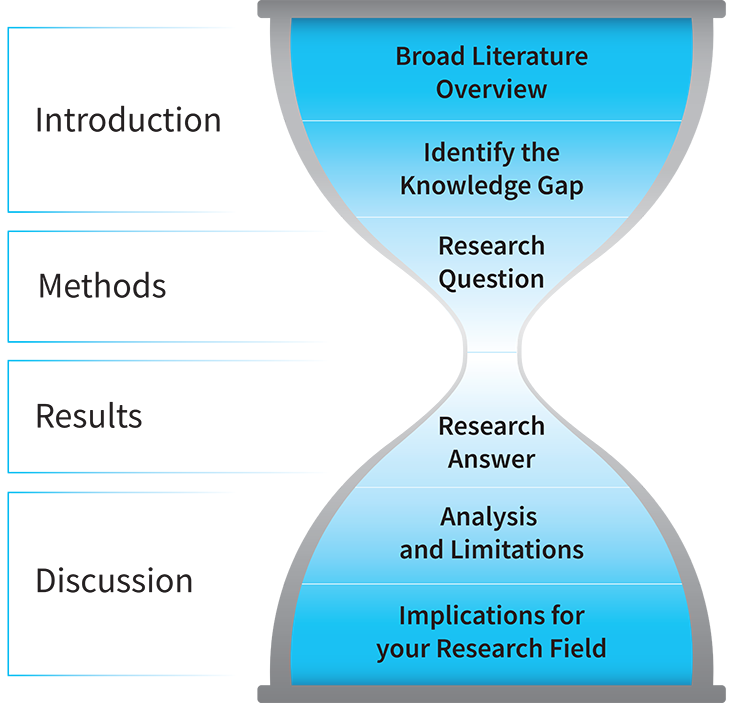
Title of your study and your name.
Introduction Section
Background Information - Very brief version of the background section of your proposal.
Include previous research.
Explicitly and carefully state:
Research question
Type of research
Research hypothesis
Methods Section
Materials
Participants and Procedure
Results Section
Discussion Section
References
What are the components of a poster project?