2. Uncertainty, standard errors and confidence intervals
1/9
There's no tags or description
Looks like no tags are added yet.
Name | Mastery | Learn | Test | Matching | Spaced | Call with Kai |
|---|
No study sessions yet.
10 Terms
Unknown population distribution
In research, have to get sample, measure some of their variables, then get the mean and SD from the sample and infer what the pop. distribution could be. Each sample will give different values and we dk how close to the pop dist they are - therefore we use standard errors and confidence intervals to quantify the uncertainty
What is an estimate?
An approximation of a number based on reasonable assumptions. E.g. - want to know if two variable are associated, estimate wld be a measure of association i.e. correlation coefficient
Normal distribution VS normal sampling distribution
Normal distribution - mean = central value, sd = avg distance from mean, proportions = approx 68% are 1sd of mean etc etc
Normal sampling distribution - mean of sampling distribution centred on pop. value, standard error (like the sd) = avg difference between each score and the sample mean, sd of sample means = avg dif between each sample mean and the pop. value
Standard error
Useful for quantifying uncertainty in estimates, it describes the extent to which samples differ from each other in a sampling distribution. Can be used to construct an interval where a certain % of sample means will fall
Estimating standard error from the sample
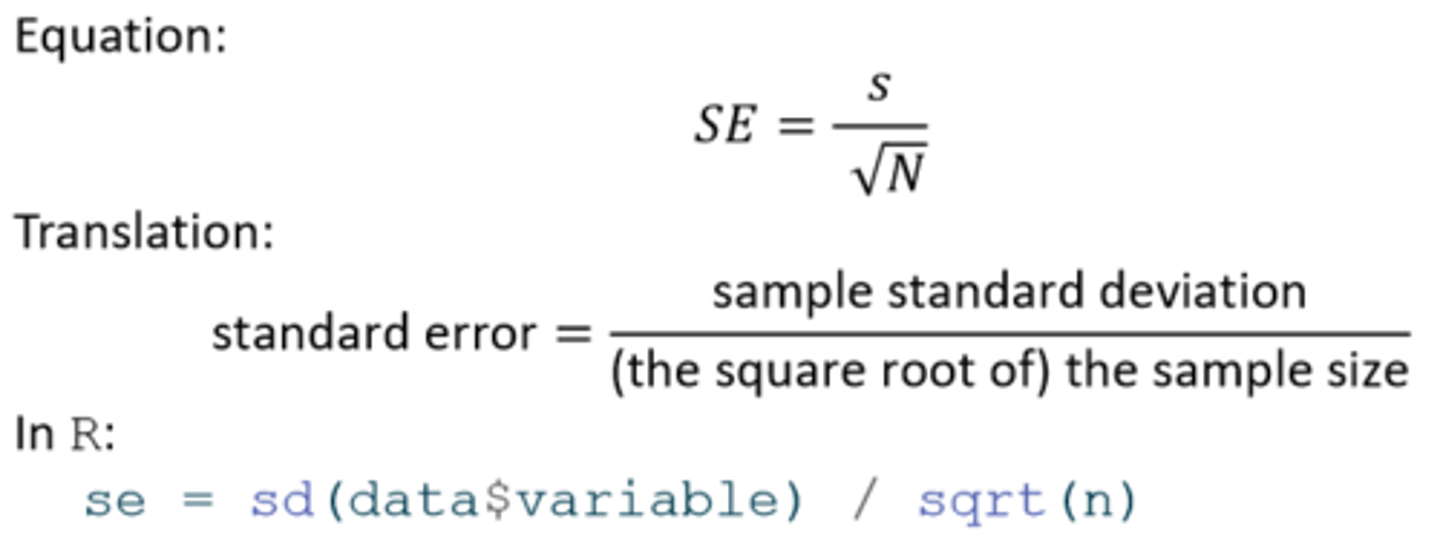
Sampling distributions are only a concept, and we only actually have access to one sample with one mean, therefore to use a standard error to construct an interval we have to estimate it.
This is done by dividing the sample standard deviation by the square root of the sample size.
Confidence interval
Lower CI limit = sample mean - 1.96 * standard error
Upper CI limit = sample mean + 1.96 * standard error
HOWEVER, smaller samples don't approximate a normal sampling distribution very well, so the 1.96 value cannot be used to give accurate intervals. Therefore we use the t-distribution...
t distribution
Defined by degrees of freedom (df) - calculated by n - 1 (number of obvs. minus 1). Critical t value (value used instead of 1.96 to calculate 95% CIs) will change for different dfs
The critical t gets closer to 1.96 with larger samples - the t-distribution will approximate a normal distribution more closely
t-based confidence intervals
Small sample = wider CI because a lot more uncertainty over whether the estimate is actually representative of the pop.
Larger sample = tighter CI because critical t gets smaller and closer to 1.96 (happens as sample size - df - increases)
Confidence intervals across samples
Take multiple samples, compute mean, construct CI - 95% will contain pop. val, 5% will not. This is known as interval w/ 95% coverage. DOES NOT mean that there is 95% confience of the pop val falling between upper and lower CI OR 95% probability of it falling between upper and lower.
How to interpret confidence intervals
ASSUMING THAT our sample is one of the 95% producing confidence intervals that contain the pop val, then the pop val for the estimate of interest falls somewhere between the lower limit and the upper limit of the interval we've computed for our sample.