STSCI 2150: Final Review
1/99
Earn XP
Name | Mastery | Learn | Test | Matching | Spaced | Call with Kai |
|---|
No analytics yet
Send a link to your students to track their progress
100 Terms
Details on paired design
Data from the two groups are paired
Each member of the pair shares much in common with the other, except for the grouping
There is a one-to-one correspondence between the individuals in the two groups
One member gets one treatment, the other gets something else
In paired comparisons, we use what to compare?
We use the mean of the difference between the two members of each pair
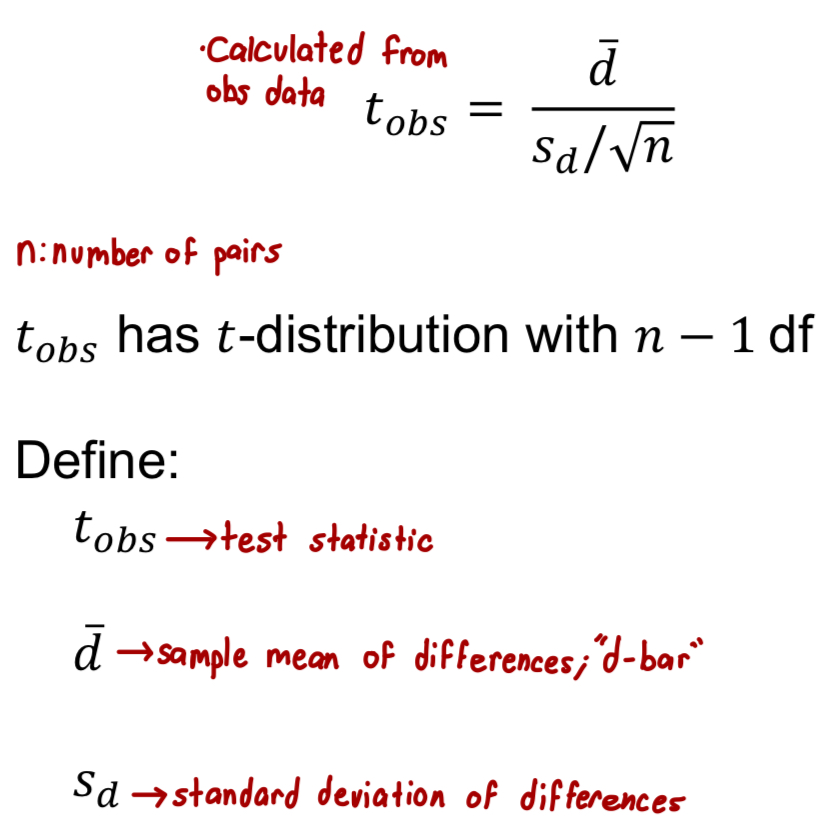
What do d-bar and μd represent?
d-bar: mean of the differences; average of all paired differences
μd: the parameter that is in our hypothesis
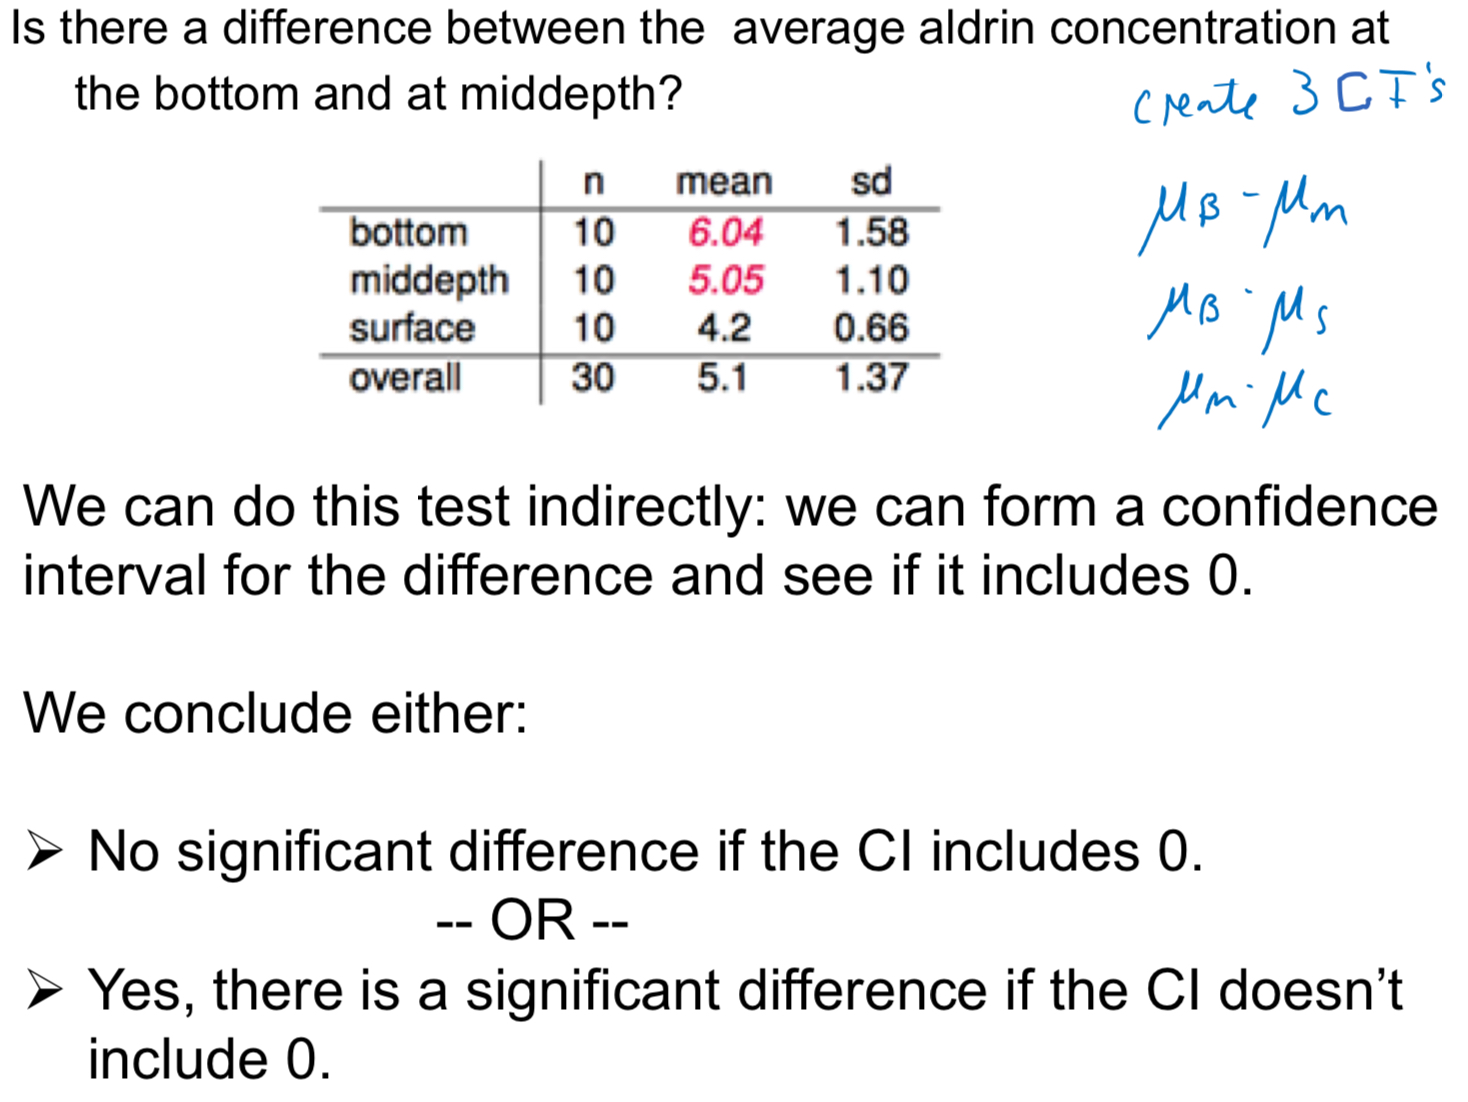
For paired design, what are the three types of inference about the true difference between elements of a pair, μd?
Point estimate of μd: d-bar
Interval estimate of μd
Hypothesis Test: “Paired t-test”; H0: μd = 0
What is μd?
μd is the population mean difference between the 1st element and 2nd element of each pair
What is the best point estimate of μd?
The sample mean of differences (d-bar)
Null and alternative hypothesis for paired t-test
H0: μd = 0
HA: μd ≠ 0
What is the test-statistic formula for a paired t-test?
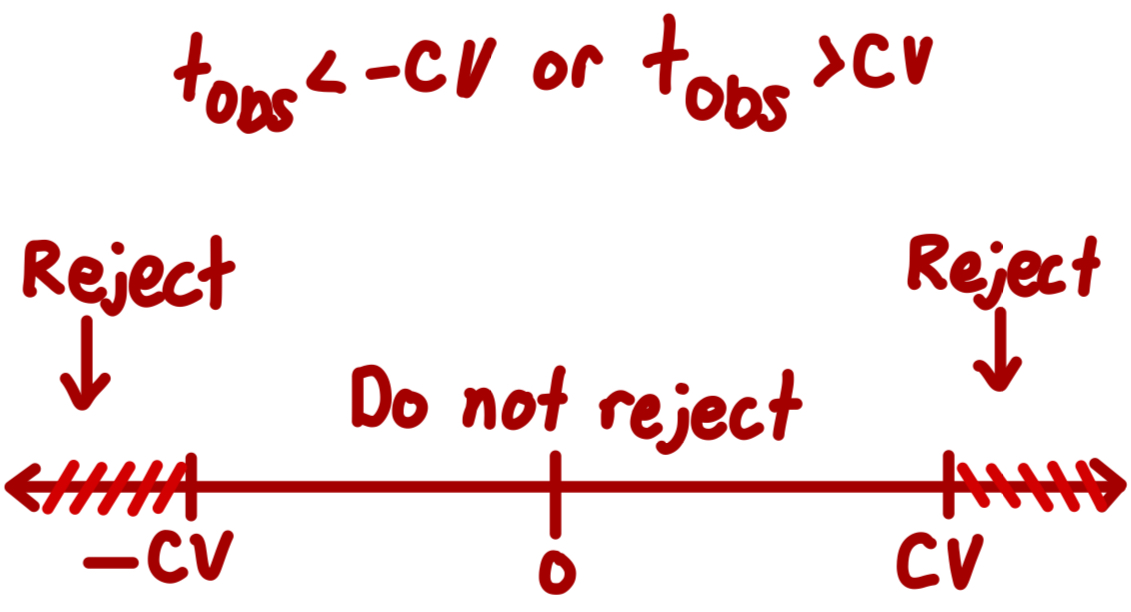
How do you find the critical value of t?
talpha(2), df
When do we reject with critical value?
What is the r-code to find p-value and critical value?
P-value: pt(tobs, df)
Critical Value: qt((1-(alpha/2)), df)
What is the E step of TUNA TEA for paired t-test?
Null Distribution: tobs has t-distribution with n-1 df (where n: number of pairs)
P-Value or Critical-Value: do one or other, not both
Decision
English
What are the assumptions of paired t-test and confidence interval for μd?
The sample is a random samples of pairs
Distribution of the differences in the population has a normal distribution
What is the confidence interval for μd?
Confidence interval for the mean of differences of two groups
Note: This is not inference about the difference of means
What is the formula for the confidence interval for μd?
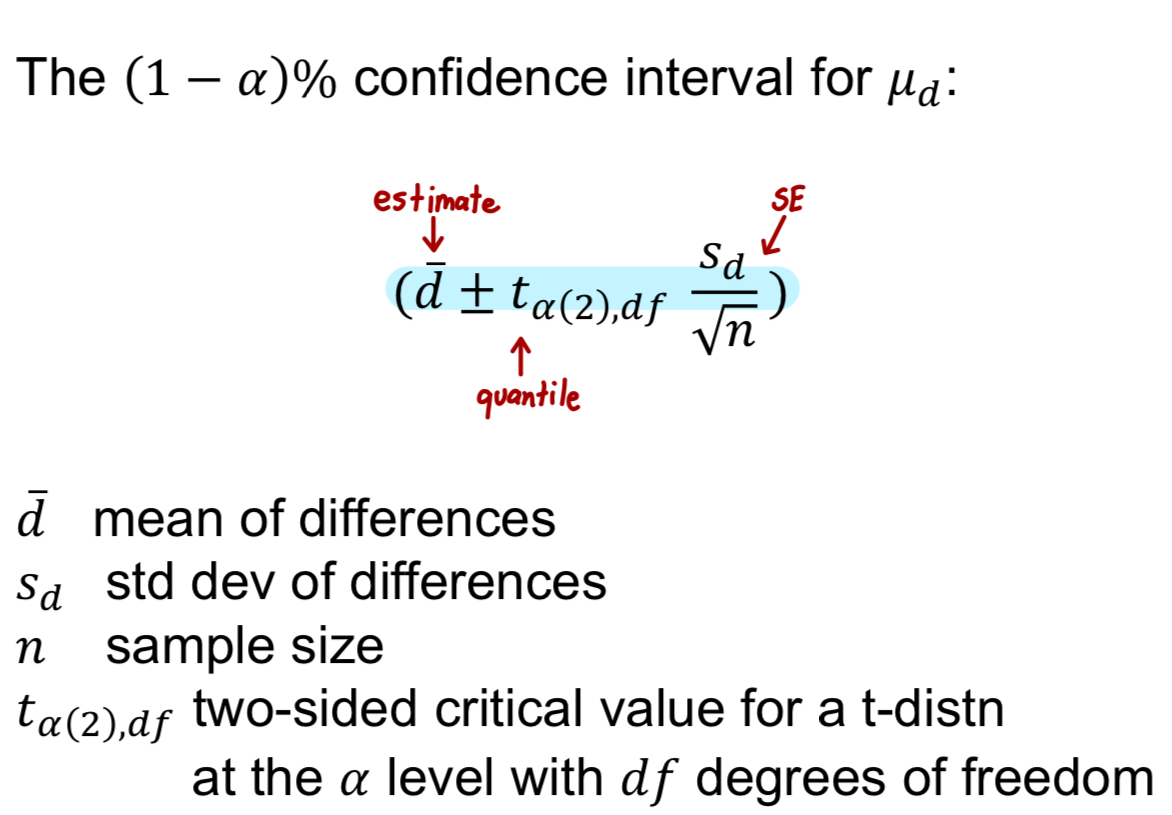
Conclusion for confidence interval for μd
We are 95% confident that the true mean difference between ___ and ___ is between ___ and ___
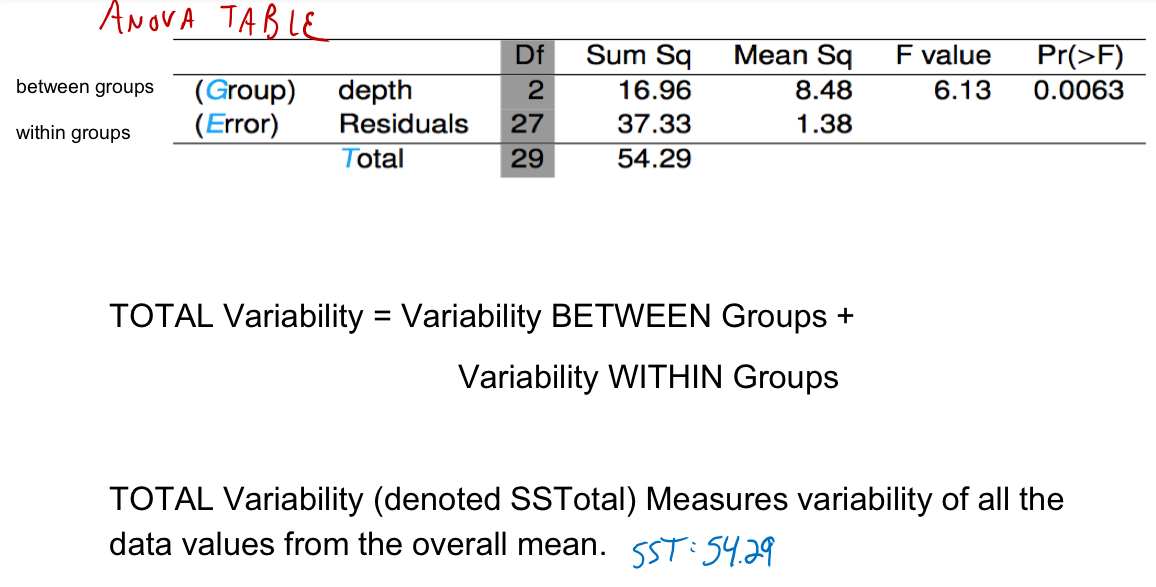
What is an ANOVA Test?
ANOVA (Analysis of Variance): used to test the equality of three of more means
Context for ANOVA Test
Outcome variable is continuous (“numerical”)
More than two groups
Want to compare population means
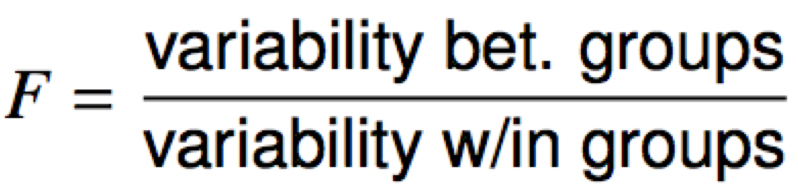
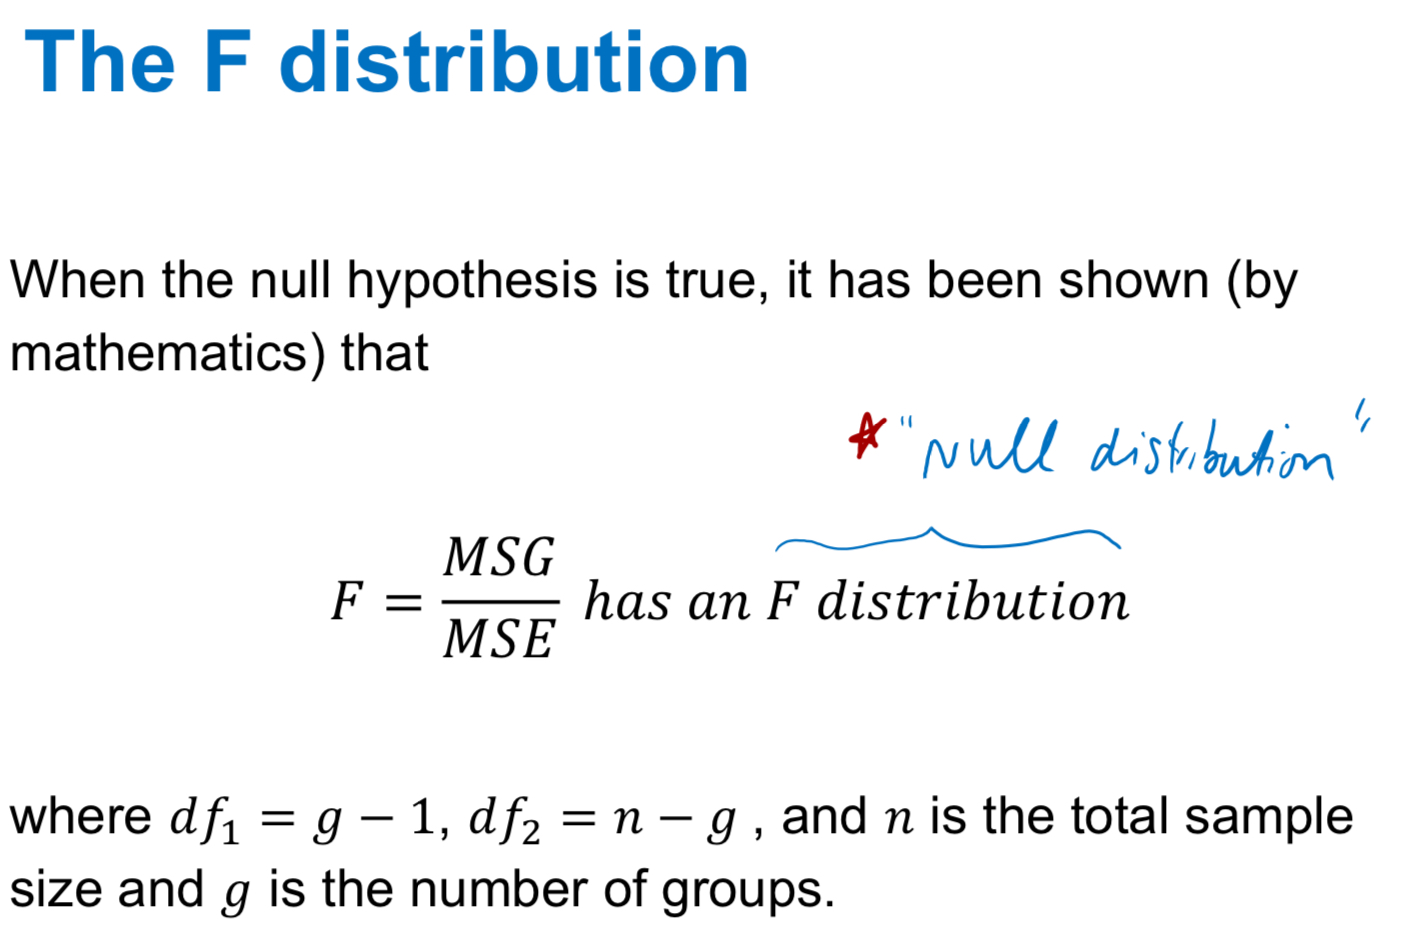
For an ANOVA Test, what test statistic and distribution do we use?
Compare F-test statistic to an F distribution
What happens when we get a large F-Value? What about small F-value?
When F-value is large, reject the null hypothesis
When F-value is not large, do not reject the null hypothesis
What are the null and alternative hypothesis for an ANOVA test?
H0: Population means of all groups are equal (μ1=μ2=μ3)
HA: At least one mean is not equal to the rest
ANOVA Test Assumptions
The observations should be independent within and between groups and should be a random sample from the corresponding population
The observations within each group should be nearly normal. Especially important when the sample sizes are small
The variability within each group should be about equal to variability in other groups. Especially important when the sample sizes differ between groups
What is the formula for the test statistic of ANOVA tests?
What do large test statistics lead to? What if the P-value is small enough?
Large test statistics lead to small P-values
If the P-Value is small enough, H0 is rejected. Then we conclude that the population means are not all equal
What do you need in order to obtain a large F statistic?
In order to obtain a large F statistic, variability between group sample means needs to be relatively greater than variability within each group
What is total variability?
What is SSG and SSE? What is the formula for mean square?
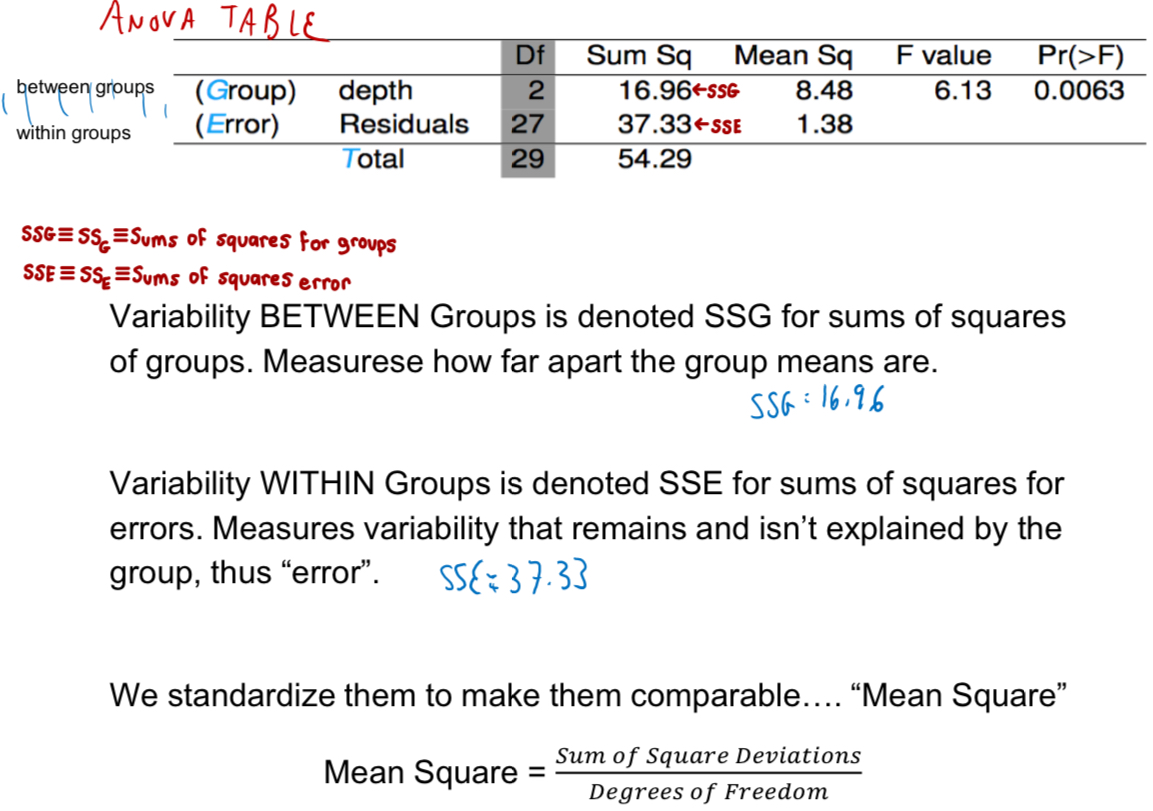
How do you calculate mean square, MSG, MSE, F, and degrees of freedom?
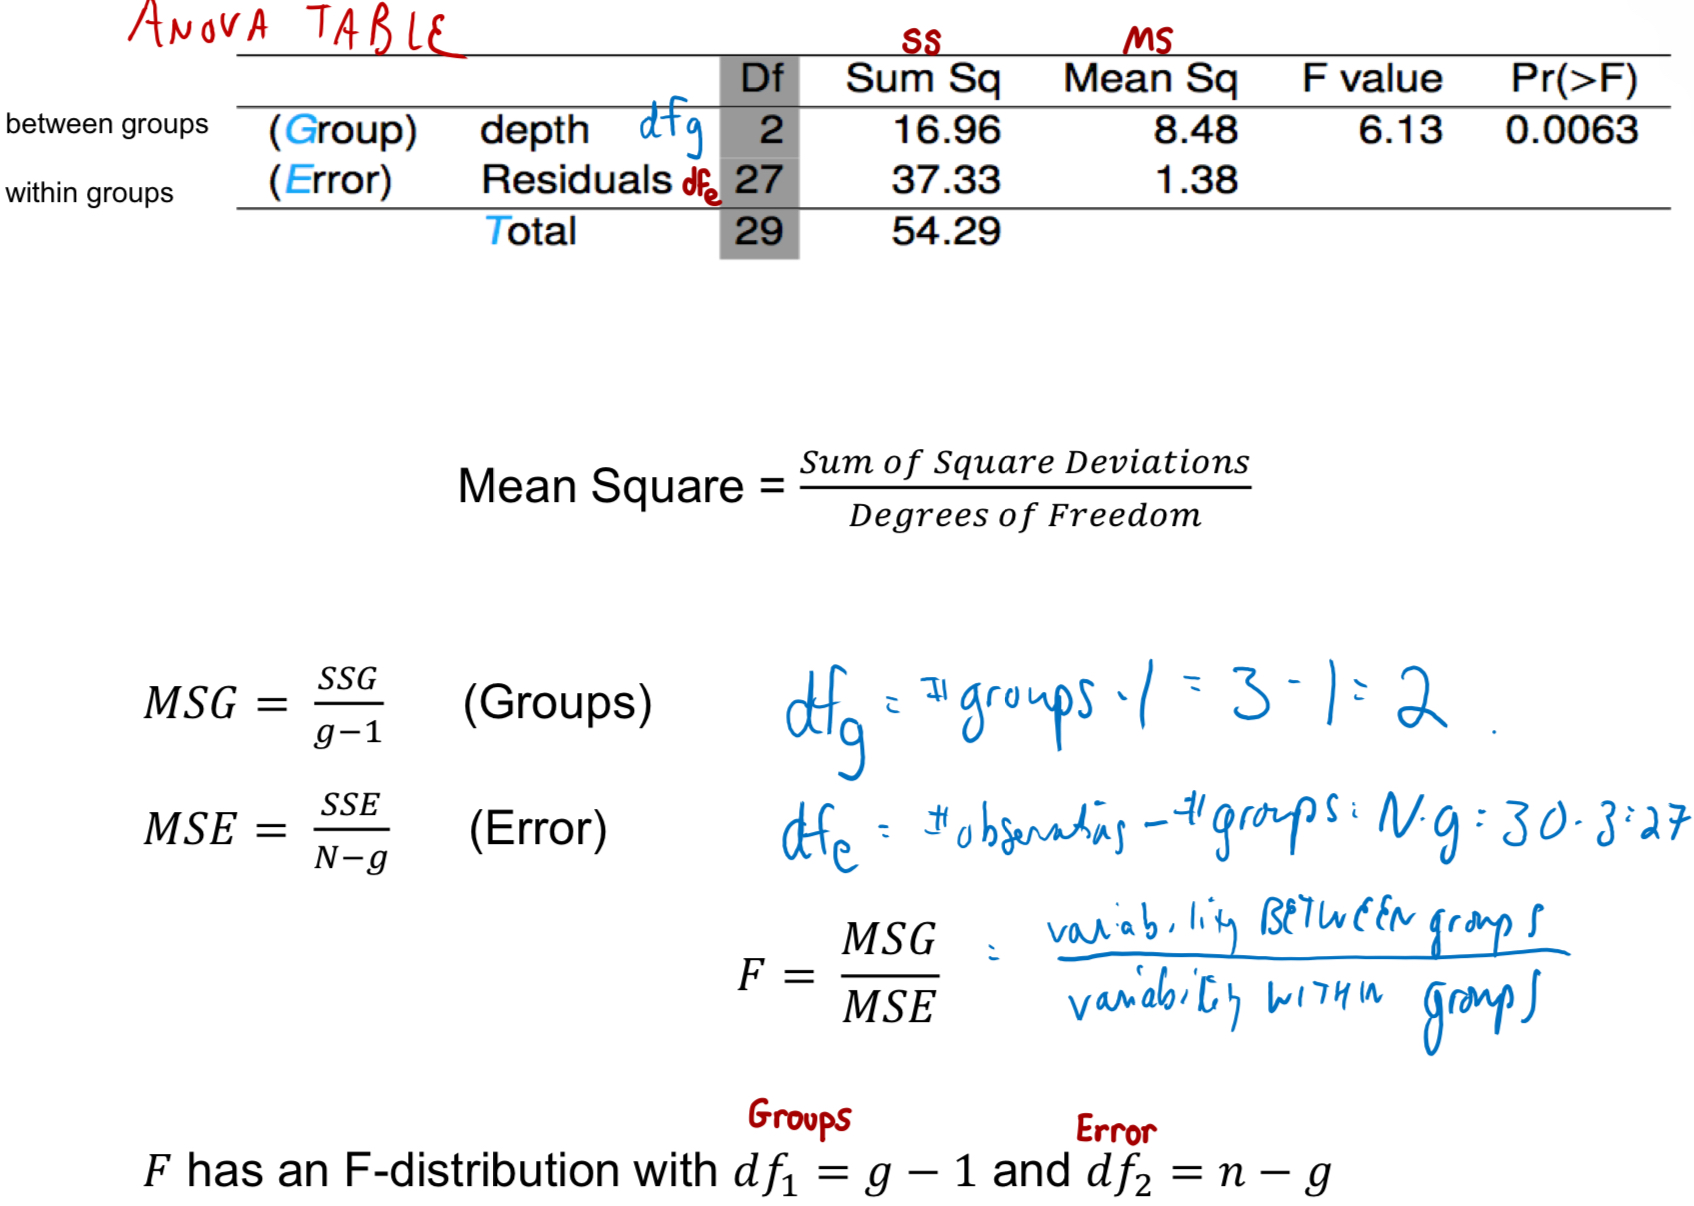
How is mean square error calculated?
Calculated as sum of squares divided by the degrees of freedom
What is the T of TUNA TEA for ANOVA?
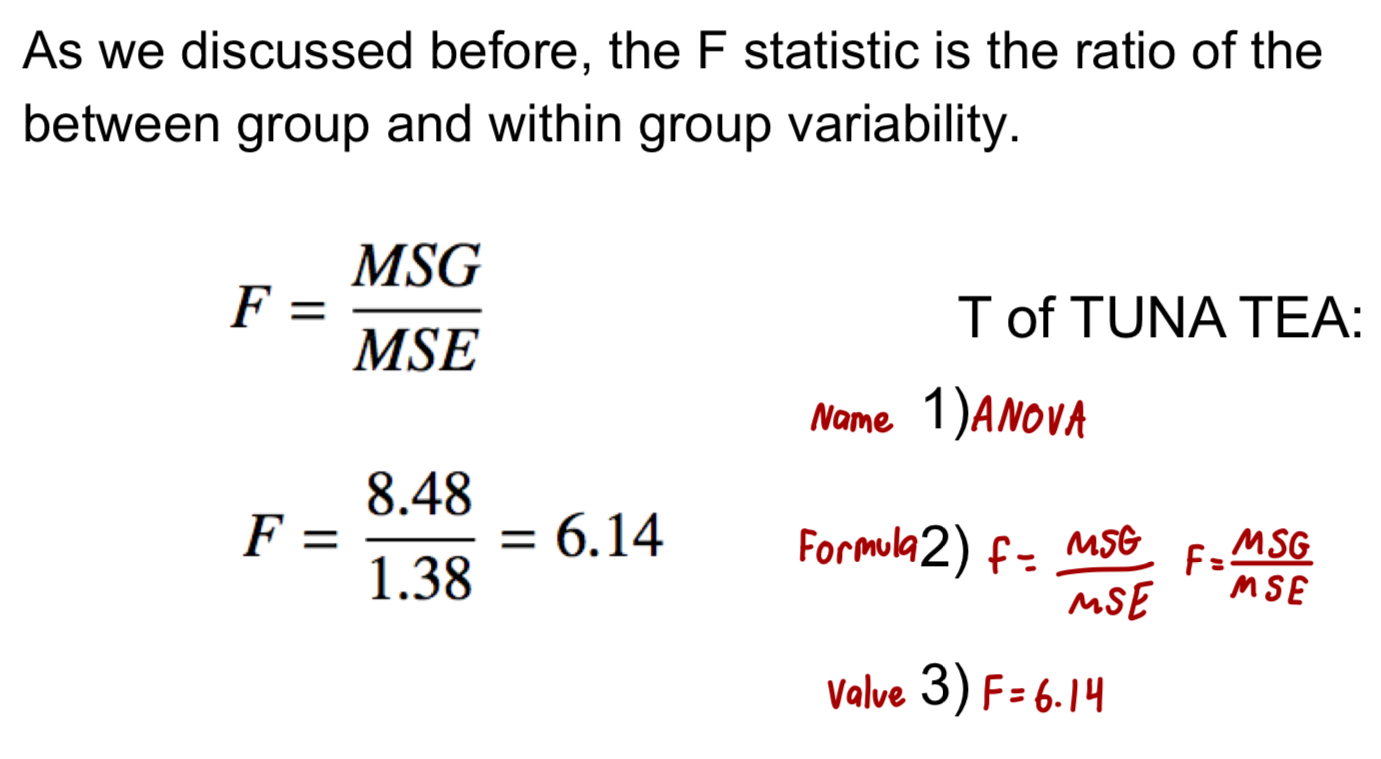
What is the formula for F and degrees of freedom?
g: number of groups
n: total number of observations
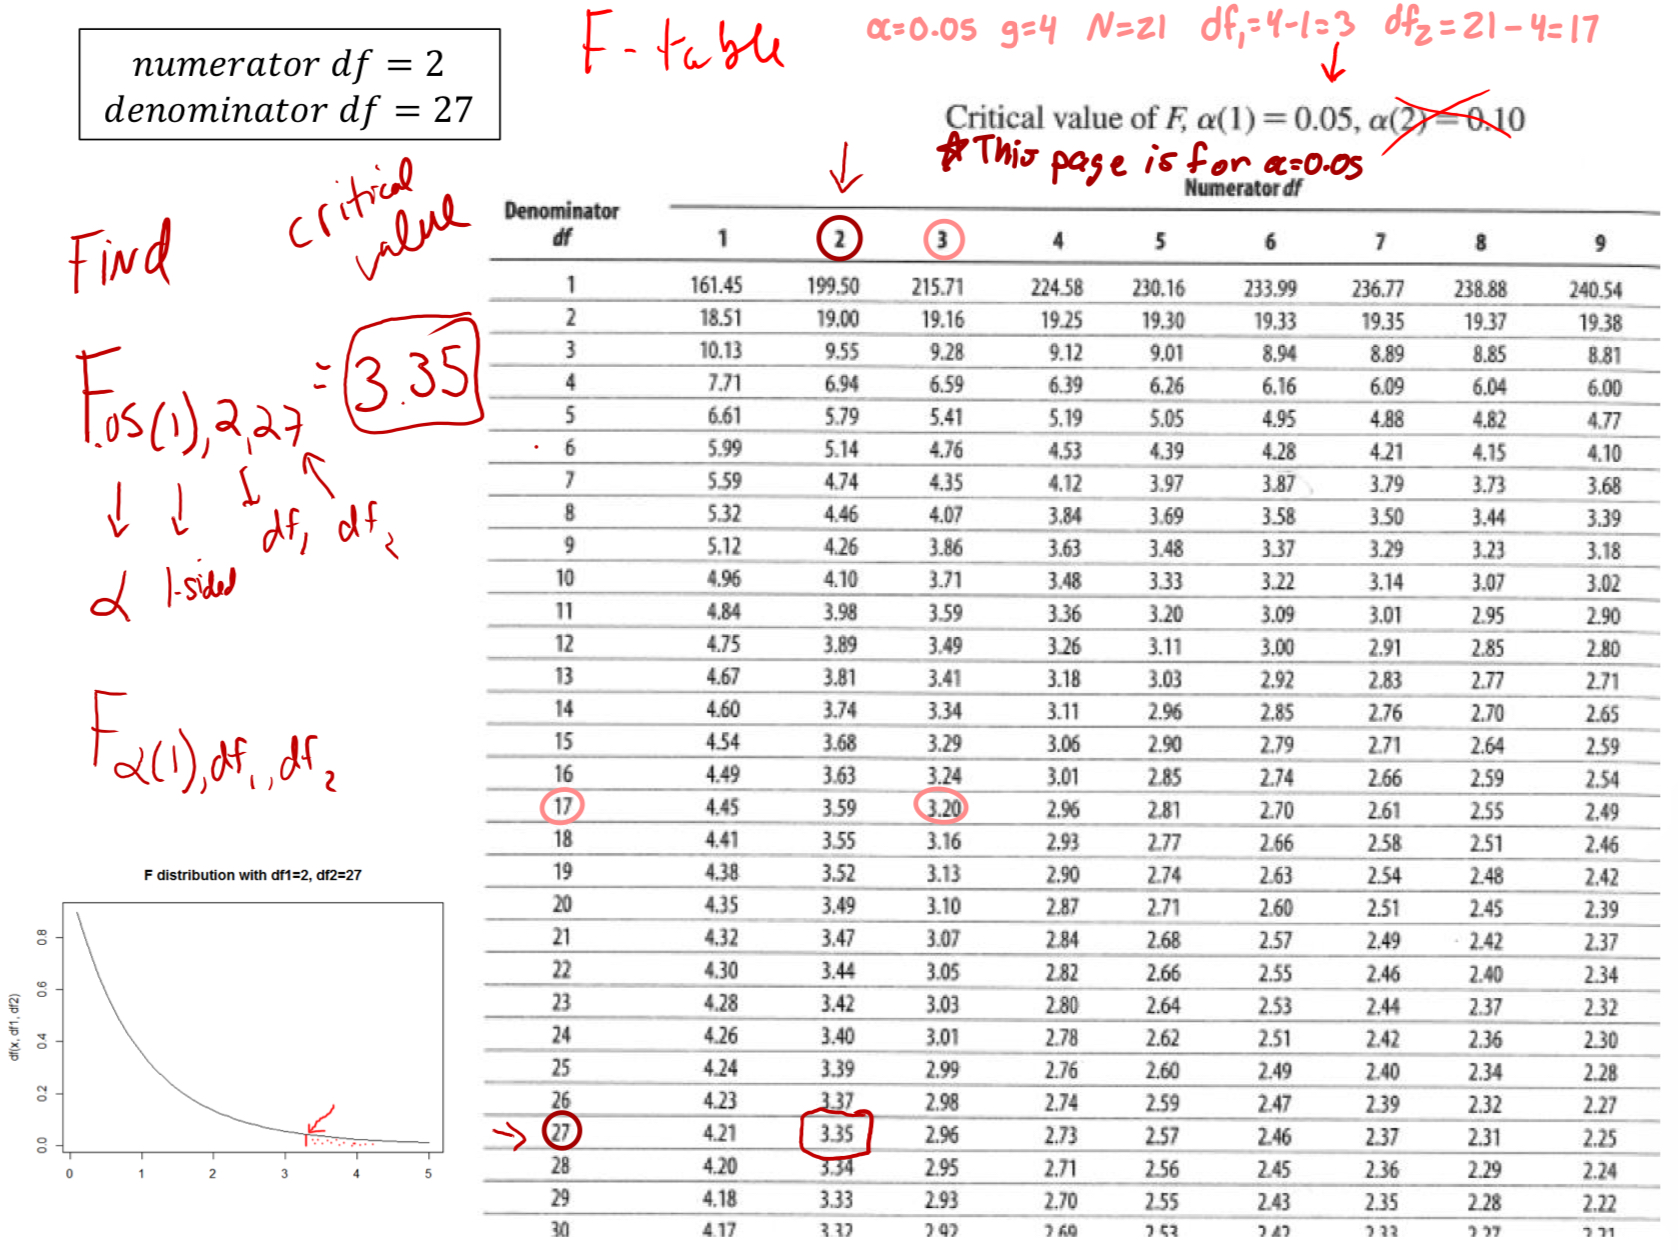
What is the R-code for p-value and critical value?
1-pf(test statistic, df1, df2)
qf(1-alpha, df1, df2)
Note: qf() is one-sided always. df1 is numerator df and df2 is denominator df
How do you use an F-table?
What is the null distribution for ANOVA?
F distribution with df=# and df=#
What are the three assumptions for ANOVA?
The observations should be independent within and between groups and should be a random sample from the corresponding population
The observation within each group should be nearly normal. Especially important when the sample sizes are small
The variability within each group should be about equal to variability in other groups. Especially important when the sample sizes differ between groups
How can you assess if the observations are independent and random samples?
Read about study design
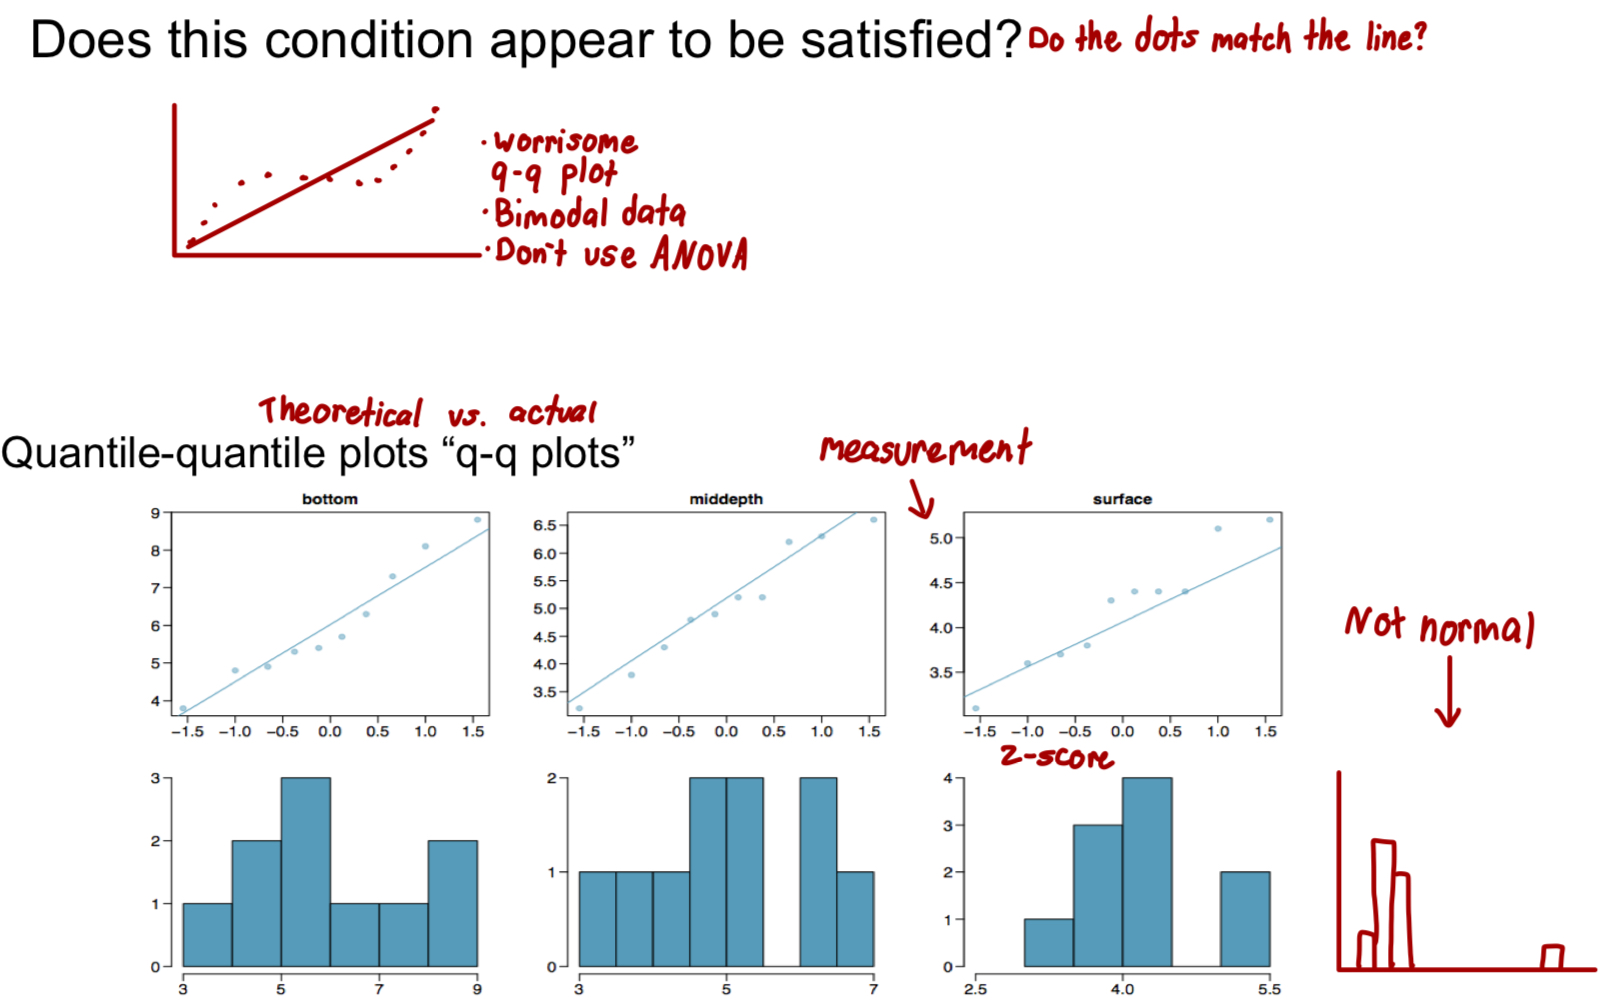
How can you assess approximately normal data?
Graphs
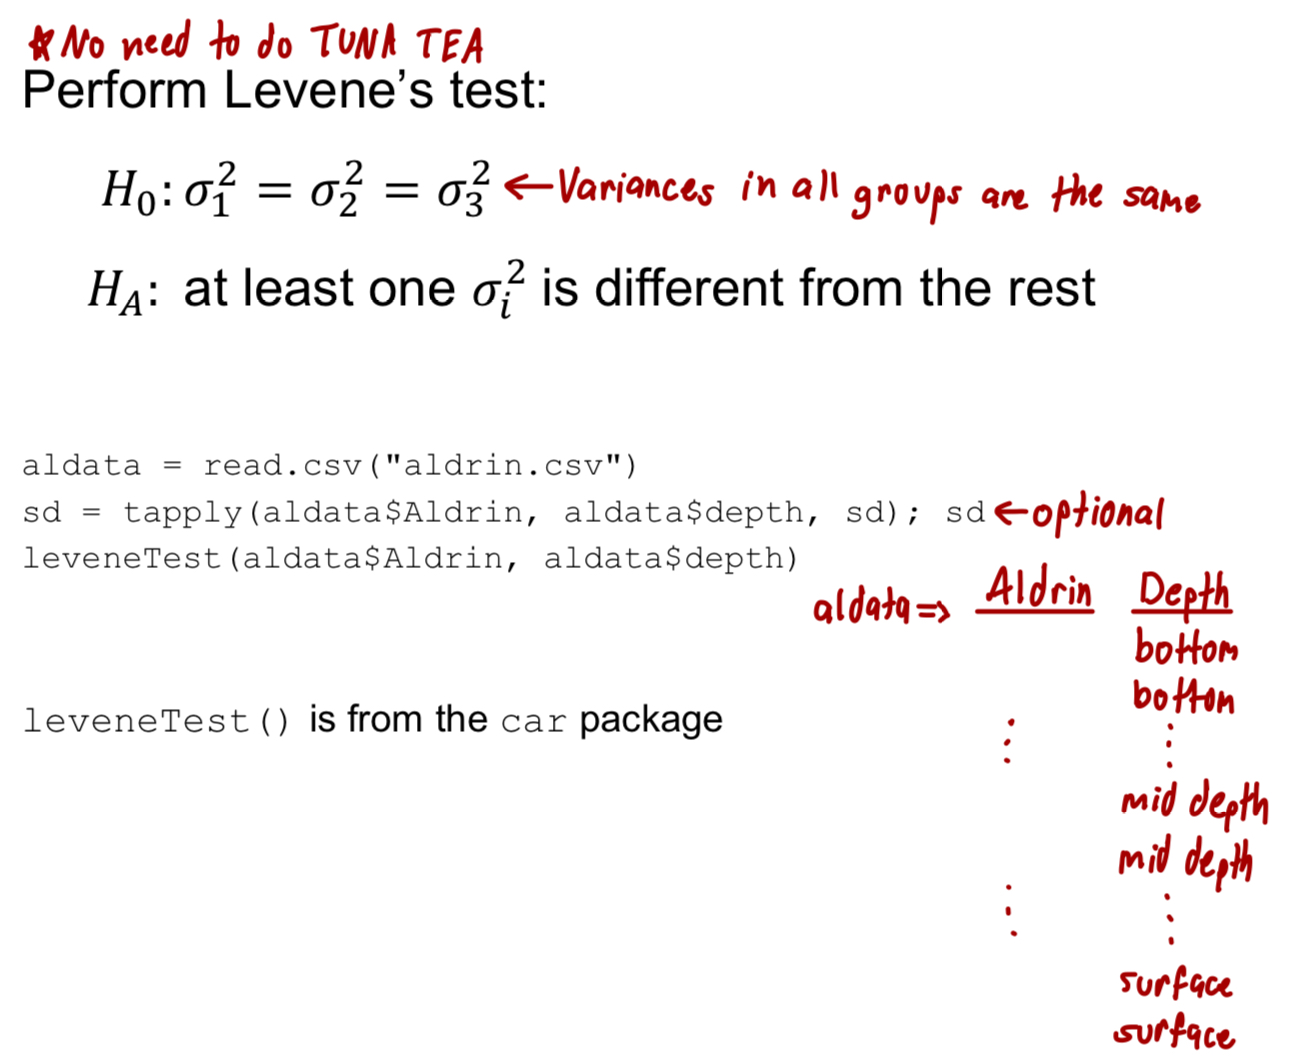
How can you asses equal variances?
Levene’s Test
ANOVA conclusions
If P-value is small (less than alpha), we reject the null hypothesis. The data provide convincing evidence that at least one mean is different from the others (but we can’t tell which one)
If P-value is large, we fail to reject the null hypothesis. The data do not provide convincing evidence that at least one pair of means are different from each other
What is the situation after ANOVA test?
If null is not rejected → do nothing more
If null is rejected → figure out why
If the means do differ, why can we not do a two-sample t test for differences in each possible pair of groups?
Inflates type I error
Difficult
Time consuming
What is the preferred method as an alternative to multiple t-tests?
Tukey HSD Intervals
What does multiple comparisons refer to?
The scenario of testing many pairs of groups
What does the Bonferroni correlation suggest?
Suggests that a more stringent significance level is more appropriate for multiple comparisons
a* = a/K, where K is the number of comparisons being considered (get new alpha)
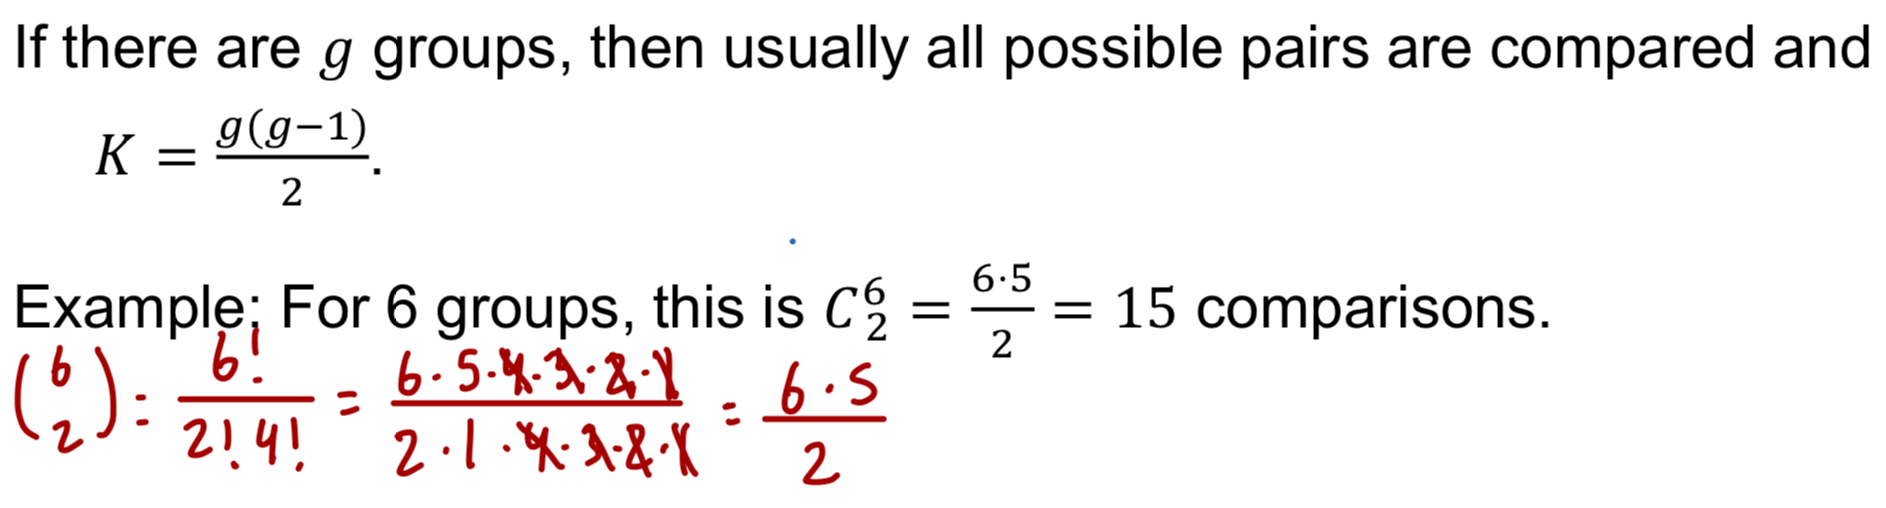
If there are g groups, then what?
For pairwise comparisons, when at least two means are different, what do we do?
Use Tukey HSD intervals that control for family-wise confidence levels
Tukey Honestly Significant Difference or “Tukey-Cramer“
What are conclusions for Tukey HSD?
What do Tukey-Kramer intervals assure? What does this mean?
Use Tukey-Kramer intervals, which assure a 95% family-wise confidence level for all pairwise confidence intervals
A 95% family-wise confidence level means that the chances of at least one Type I error is 5%, for the entire set of confidence intervals (controls for Type I error)
What is the context regarding correlation?
Context: we use correlation with 2 numerical variables
What is correlation?
Quantifies the strength and direction of the linear relationship between two numerical variables
Strong vs weak
Positive vs negative
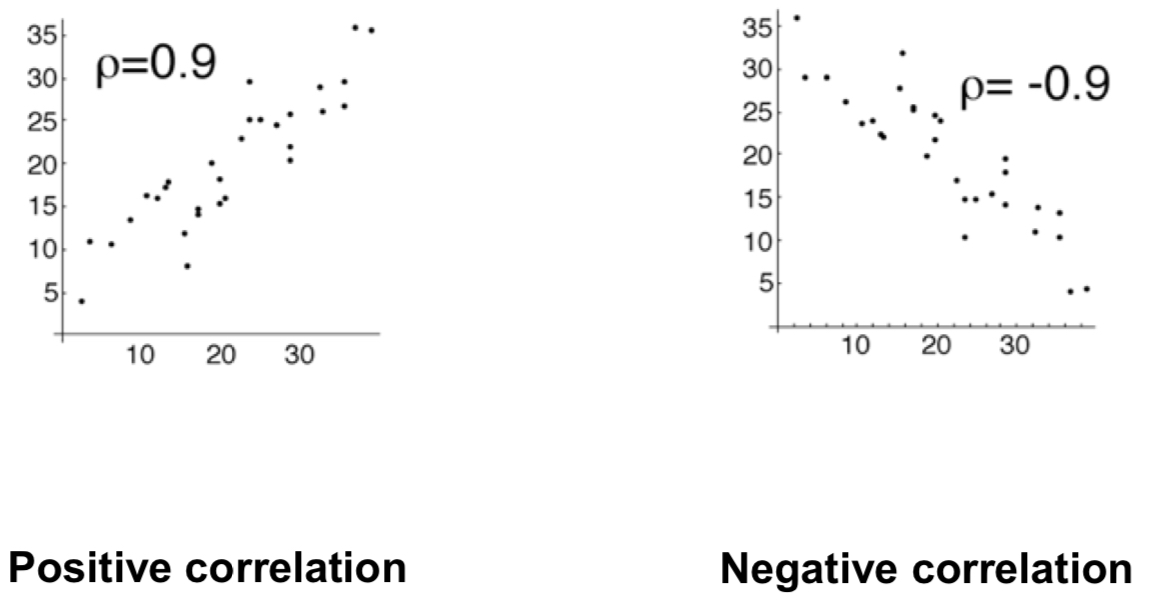
What are the graphs for positive correlation and negative correlation?
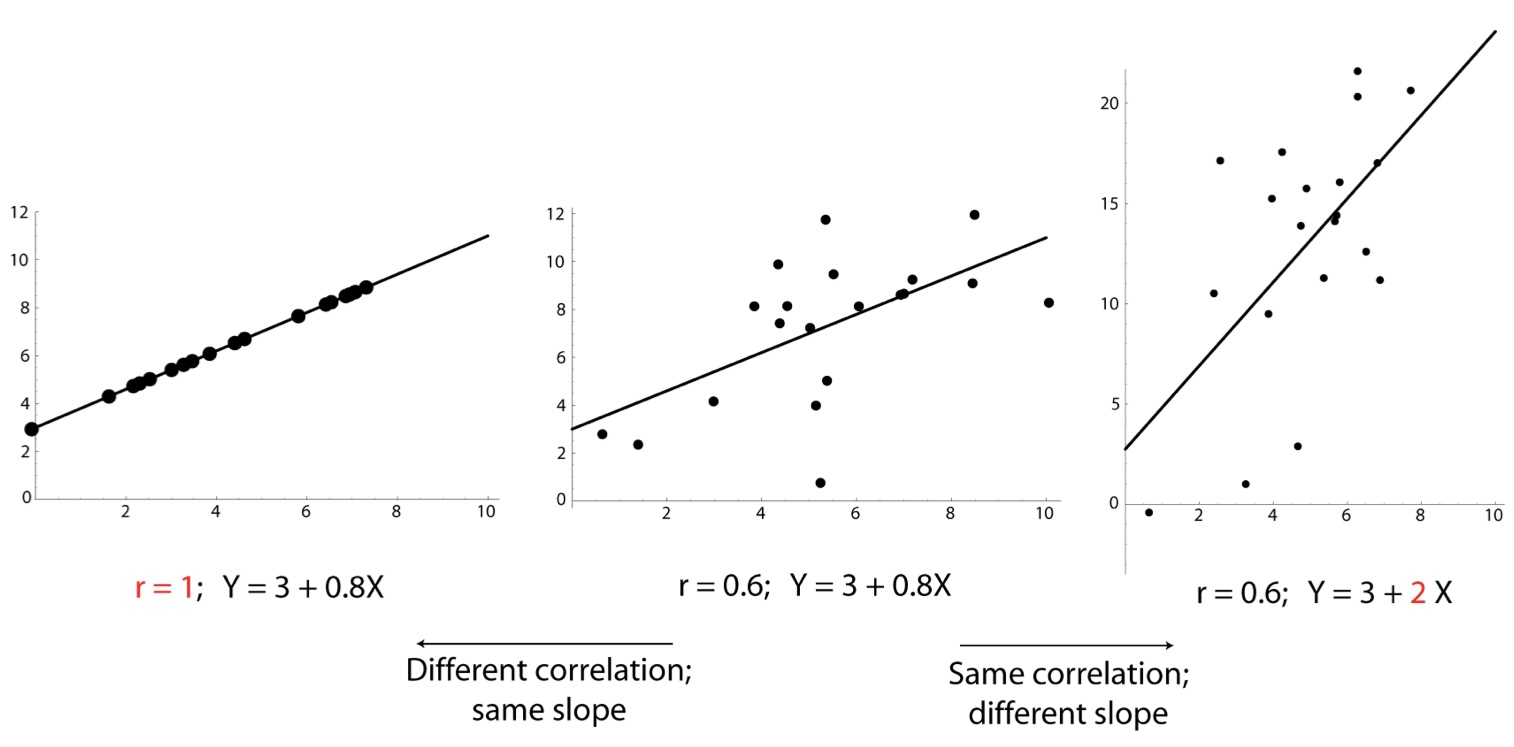
What is r?
Correlation: r
r is called the “sample correlation coefficient
Numerically describes the linear relationship between two numerical variables. It is a number, calculated from the data
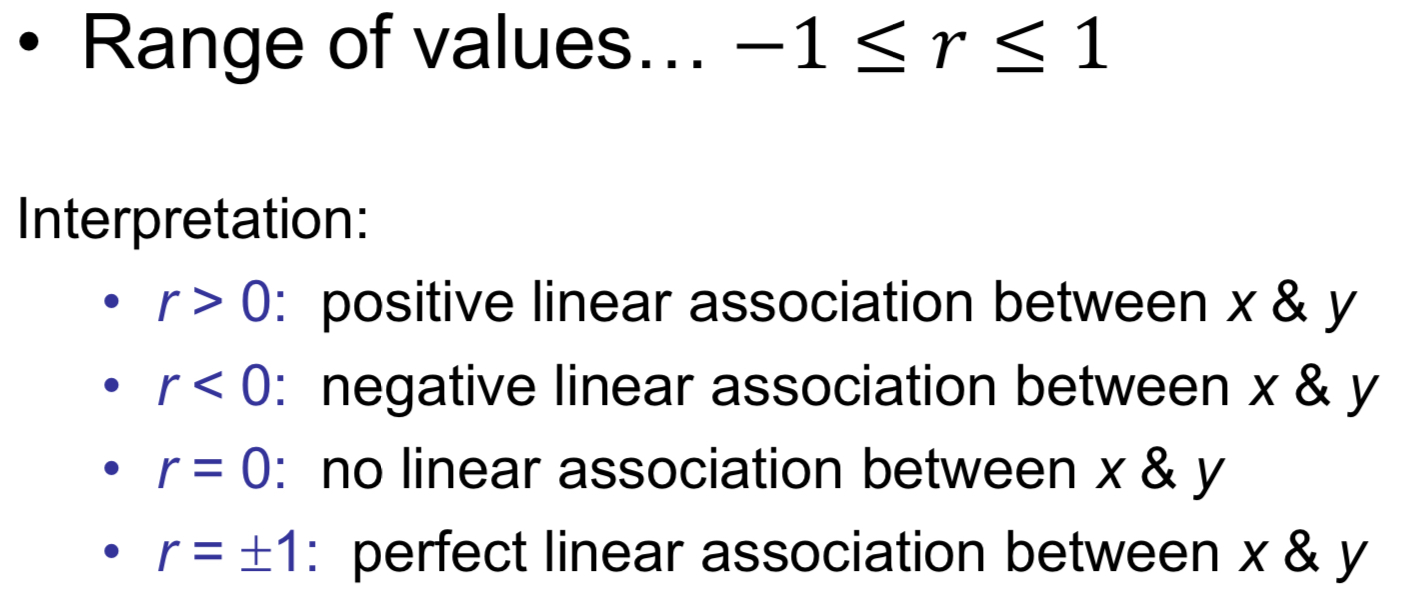
What is the range of values for r? What are the interpretations?
What is the assumption for correlation?
Bivariate Normal
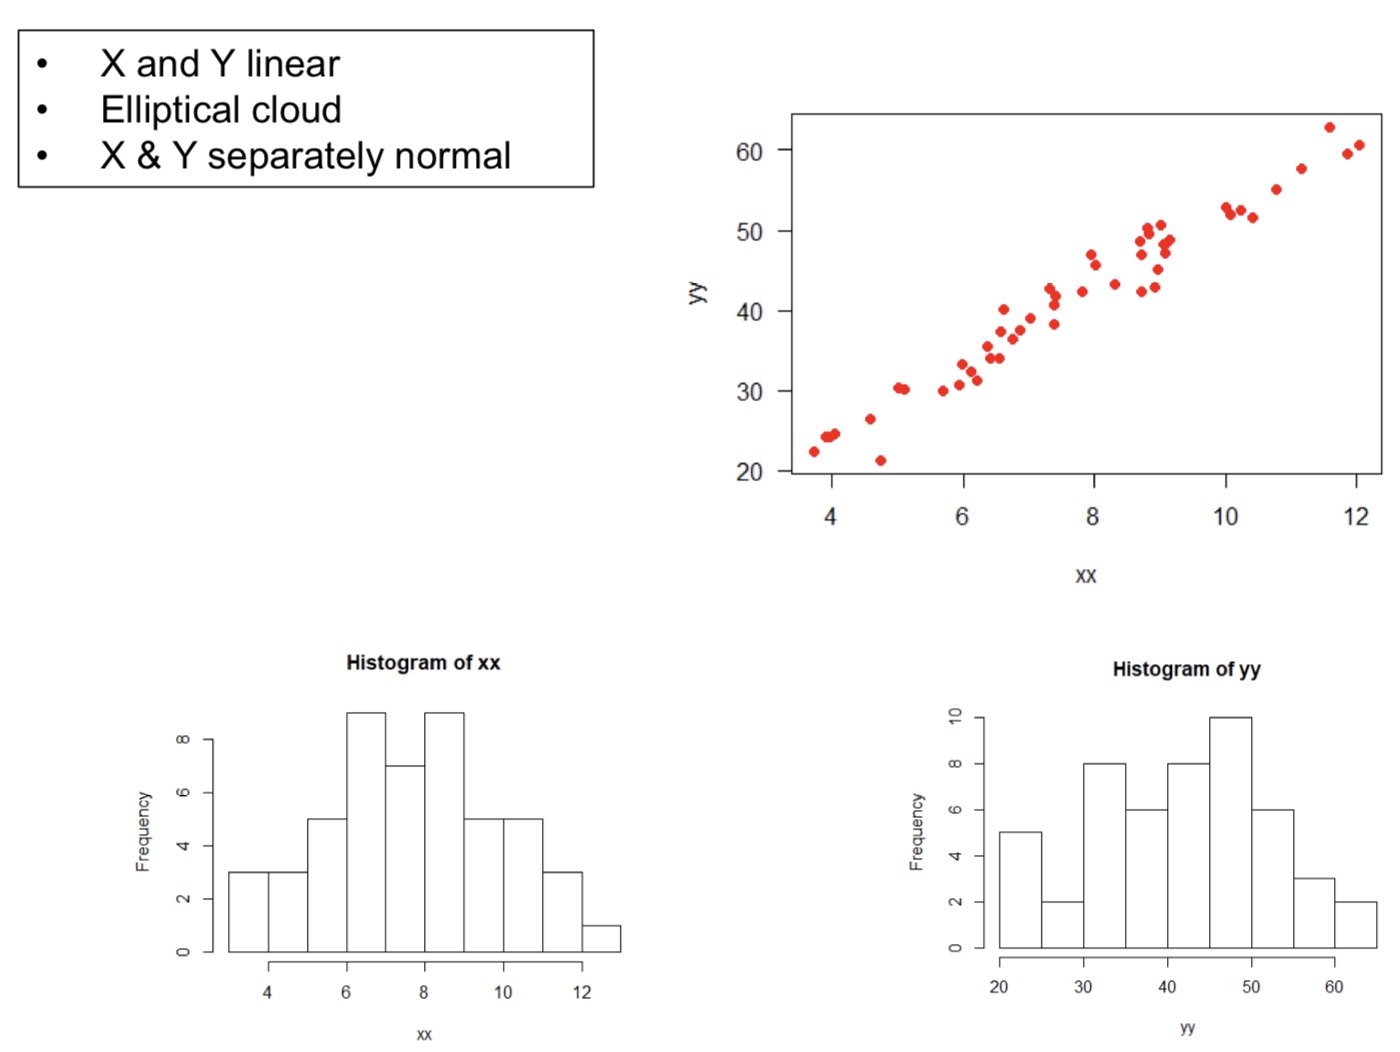
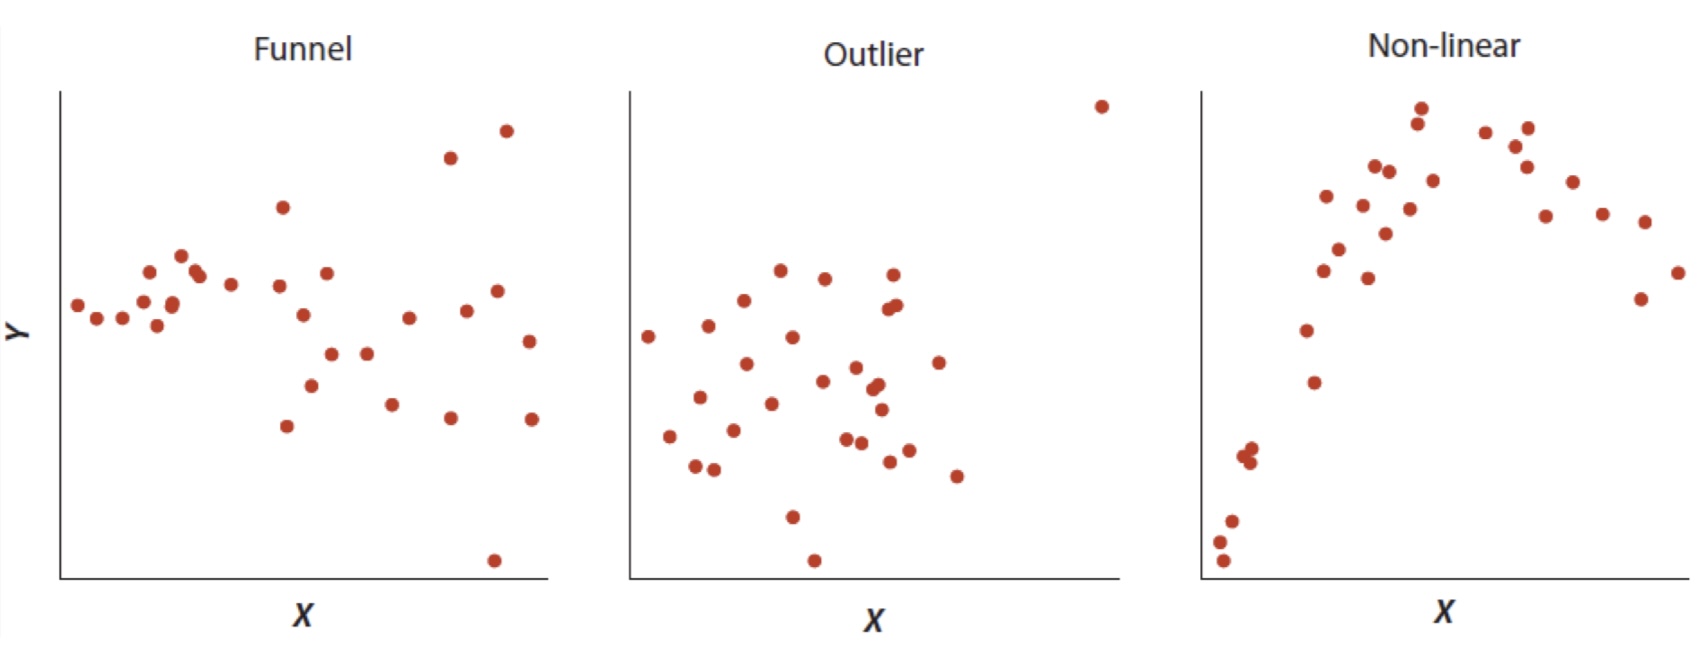
What are some common deviations from bivariate normal?
What is correlation? What does correlation measure? What is there a stronger association between? What does correlation not imply?
It is single number, and the sign of r (+ or -) gives direction of association
Correlation measures the strength of the linear association between two variables
Stronger association between x and y
r is larger in magnitude, that is, closer to +1 or -1
knowing x helps more in predicting y & vice versa
Correlation does not imply causation
What are some correlation common errors?
Error: Assuming that correlation implies causation
Truth: correlation can result from many circumstances, of which causality is only one
Error: Failing to distinguish between correlation, which is linear, and association, which can be strong but possibly nonlinear
Truth: These are two different, but related topics
If two variables are correlated, what does it not mean?
Just because two variables are correlated, does not mean that one causes the other
Correlation is not causation
Correlation vs regression
Correlation quantifies the linear relationship between two variables
It is a number and has its uses
More powerful tool: Linear Regression
Both quantify relationships between 2 variables
Correlation: a number, used for just two variables
Regression: an equation, predicting Y and X, used with two or more vairables
What is the intuitive approach for regression?
Two variables change together
What is the context for regression?
Two numerical variables, with a linear relationship
Can we use one to predict the other?
Need to do a test of significance to officially determine this
What are residuals?
The difference between the observed (yi) and predicted yi-hat
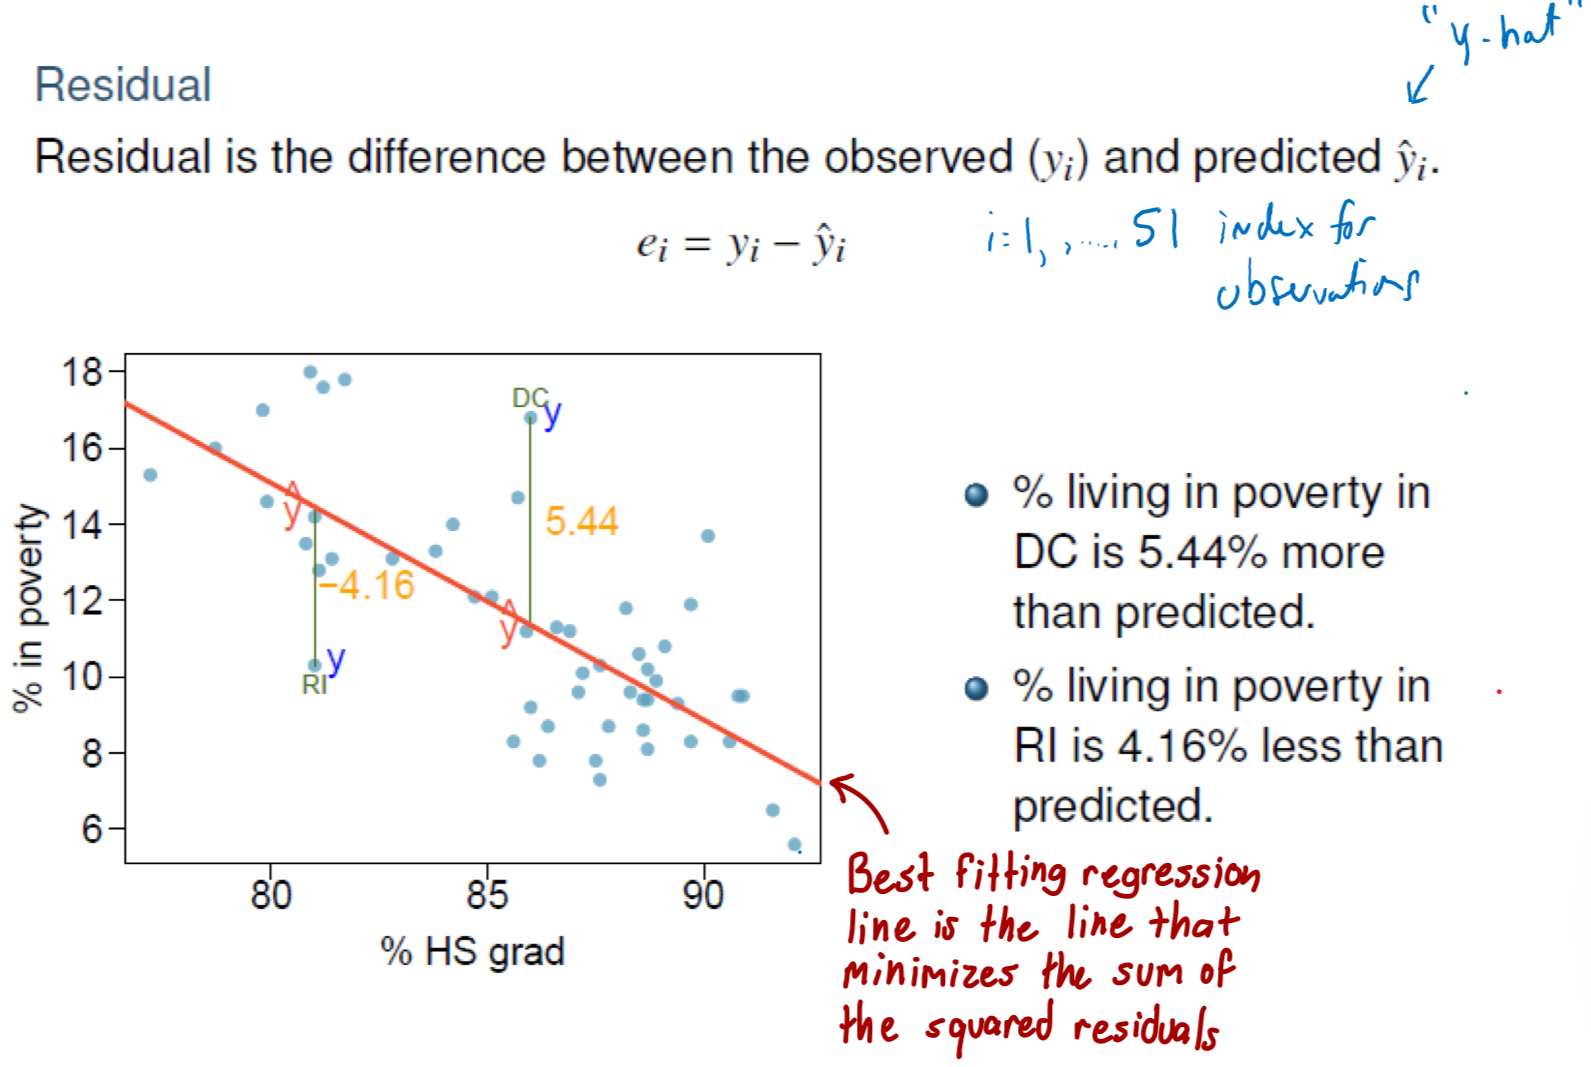
What is the formula for fitted regression line?
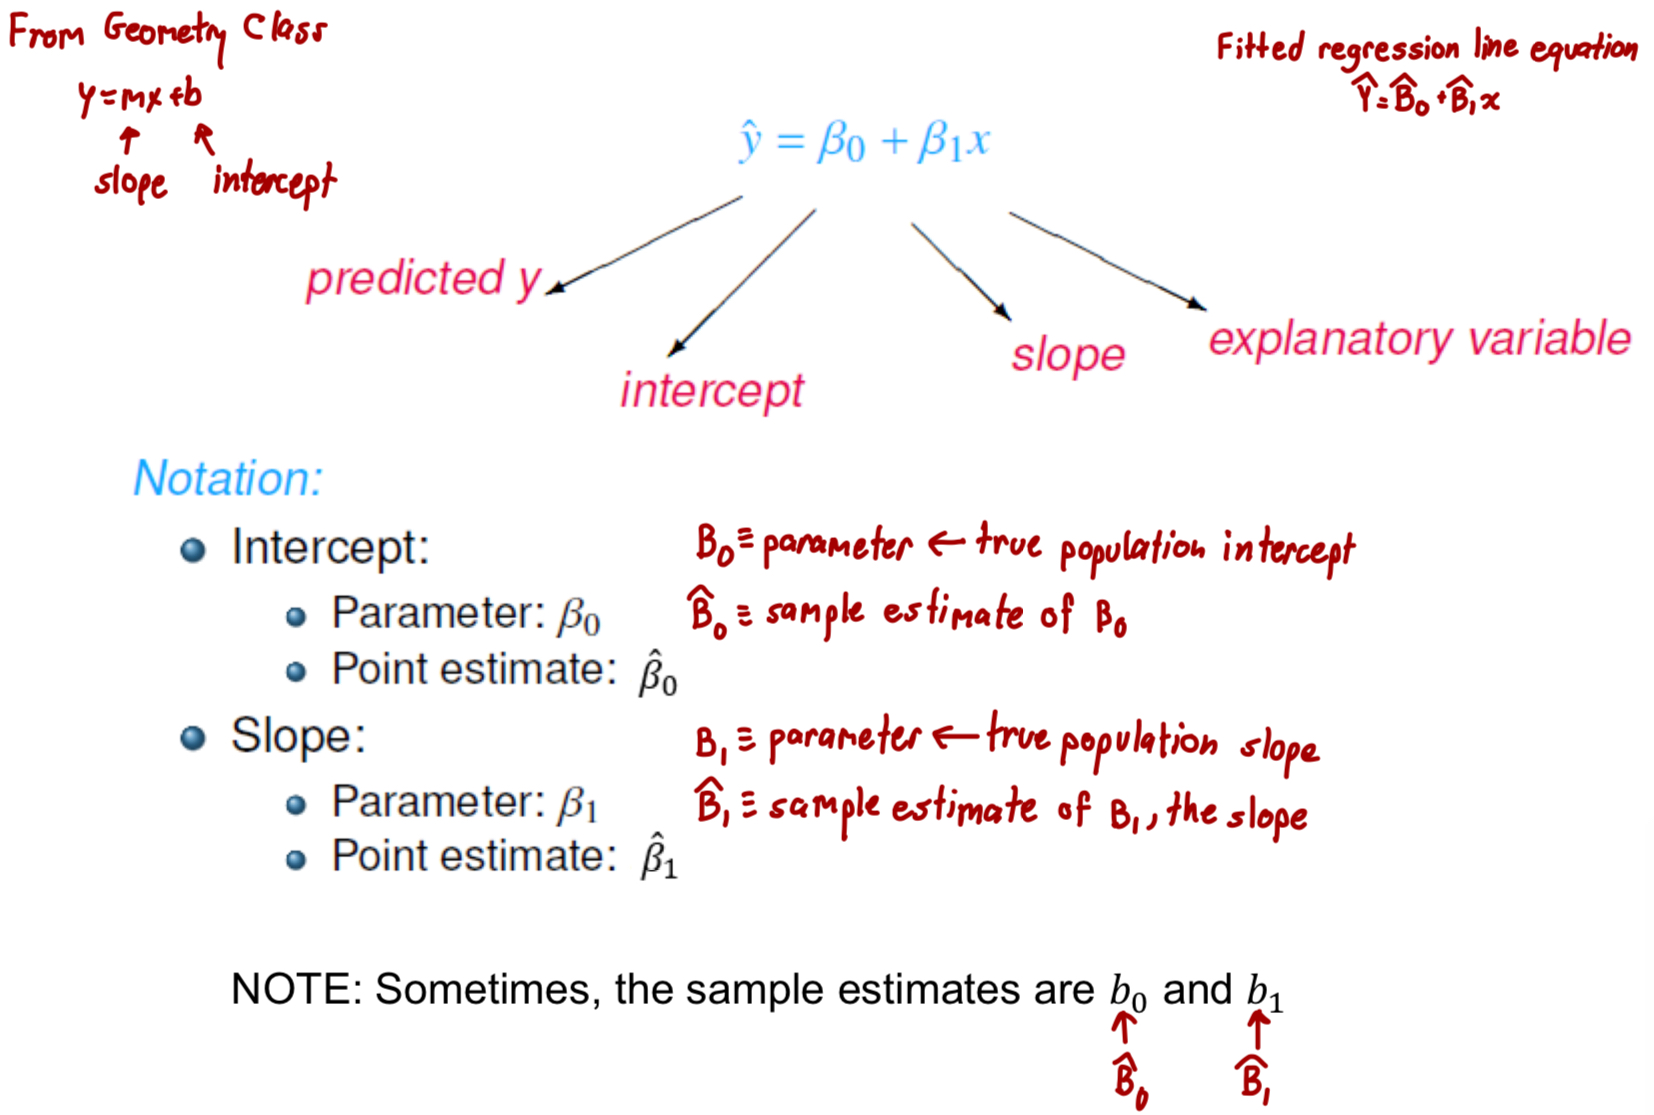
Interpret intercept and slope
Intercept: when x=0, y is expected to equal the intercept
Slope: for each unit in x, y is expeted to increase/decrease on average by the slope
General form for slope interpretation
A 1 unit increase in “x-variable” is associated with a “slope” change (increase or decrease) in “y-variable”
What are the assumptions for the least squares line?
Linearity
Nearly normal residuals
Constant variability
We can check these conditions by looking at residual plots
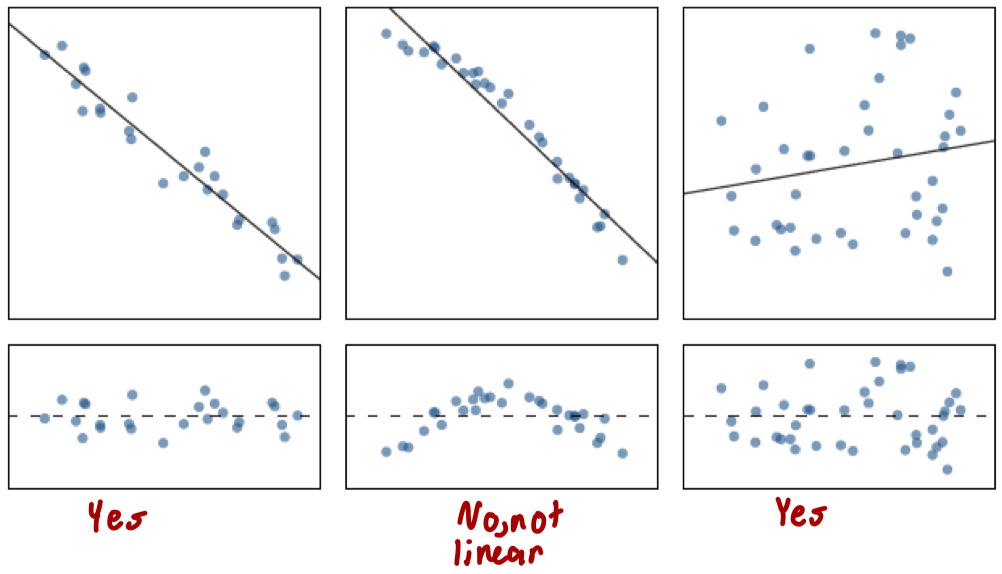
What is linearity and how do we check for it?
The relationship between the explanatory and the response variable should be linear
Check using a scatterplot of the data, or a residuals plot
Residual plot should look like an elliptical cloud of points
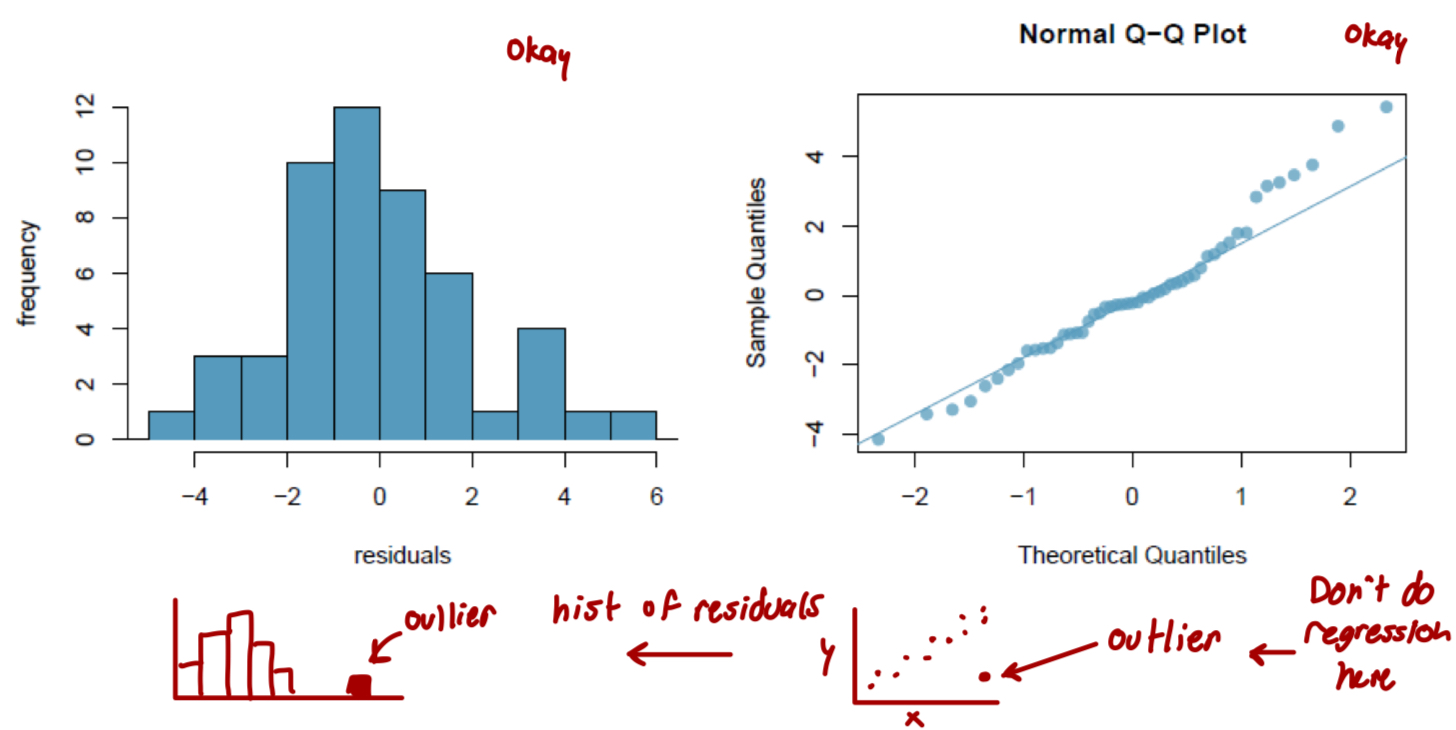
What is nearly normal residuals and how do we check for it?
The residuals should be nearly normal
This condition may not be satisfied when there are unusual observations that don’t follow the trend of the rest of the data
Check using a histogram or normal probability plot of residuals
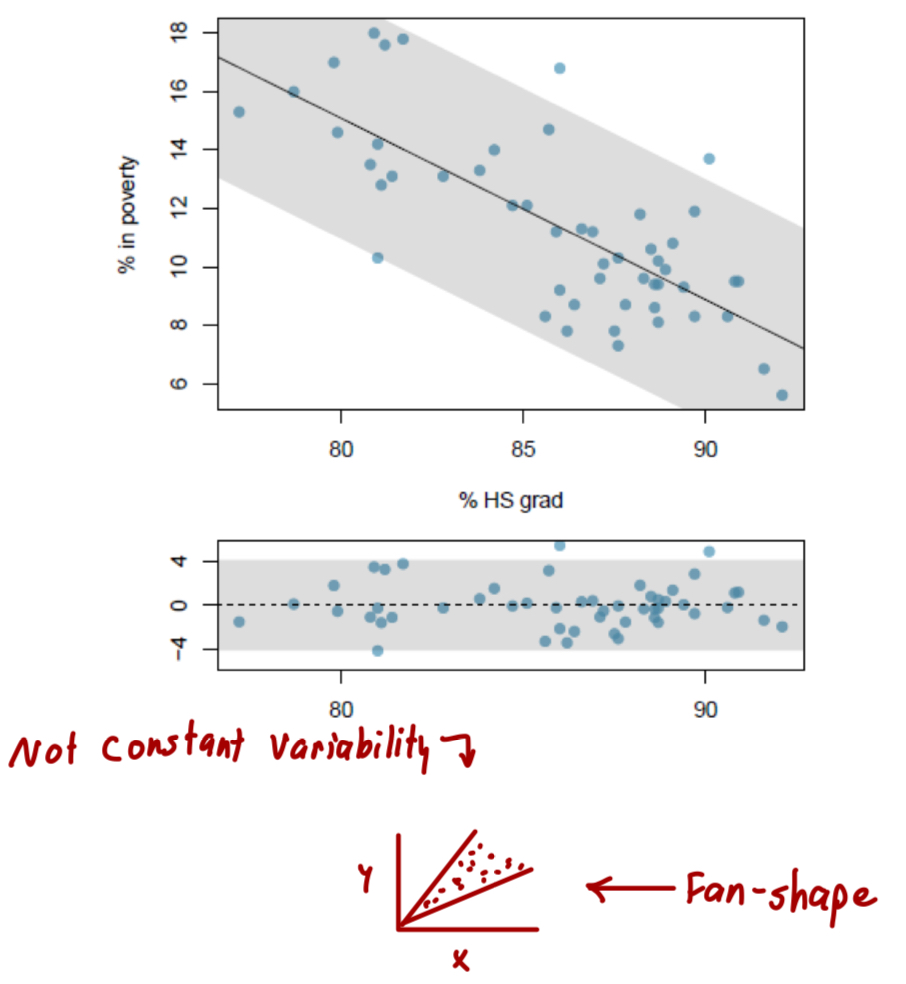
What is constant variability and how do we check for it?
The variability of points around at least squares line should be roughly constant
This implies that the variability of residuals around the 0 line should be roughly constant as well
Also called homoscedasticity
Check using a histogram or normal probability plot of residuals
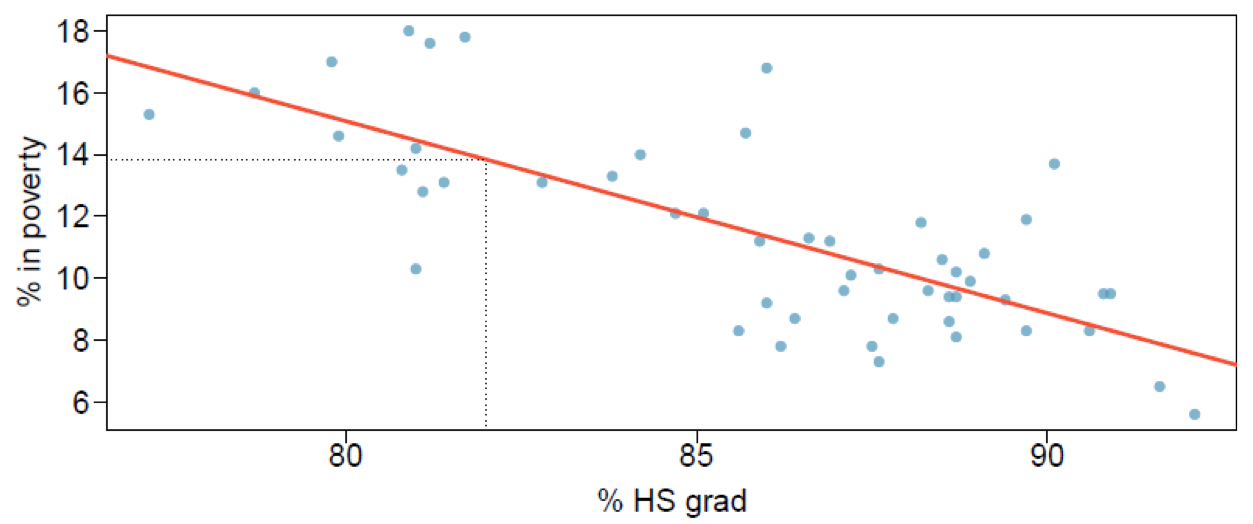
What is prediction? Will there be some uncertainty associated with the predicted value?
Using the linear model to predict the value of the response variable for a given value of the explanatory variable is called prediction, simply by plugging in the value of x in the linear model equation
There will be some uncertainty associated with the predicted value
Correlation vs slope
Slope: how steep
Correlation: how tightly the points cluster around a prediction line
How do we determine how strong the linear relationship between X and Y is?
Use the summary statistic, R2 (correlation coefficient)
What is R2? How is R2 calculated as? What does R2 tell us? What is the remainder of the variability explained by?
The strength of the fit of a linear model is most commonly evaluated using R2
R2 is calculated as the square of the correlation coefficient
It tells us what percent of variability in the response variable is explained by the model, or by the predictor variable
The remainder of the variability is explained by variables not included in the model or by inherent randomness in the data
General conclusion for R2
With R2= __, this implies that __x100% of the variability in “y-variable name” is explained by “x-variable name”
If high, then strong relationship
What is extrapolation? What might the intercept sometimes be?
Applying a model estimate to values outside of the realm of the original data is called extrapolation
Sometimes the intercept might be an extrapolation
Define extrapolation. What do you need to be aware of with extrapolation?
Definition: prediction made beyond the range of values in the data
Beware: predictions are only valid within the range of values of the predictor variable that were used to fit the model
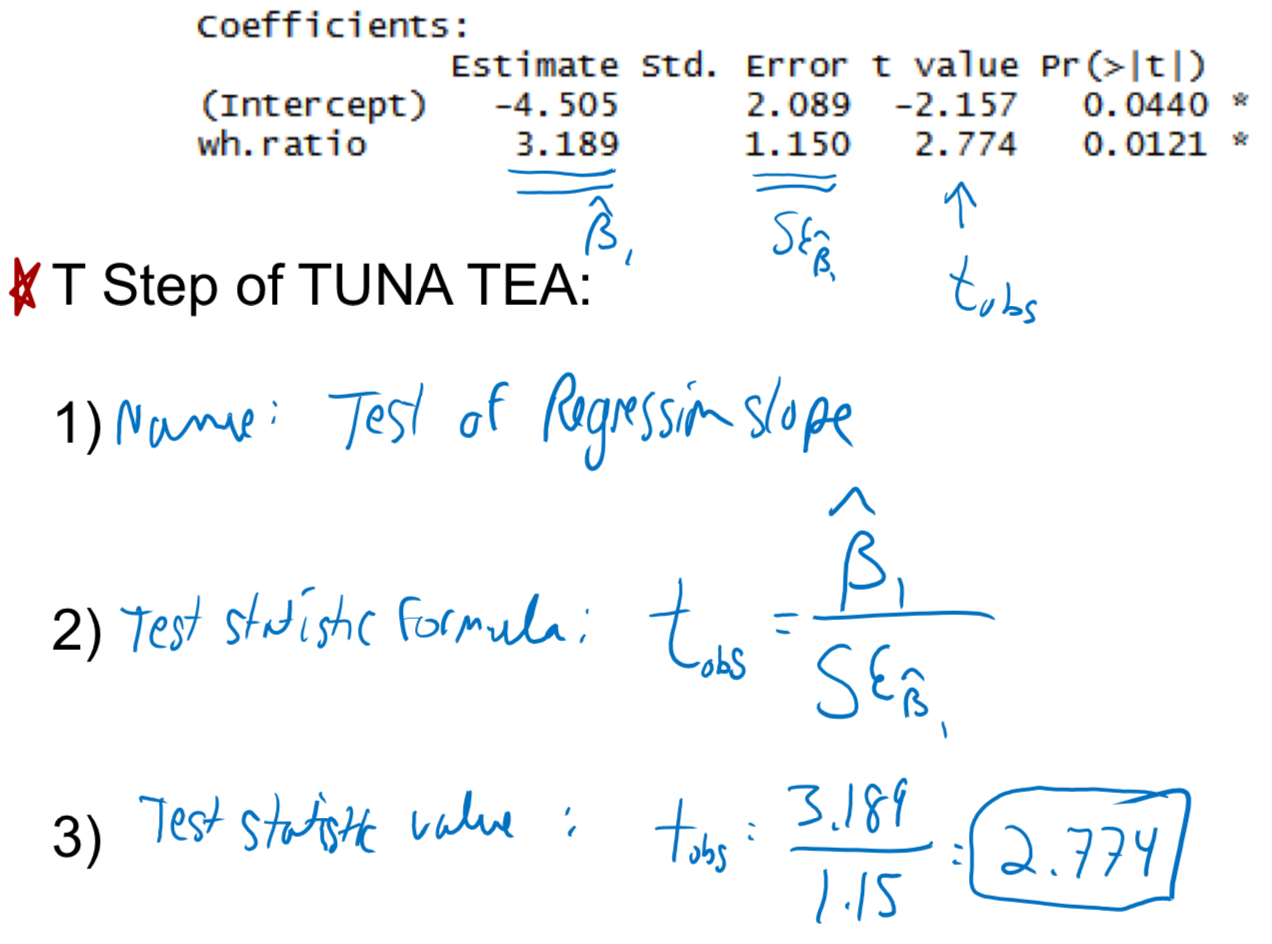
Why should we conduct a hypothesis test of the slope parameter?
Goal: Assess whether or not a predictor is “good” at predicting an outcome or not
This is a test of predictor variable’s coefficient
What is the null and alternative hypotheses for test of regression slope?
H0: ___ is not a good predictor of ___ (B1 = 0)
HA: ___ is a good predictor of ___ (B1 ≠ 0)
T Step of TUNA TEA for test of regression slope
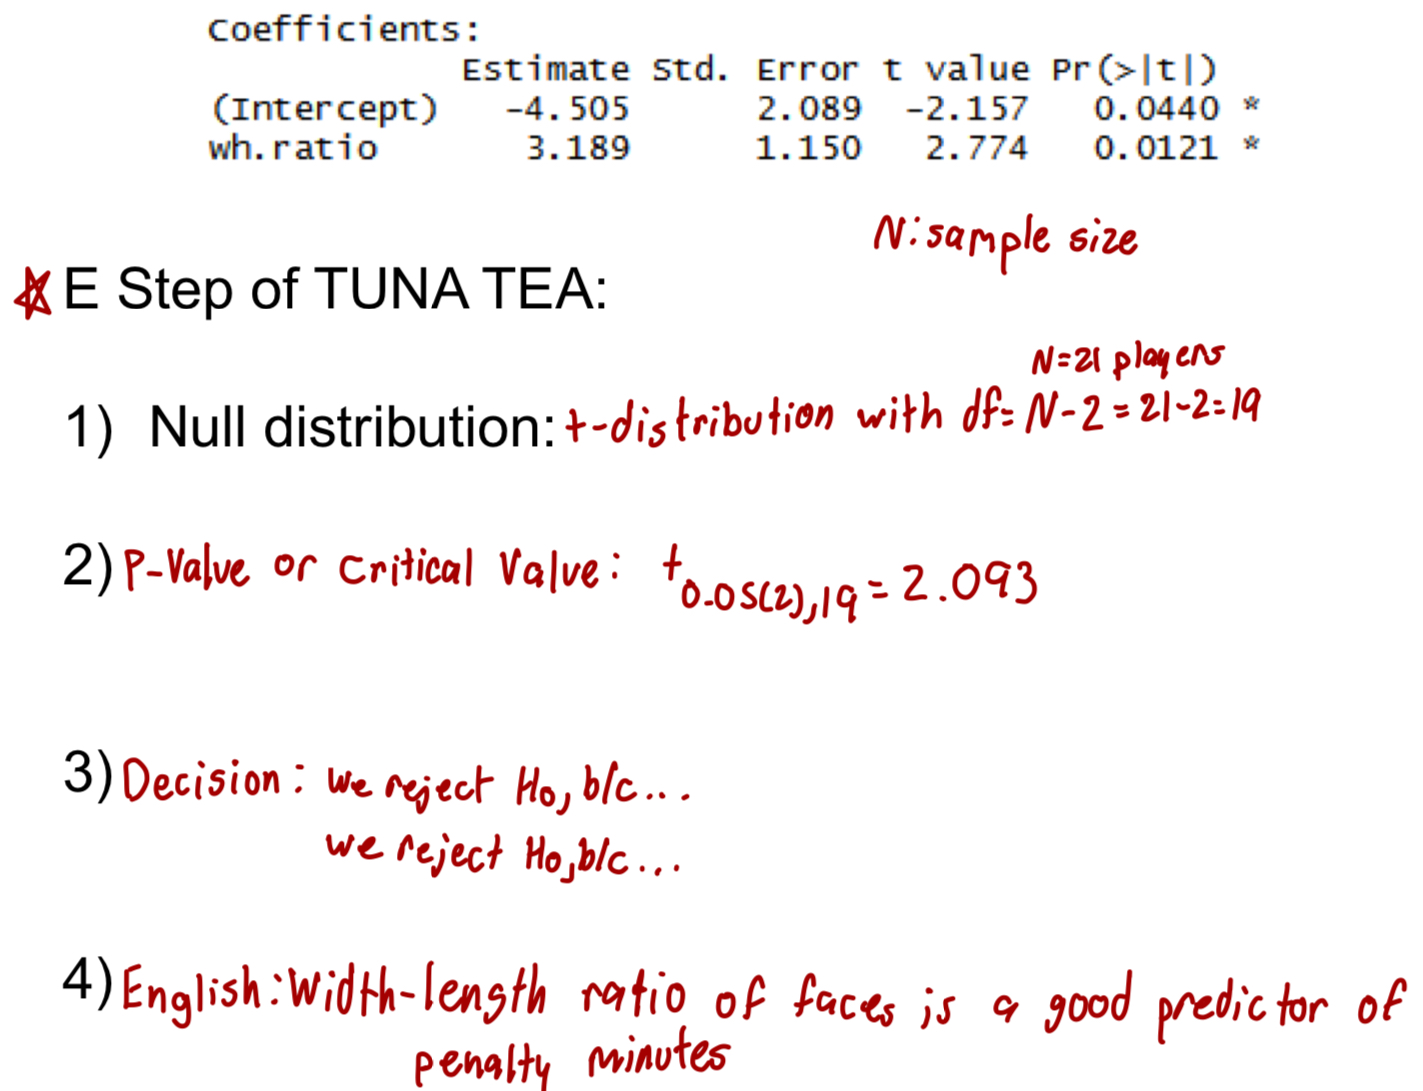
E Step of TUNA TEA for regression slope
What is the p-value and critical level R-codes for regression slope?
P-Value: 2(1-pt(t-stat, df))
Critical Value: qt((1-(a/2)), df)
What does linear regression describe? What can it be used to determine? How many variables can it have? What does the slope of the regression line indicate?
Linear regression describes the straight-line relationship between two variables with an equation
Linear regression can be used to determine if one variable is a good predictor of another
Linear regression can have two variables with a relationship that is strong or weak and is described by R2
The slope of the regression line indicates the expected change in Y for a one-unit increase in X
Whats an easy way to check if the linear regression assumptions hold true?
Check if the residual plot have elliptical cloud shape
What can observational studies only find?
Can only find correlations between variables
What does randomization help establish?
Randomization helps establish causality
What are confounding variables?
Unmeasured variable that changes in tandem with one or more measured variable…Gives a false appearance of a casual relationship between the measured variables
How can you assess the relationship between variables and account for (or control for) confounders?
Experiments and randomization (for confounders you might not know about)
Blocking or stratifying of the confounders you know about
What is blocking? What is it used for?
Grouping of experimental units that have similar properties; within each group, different treatments are applied to different units
Used to control for qualities that might or are known to affect outcome
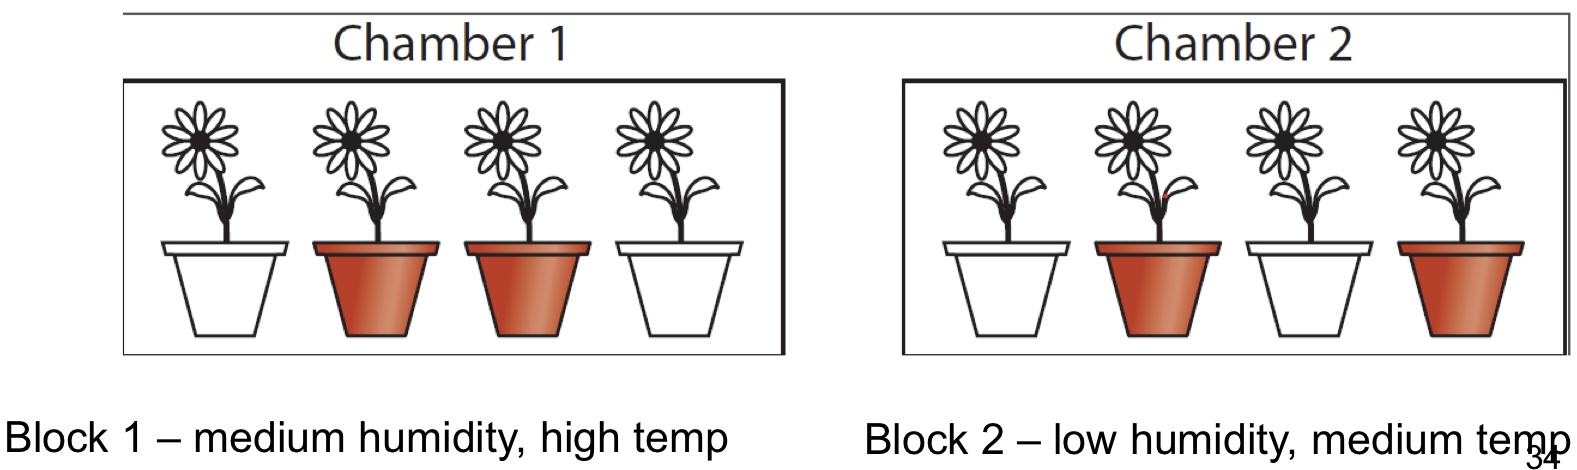
Ex: test of fertilizer (yes or no) on plant growth. Humidity and temperature are known to affect plant growth. Thus → do blocking by greenhouse. Randomize to treatment within greenhouse
How do you choose a blocking variable?
Choose a blocking variable that is known or suspected to have an effect on outcome. We “control” for this variable by “blocking”
Ex: Greenhouses: Plant growth can be a function of environmental factors such as temperature humidity
Block 1: medium humidity, high temperature
Block 2: low humidity, medium temperature
After blocking, randomize to treatment within the blocks
What are the 7 good design features of expeirments?
Eliminate bias:
Controls
Random assignment to treatments
Blinding
Random sample (or correct re-weighting)
Reduce sampling error (increase precision and power)
Replicates (sufficient sample size)
Balance
Blocking
Is the control group different from the experimental treatment group? What treatment does the control group receive? What is the importance of controls?
A control group is approximately the same as the treatment group in all respects aside from the treatment itself
The control receives the “standard treatment”. Could be no treatment or existing treatment
Ex: sugar pills = “placebo”
Importance of controls: need to see what happens with no treatment - may get better by itself (depression, pain, ear infections)
What is randomization?
The random assignment of treatments to units in an experimental study
Ex: Assignment to a week of 8-hour sleep nights vs. 6-hour sleep nights
This does not mean random sample
What is the most important aspect of study design? What are the best medical studies? What does randomization control for?
Random assignment is the most important aspect of study design
Best medical studies are “controlled clinical trials”, which by definition, involve randomization of subjects to treatment groups
Randomization averages out - “controls for” the effects of confounding variables
What is blinding? What do unblinded studies find much larger of? What is single, double, and triple blind?
Process of concealing information from participants (and sometimes including researchers) about which subjects receive which treatment
Unblinded studies find much larger effects (sometimes threefold higher), showing the bias that results from lack of blinding
Single vs double vs triple blind
Single: patient doesn’t know treatment group
Double: neither patient or medical providers know treatment group
Triple: neither patients, medical staff, or researchers know treatment group
What is random sampling? is this hard to achieve?
Process of choosing individuals at random and independently from a population
This can be hard to judge or achieve. Elements of volunteer bias may occur
What are replicates?
Carry out study on multiple independent objects
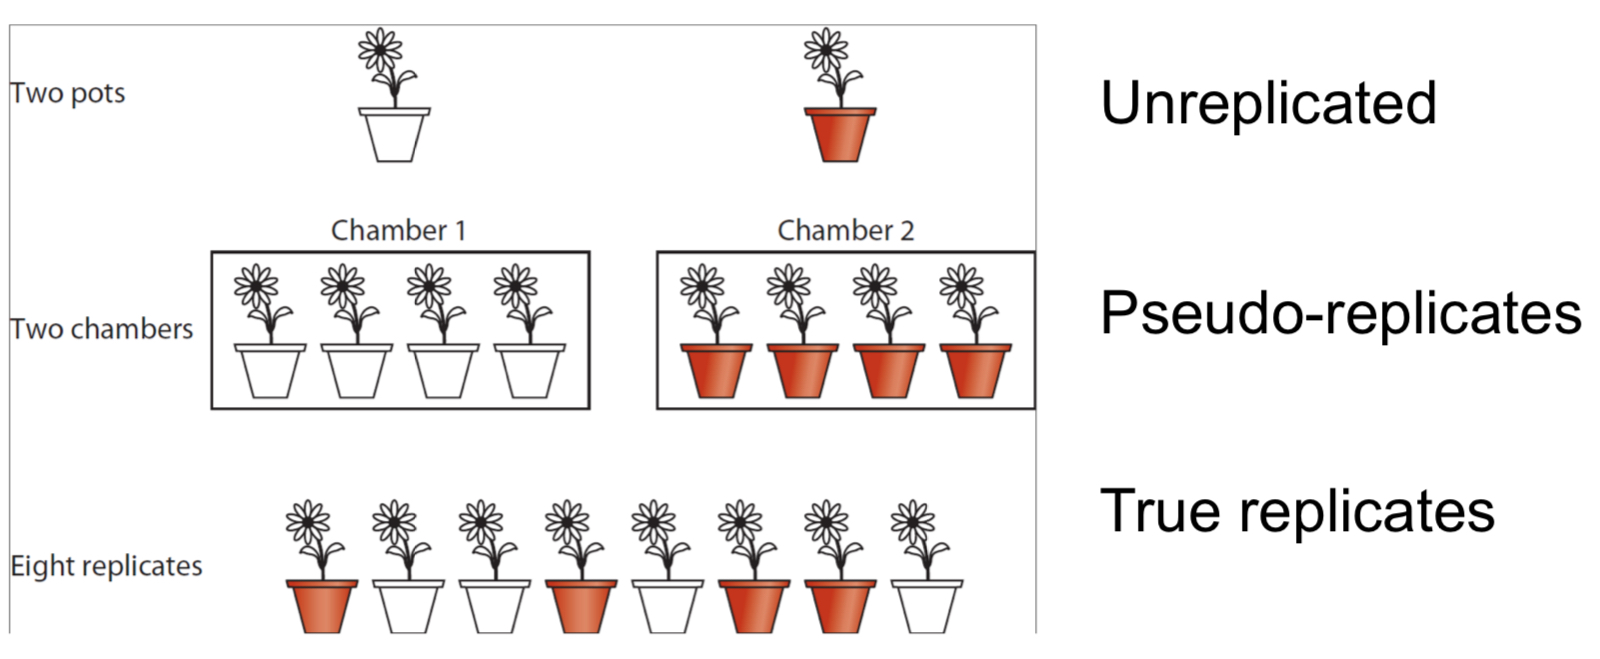
In replicates, does every treatment group have only one individual?
Every treatment group must have more than one individual
True replicates are multiple independent units in the experiment in each group
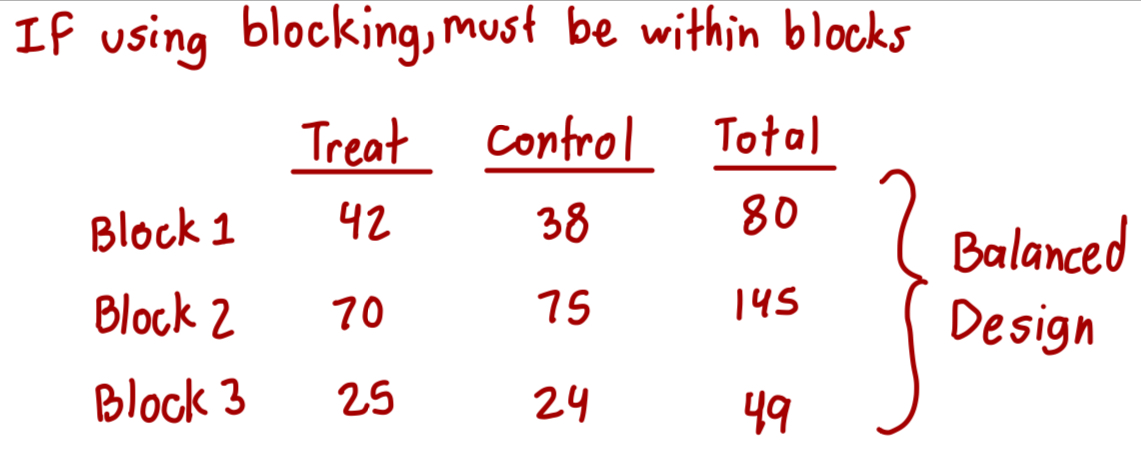
What does balance refer to? What do all the treatments have? What does being balanced reduce? What if your using blocking?
Nearly equal sample sizes in each treatment
In a balanced experiment design, all treatments have about equal size - within 10%
If using blocking, must be within blocks
When are results generalizable to a larger population?
Yes: if you have drawn a random sample from the larger population
No: if your sample is not from the larger population
When do results indicate a cause-effect relationship?
Yes: if you have randomized individuals to the different treatment arms
No: if your study does not include randomization to treatment