Normal Distributions and Bivariate Data
1/38
There's no tags or description
Looks like no tags are added yet.
Name | Mastery | Learn | Test | Matching | Spaced | Call with Kai |
|---|
No analytics yet
Send a link to your students to track their progress
39 Terms
bivariate data
Data with two variables, or pairs of numerical observations.
Correlation
A measure of the extent to which two factors vary together, and thus of how well either factor predicts the other.
positive correlation
A correlation where as one variable increases, the other also increases, or as one decreases so does the other. Both variables move in the same direction.
negative correlation
One variable increases while the other decreases.
explanatory variable
A variable that helps explain or influences changes in a response variable (independent variable)
response variable
A variable that measures an outcome of a study (dependent variable)
correlation coefficient
a statistical index of the relationship between two things (from -1 to +1)
Strong r value
closer to 1 or -1
Weak r value
close to 0
coefficient of determination
r^2
What does the coefficient of determination tell you
The percent of the variability in y (response variable) that can be explained by x (the independent variable)
Correlation does NOT imply
causation
What signifies a prediction in a word problem?
A hat ^
Analysis of regression equation
Predicted response variable = slope (coefficient for explanatory variable) + constant
Residual
Margin of error
residual equation
observed y - predicted y
How to find observed y
Find point on scatter plot
How to find predicted y
Plug in x value into y=mx+b
Sum of residuals should always be
0
If a point is above the trend line
It has a positive residual AND the point has been underestimated
If a point is below the trend line
It has a negative residual AND the point has been overestimated
Three Types of Correlation relationships
Causal relationship, common response relationship, confounding relationship
Causal Relationship
Changing x CAUSES y to change. The only way to show causation is through a controlled designed experiment.
Common response relationship
Both x and y respond to changes in a third lurking variable.
Example of a common response relationship
Spelling ability rises as shoe size increases. The lurking variable here is age.
Confounding relationship
A confounded relationship occurs when we can't separate the effects of multiple explanatory (x) variables
Example of a confounding relationship
Someone has calf pain, and after some practices, the pain decreases. We cannot say what explanatory variable actually worked, because the person stretched, decreased running mileage, and bought new shoes.
What does the y intercept or "constant" represent in regression analysis
The predicted value of y when all x variables in the model are equal to 0
Hopelessly confounded variables
X variables that cannot be separated (in a confounding relationship)
What does the line of best fit do?
The line of best fit minimizes the sum of the squared residuals
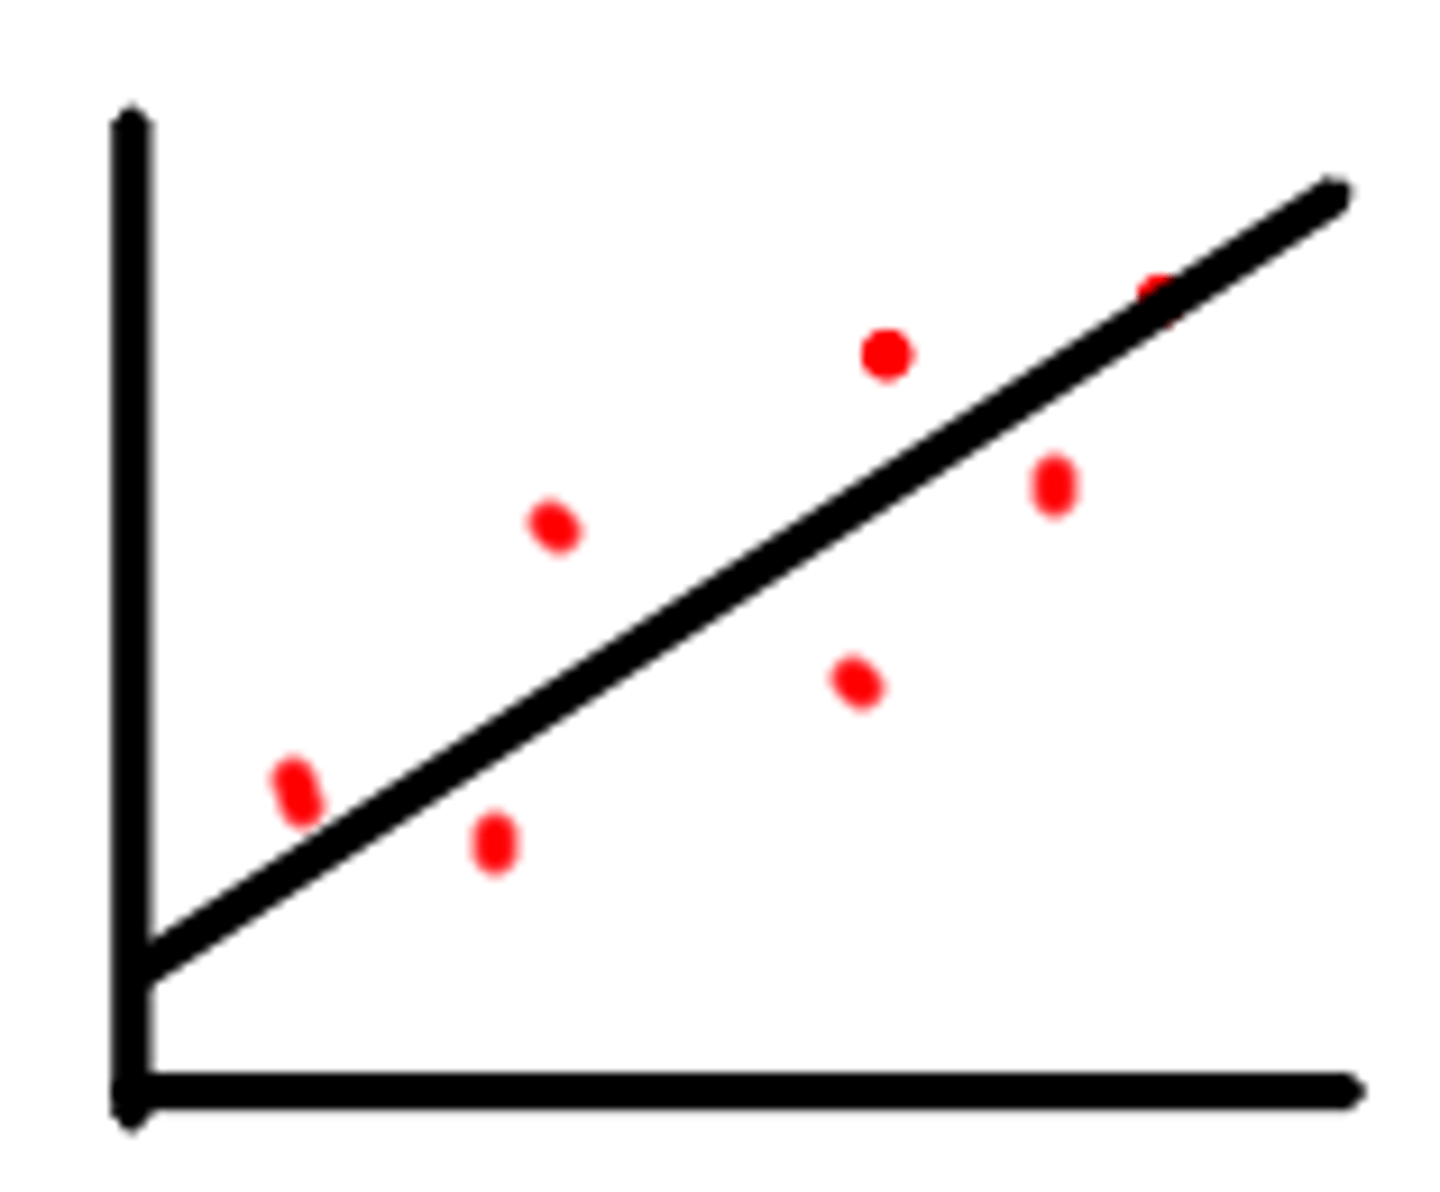
Least squares regression line
Line of best fit
influential observation
The most influential observations or points on a graph are points that are extreme in their x-value
How to interpret a residual plot
For a residual plot, you always want small residuals, and they should be randomly scattered above and below the trendline
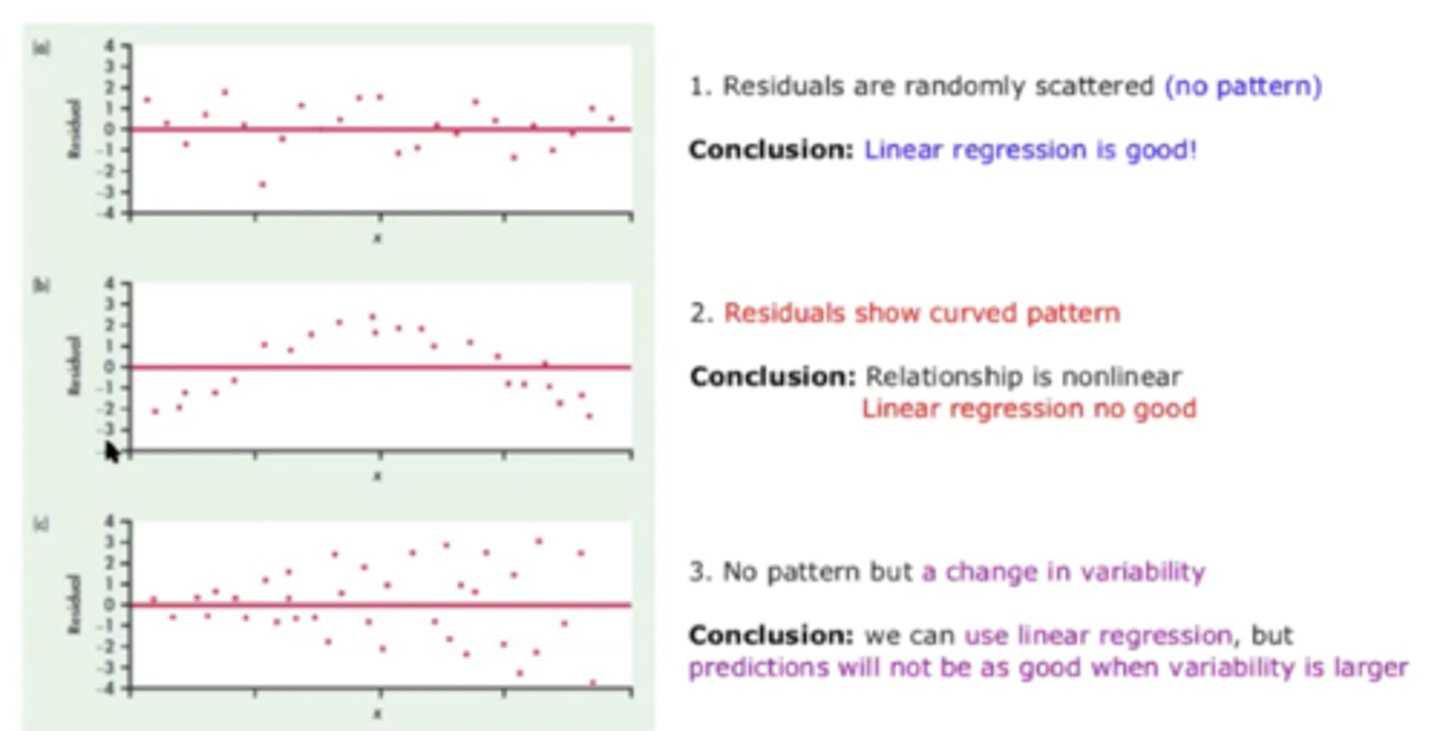
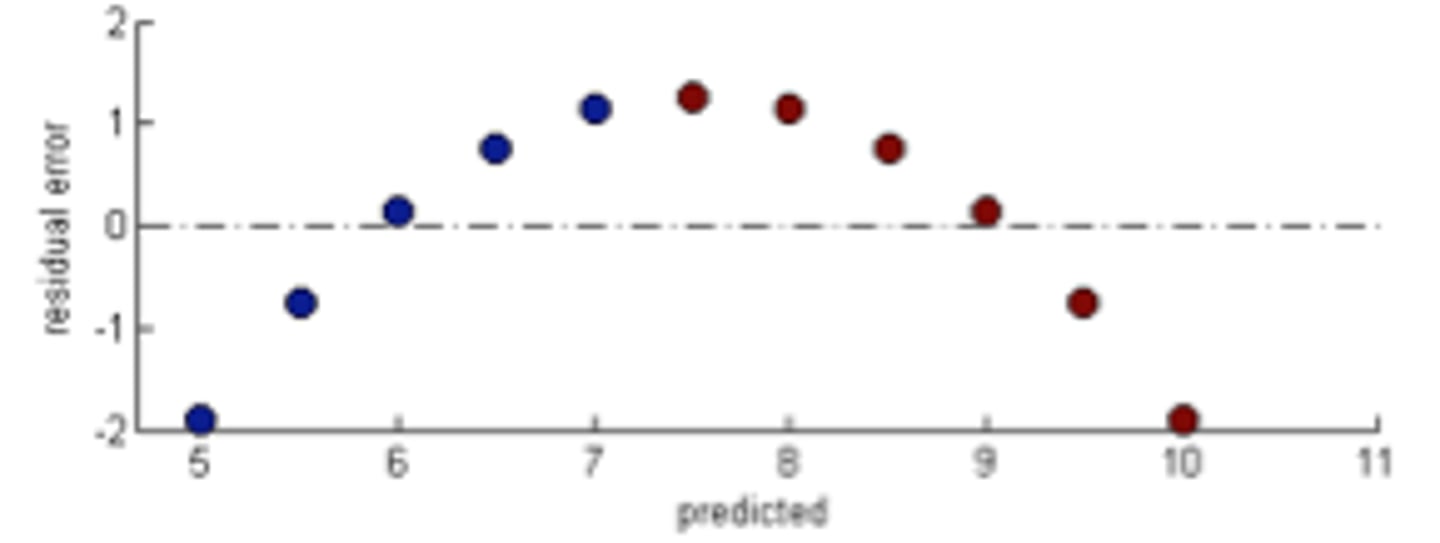
What does it mean if you see a pattern in your residual plot?
Another model is better
How to build a non-linear regression model
Transform the response variable using a mathmatical function, and then run a linear regression on the transformed data
Cubic regression model example
Take the cube root of the response (y) variables to shift data. Now your predicted y is the cube root of y instead of regular y. So, when predicting a specific point, make sure to cube both sides.
extrapolation
Estimating a value outside the range of measured data.
Can a r value go above 1 or below -1
No
How to find the slope with r
r (sy/sx)