Vectors and Raster's
1/25
There's no tags or description
Looks like no tags are added yet.
Name | Mastery | Learn | Test | Matching | Spaced |
|---|
No study sessions yet.
26 Terms
Spatial entity
A spatial entity is a representation of the real world
entities are the object
What are the problems with spatial entities
Scale: how the real world is modelled depends on the scale of the modelling (generalisation)
Dynamics: the world is not static, rivers flood, cities expand- things are always changing
Fuzziness problem: no distinct boundary, think trees in a forest coming to an end
Purpose: how to represent the real world depends on the purpose of the entity data
Can a curved line exist in GIS?
No
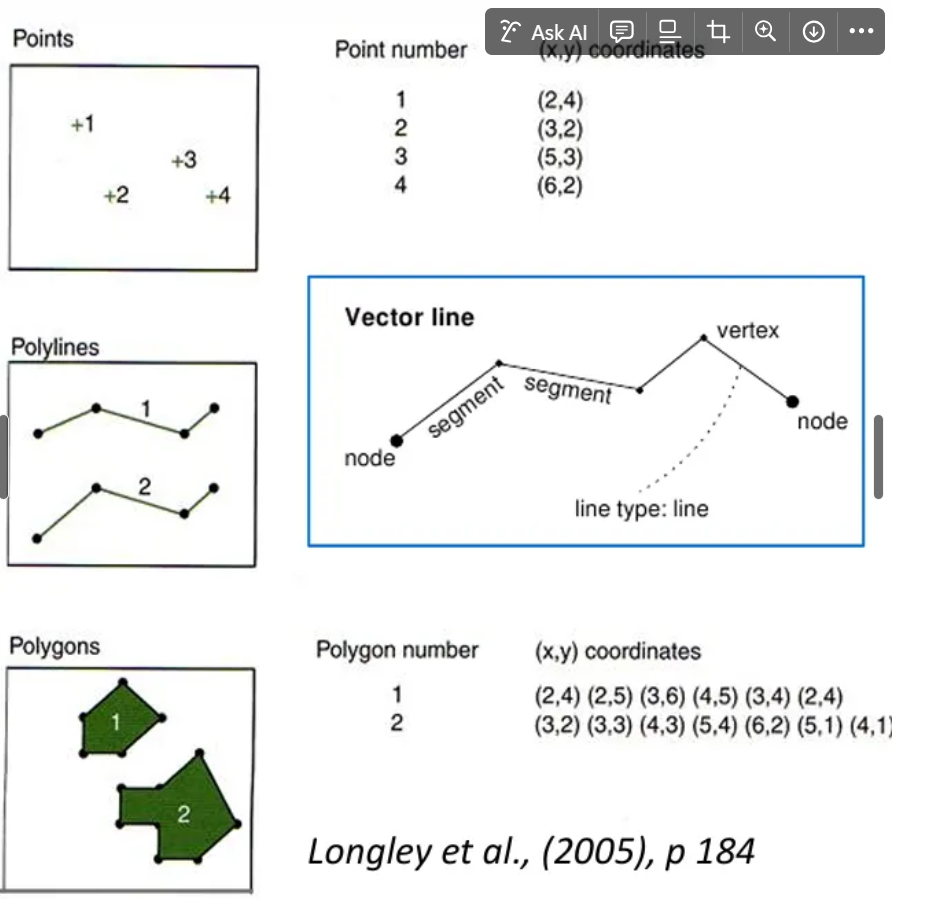
How are vector ‘lines’ created?
From joining up two coordinate points
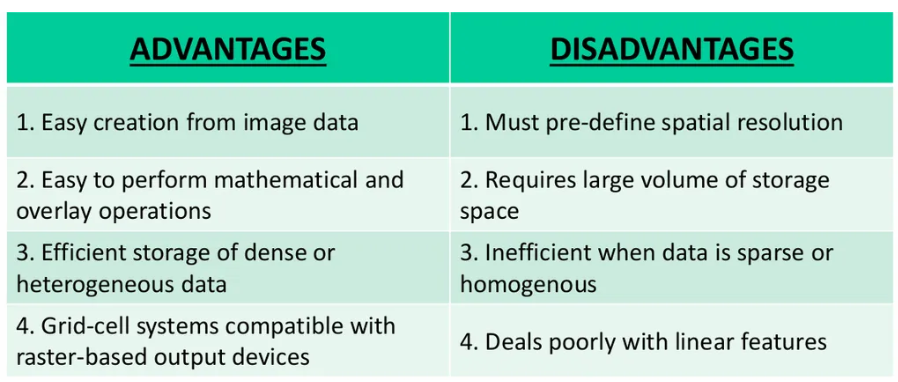
How does rasters represent the world?
the surface of the world is divided into a grid of cells with different values
Discrete raster
raster that represent phenomena that have clear boundaries with attributes that are descriptions, classes, or categories. Generally, (but not always) integers are used for the cell values. It is assumed that the phenomena that each value represents fill the entire area of the cell. eg, land-cover
Continious raster
Raster in which cell values vary continuously to form a surface. Values exist on ascale relative to each other. It is assumed that the value assigned to each cell is what is found at the centre of the cell. eg, elevation, rainfall, temperature
gradual change, things closer together are more likely to be related
Examples of single bands (RASTER)
SINGLE BAND
▪ TIFFs, IMGs ▪ Remotely Sensed Data ▪ Spectral Data
-Digital elevation model, attribute of every cell is always the elevation
Example of multiple bands (RASTER)
MULTIPLE BAND
▪ Elevation Data ▪ Grayscale aerial imagery ▪ Scanned maps / documents
What is a node?
Location of each vertex coordinate
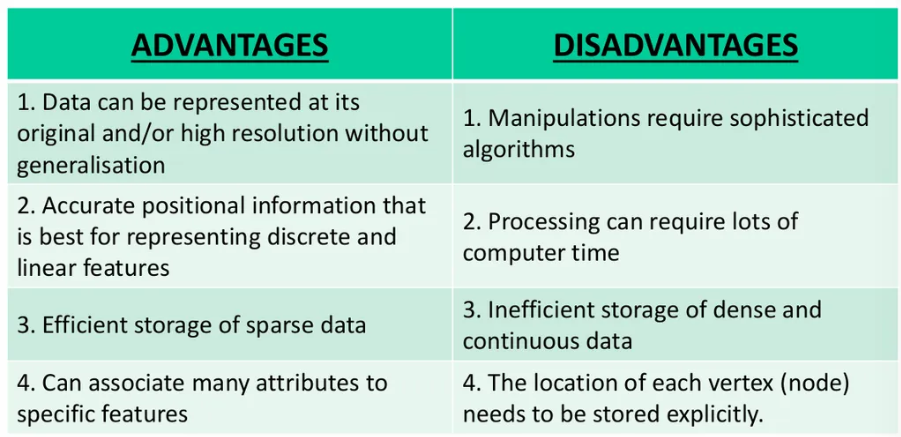
Vector data model
A representation of the world using points, lines, and polygons (area). Vector models are useful for storing data that has discrete boundaries, such as country borders, land parcels, and streets.
Basic types (VECTOR)
▪ Points ▪ Lines or ‘Polylines’ ▪ Area or ‘Polygons’
First and last are the same
Extended types (VECTOR)
▪ Surfaces ▪ Networks
Surface map
Types of vector data
Attribute tables, raster vs vector
in raster everything on the screen is in the attribute table (doesn’t have that flexibility) in vector it is linked to an attribute table, every layer is a point in a table
Arc-node topology
Line features can share endpoints
Region topology
Area features can overlap with other features
Polygon topology
Area feature can share boundaries
Node topology
line features can share endpoint vertices with point features
Route topology
Area features can share segments with other line features
Point events
point features can share vertices with line features
What will points connected create in vectors?
Triangles - Delaunay triangles, in a Voronoi cell
What is TIN
Triangular irregular networks
Identifies spatial relationship between spatial entities
▪ Well suited for adjacency and connectivity analyses
▪ Reduces data redundancy (all the data are useful)
▪ Allocates IDs to polygons
NOTE Digital Elevation Models (DEMs) in a TIN format have advantages over DEMs in raster format (e.g. memory allocation and speed)
harder to use
Problems with converting vectors/rasters
converting may not be accurate
Hanging nodes may arise through automation errors
Recap Raster table
Recap vector table