Chapter 4 (Presenting information)
1/7
There's no tags or description
Looks like no tags are added yet.
Name | Mastery | Learn | Test | Matching | Spaced | Call with Kai |
|---|
No analytics yet
Send a link to your students to track their progress
8 Terms
Main feature of a report
Title page
Contents
Terms of Refererence, the objective of the report, who asked for it and why? who supplied the information and whether it has been reviewed/audited.
Executive summary
The body of the report
Appendices
A good report should:
Be clearly set out and follow a logical order
Be easy to follow and interesting to read
Be as short and simple as possible
Contain clear conclusions and recommendations
Data visualization
The presentation of data and information using visual techniques (graphs, pies, visuals and dashboards etc.)
Principles of good tabulation
Use headings and, if appropriate, state source.
State the unit of measurement.
Secondary statistics, such as percentages, can be incorporated
Where relevant, insert column and/or row totals.
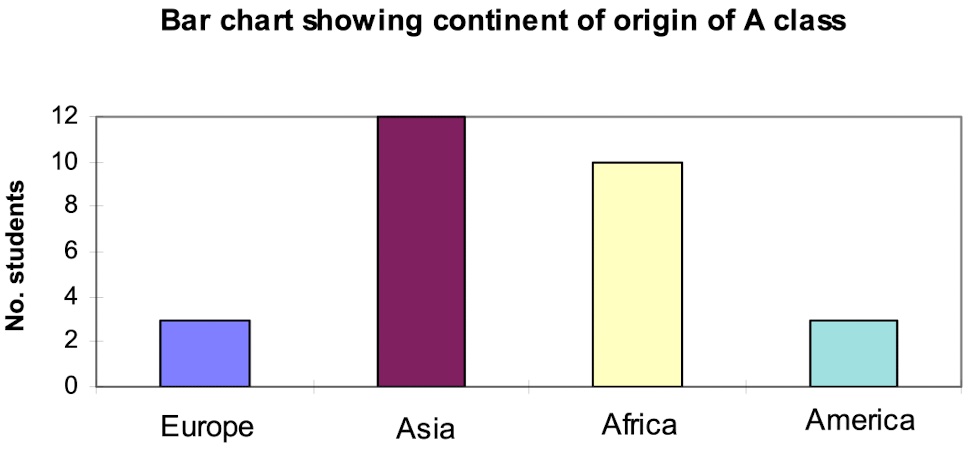
Bar chart (bar graph)
A chart with rectangular bars with lengths proportional to the values that they represent.
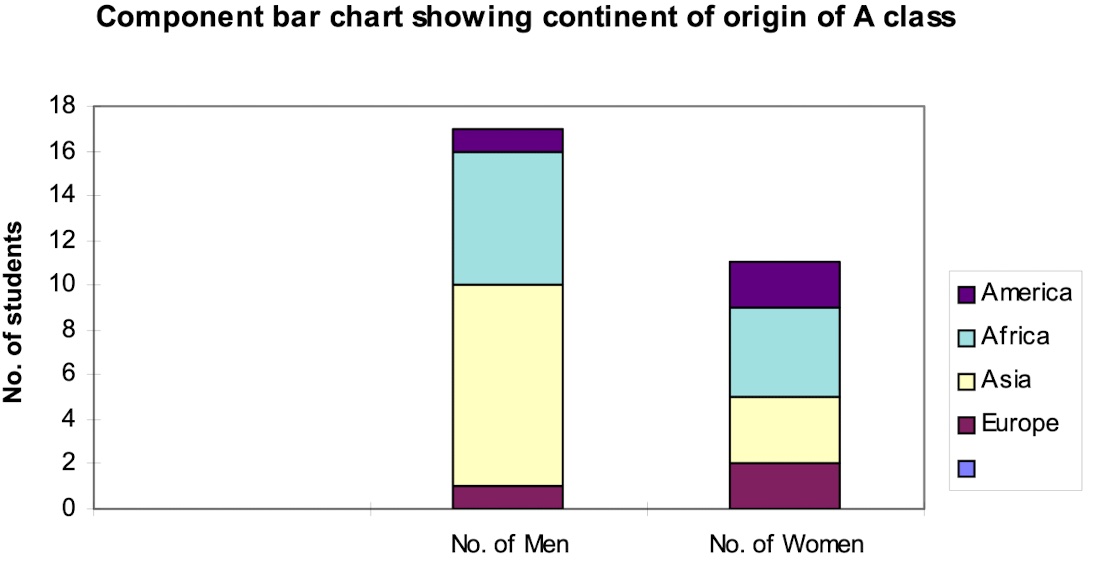
Component bar chart
A chart where the bars are divided into component parts. The height (or length) of each component indicates the size of the number represented.
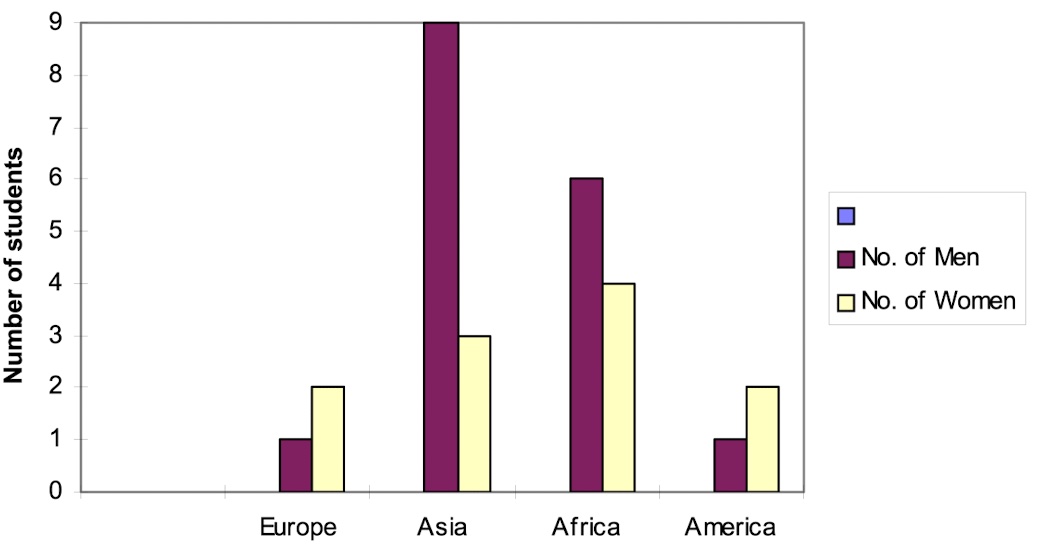
Multiple bar chart
A chart where the components are shown as separate
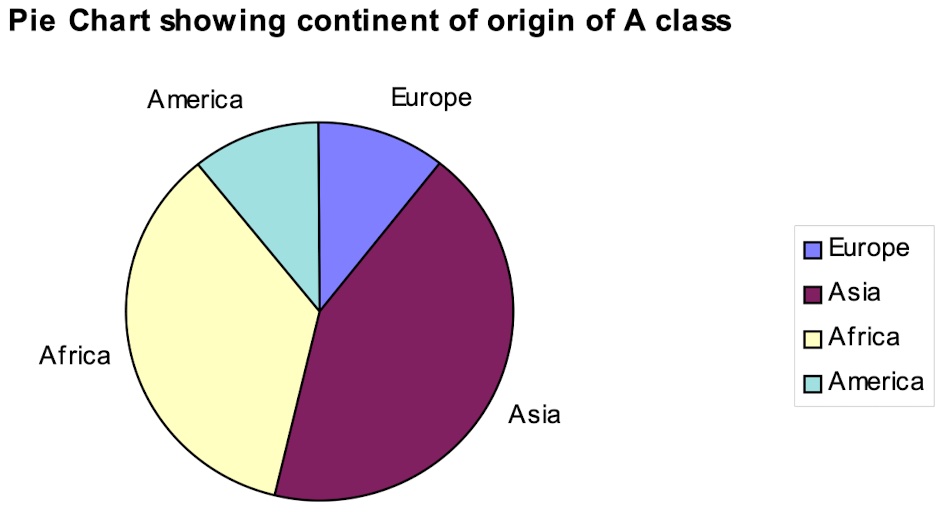
Pie chart
A circular chart divided into sectors. The size of each sector is proportional to the quantity it represents.