1.1 - Monomers and polymers + 1.2 - Carbohydrates
5.0(1)
Card Sorting
1/22
Study Analytics
Name | Mastery | Learn | Test | Matching | Spaced |
|---|
No study sessions yet.
23 Terms
1
New cards
What is a monomer?
smaller units that join together to form larger molecules
2
New cards
3 examples of monomers.
monosaccharides, amino acids, nucleotides
3
New cards
What is a polymer?
molecules formed when many monomers join together
4
New cards
3 examples of polymers.
polysaccharides, proteins, DNA
5
New cards
Describe a condensation reaction.
a chemical bond forms between 2 molecules & a molecule of water is produced.
6
New cards
What happens in a hydrolysis reaction?
a water molecule is used to break a chemical bond between 2 molecules.
7
New cards
Name 3 hexose monosaccharides
glucose, fructose, galactose
8
New cards
What type of bond forms when monosaccharides react?
(1-4 or 1-6) glycosidic bond
9
New cards
Name 3 disaccharides, and the monosaccharides which make them up
maltose: glucose + glucose
sucrose: glucose + fructose
lactose: glucose + galactose
sucrose: glucose + fructose
lactose: glucose + galactose
10
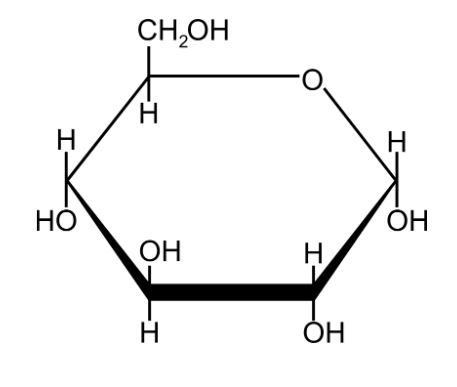
New cards
Draw the structure of a - glucose
11
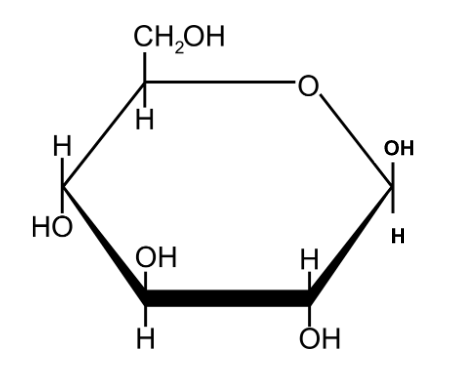
New cards
Draw the structure of b - glucose
12
New cards
Describe the function and properties of starch
storage of a - glucose in plant cells
- insoluble so does not affect the water potential of the cell
- large does not diffuse out of cells
- insoluble so does not affect the water potential of the cell
- large does not diffuse out of cells
13
New cards
Describe the structure of amylose
1-4 glycosidic bonds
helix with intermolecular H-bonds = compact
helix with intermolecular H-bonds = compact
14
New cards
Describe the structure of amylopectin
1-4 & 1-6 glycosidic bonds
branched - many terminal ends for hydrolysis into glucose
branched - many terminal ends for hydrolysis into glucose
15
New cards
Describe the function of glycogen
main storage polymer of a - glucose in animal cells (but also in plant cells)
16
New cards
describe the structure of glycogen
- 1-4 & 1-6 glycosidic bonds
- branched = many terminal ends for hydrolysis
- insoluble = doesn't affect the water potential & does not diffuse out of the cell
- compact
- branched = many terminal ends for hydrolysis
- insoluble = doesn't affect the water potential & does not diffuse out of the cell
- compact
17
New cards
Function of cellulose
gives rigidity to plant cell walls (prevents bursting under turgor pressure, holds stem up)
18
New cards
Structure of cellulose
- 1,4 glycosidic bonds
- straight chain, unbranched molecule
- alternate glucose molecules are rotated 180 degrees
- H-bond crosslinks between parallel strands form microfibrils = high tensile strength
- straight chain, unbranched molecule
- alternate glucose molecules are rotated 180 degrees
- H-bond crosslinks between parallel strands form microfibrils = high tensile strength
19
New cards
Describe the Benedict's test for reducing sugars
1. add an equal volume of Benedict's reagent to a sample
2. heat the mixture in a water bath containing boiling water for 5 minutes
3. Positive result: colour change from blue to orange/red precipitate forms
2. heat the mixture in a water bath containing boiling water for 5 minutes
3. Positive result: colour change from blue to orange/red precipitate forms
20
New cards
Describe the Benedict's test for non-reducing sugars
1. Negative result: Benedict's reagent remains blue
2. Hydrolyse non-reducing sugars e.g. sucrose into their monomers by adding 1cm cubed of HCL. heat in a boiling water bath for 5 minutes.
3. Neutralise the mixture using sodium carbonate solution.
4. Then carry out the Benedict's test as usual.
2. Hydrolyse non-reducing sugars e.g. sucrose into their monomers by adding 1cm cubed of HCL. heat in a boiling water bath for 5 minutes.
3. Neutralise the mixture using sodium carbonate solution.
4. Then carry out the Benedict's test as usual.
21
New cards
Describe the test for Starch
1. Add iodine solution
2. Positive result: colour change from orange to blue-black
2. Positive result: colour change from orange to blue-black
22
New cards
Outline how colorimetry could be used to give qualitative results for the presence of sugars and starch
1. make standard solutions with known concentrations. Record absorbance or % transmission values.
2. Plot calibration curve: absorbance or % transmission (y-axis) against concentration (x-axis)
3. Record absorbance or % transmission values of unknown samples. Use calibration curve to read off concentration.
2. Plot calibration curve: absorbance or % transmission (y-axis) against concentration (x-axis)
3. Record absorbance or % transmission values of unknown samples. Use calibration curve to read off concentration.
23
New cards
What elements make up Carbohydrates?
Carbon, oxygen, hydrogen