14.6 Descriptive Statistics (Graphical)
0.0(0)
Card Sorting
1/11
Earn XP
Description and Tags
Last updated 4:48 PM on 8/4/22
Name | Mastery | Learn | Test | Matching | Spaced | Call with Kai |
|---|
No analytics yet
Send a link to your students to track their progress
12 Terms
1
New cards
Numerical data
Data whose values are real numbers
2
New cards
Categorical data
Data that tells us if an individual does or doesn't belong to a particular category
3
New cards
Bar graph
A(n) __________ consists of vertical bars, one bar for each category
4
New cards
Pie chart
A(n) __________ consists of a circle divided into sectors, one sector for each category
5
New cards
Bins
Nonoverlapping contiguous intervals of equal lengths
6
New cards
Histogram
A bar chart representing a frequency distribution; heights of the bars represent observed frequencies
7
New cards
Skewed to the right
Tail on the right
8
New cards
Skewed to the left
Tail on the left
9
New cards
Symmetric
Equal amounts of data on both sides of the mean/median
10
New cards
Standard normal distribution
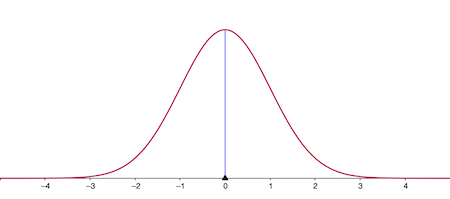
11
New cards
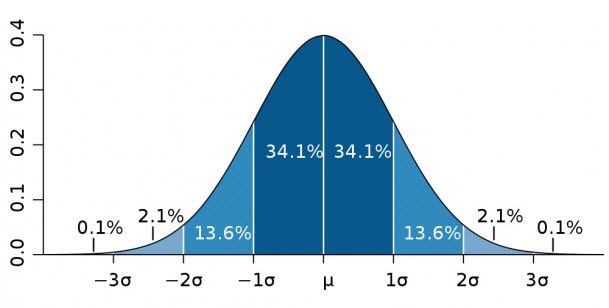
Normal distribution
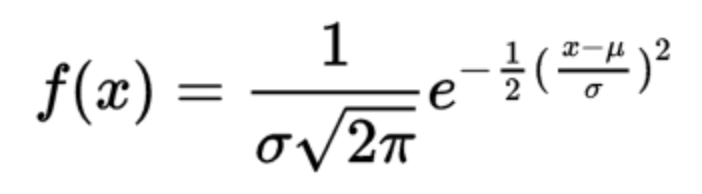
12
New cards
Bell curve