Salinity
1/20
There's no tags or description
Looks like no tags are added yet.
Name | Mastery | Learn | Test | Matching | Spaced | Call with Kai |
|---|
No analytics yet
Send a link to your students to track their progress
21 Terms
Major constituents (by mass)
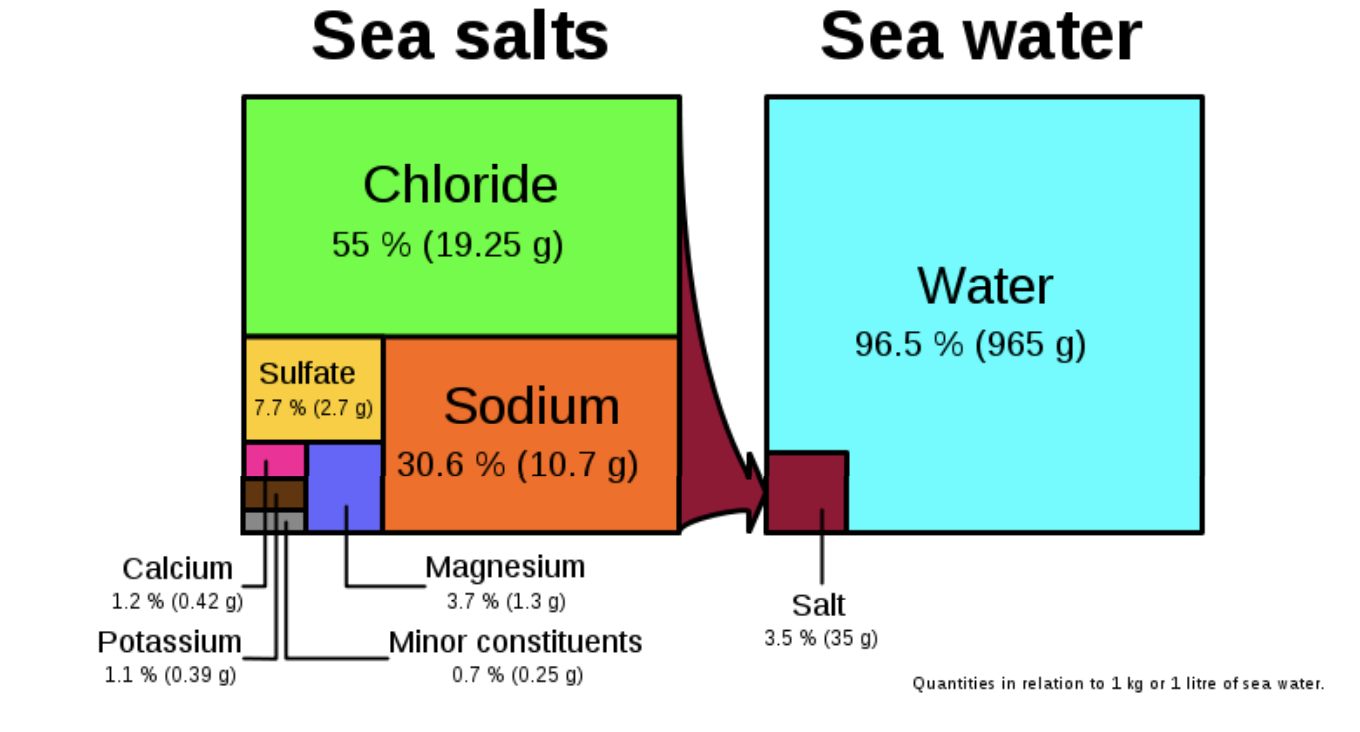
Major Constituents Concentrations
Cl- 546mM
Na- 470mM
Mg- 53mM
SO4- 28mM
Ca- 10.2 mM
K- 10.2mM
HCO3- 2.4mM (variable)
Na and Cl constant ratio with S for all seawater
constant proportions between pools of major constituents for the past 500my, which coincides with formation of multicellular life
Principle of constant proportions
regardless of salinity, major ion ratios are constant
Na/Cl constant for all seawater
Na/S also constant
Exceptions for principle of constant proportions
HCO3 - ±<20%
Ca2+ ±<1%
Sr2+ ±<2%
all biologically active- variable incorporation depending on where we are in the ocean
Salinity measurement methods
direct measurement- weigh the dried salt (some dissolved ions volatilize at high temps, so inaccurate)
Refractometer- a refractometer measures the change of direction or bending of the light as it passes from air to water
light moves slower in water than in air. the more salt in the water, the slower the light moves— not as precise (1 part in 70)
chemical- chlorinity (based on constant proportions)— titration with AgNO3 to precipitate AgCl, AgBr etc..
the titration gives the grams of Cl equivalent in 1kg of seawater
physical- conductivity
but need to correct for temperature simultaneously (Very precise; 1 part in 40,000)
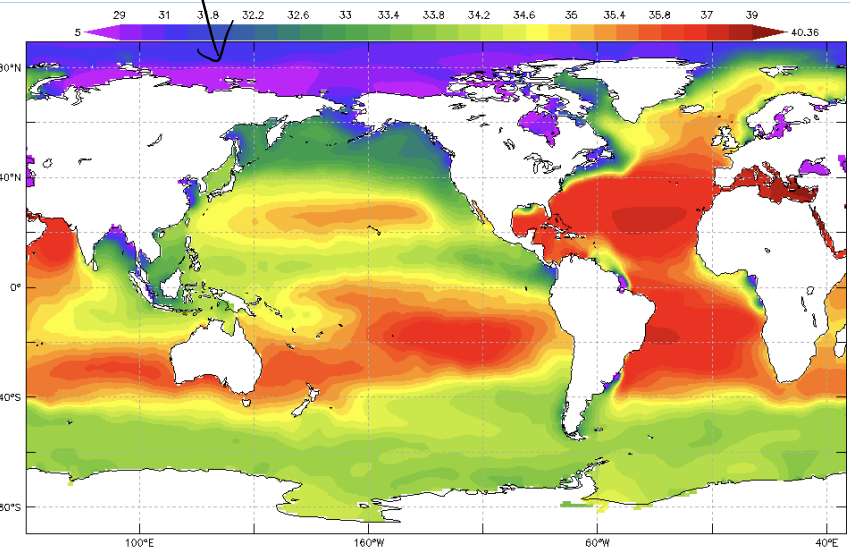
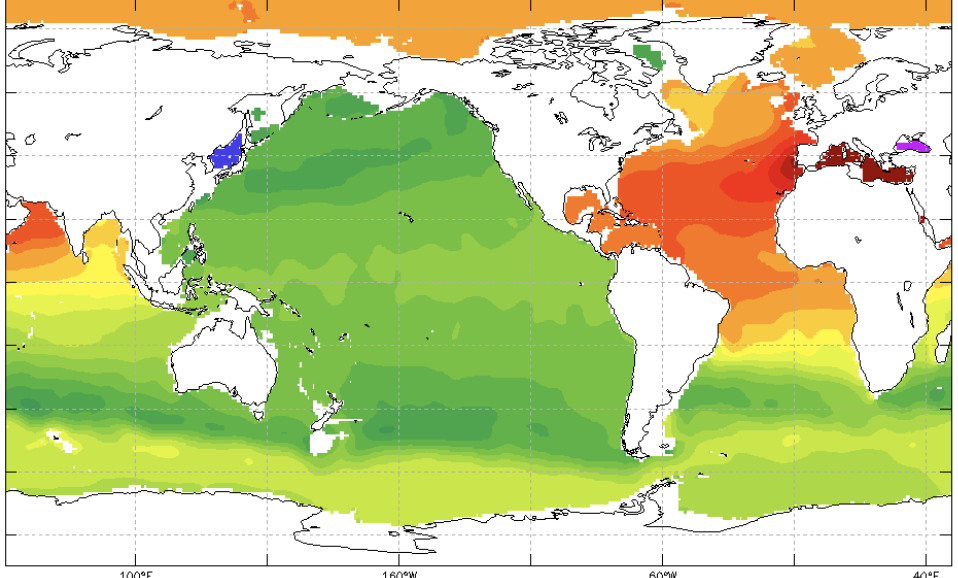
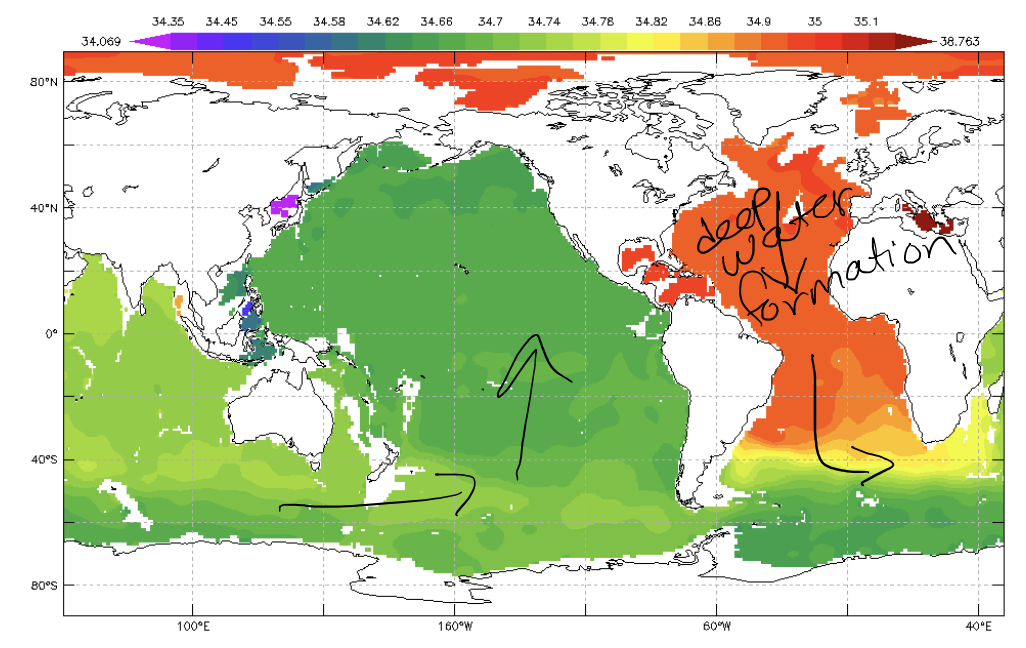
Sea surface salinity patterns
high in atlantic
low at poles (particularly in artic)
lower closer to land
high at gyre centers
low at equator
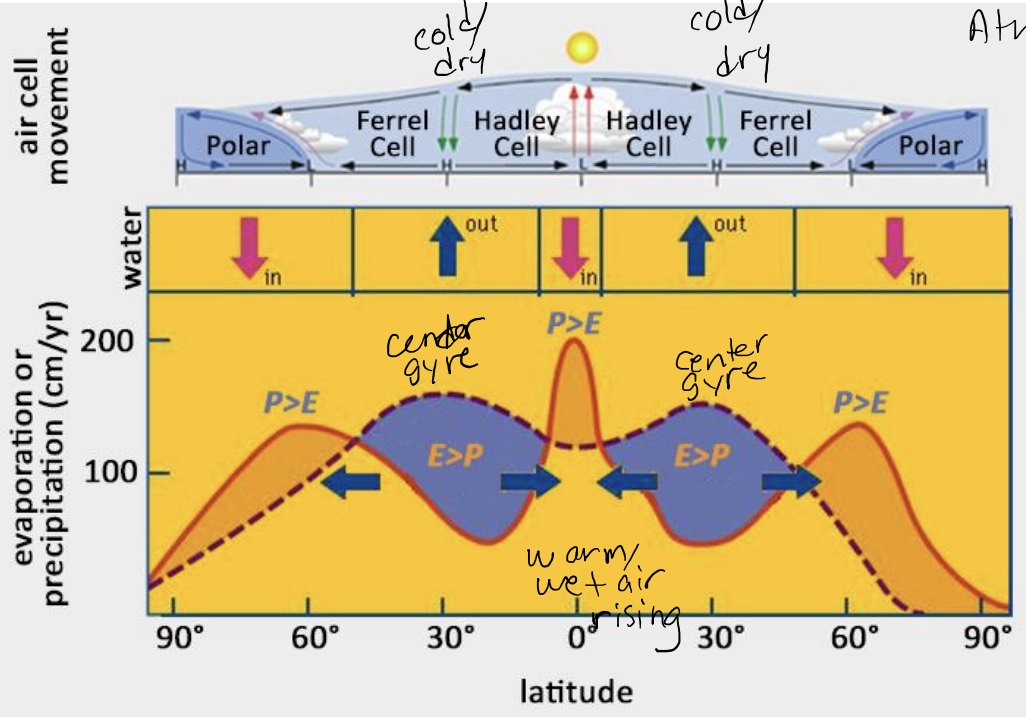
Evaporation and precipitation patterns
Atmospheric circulation controls evap/precip
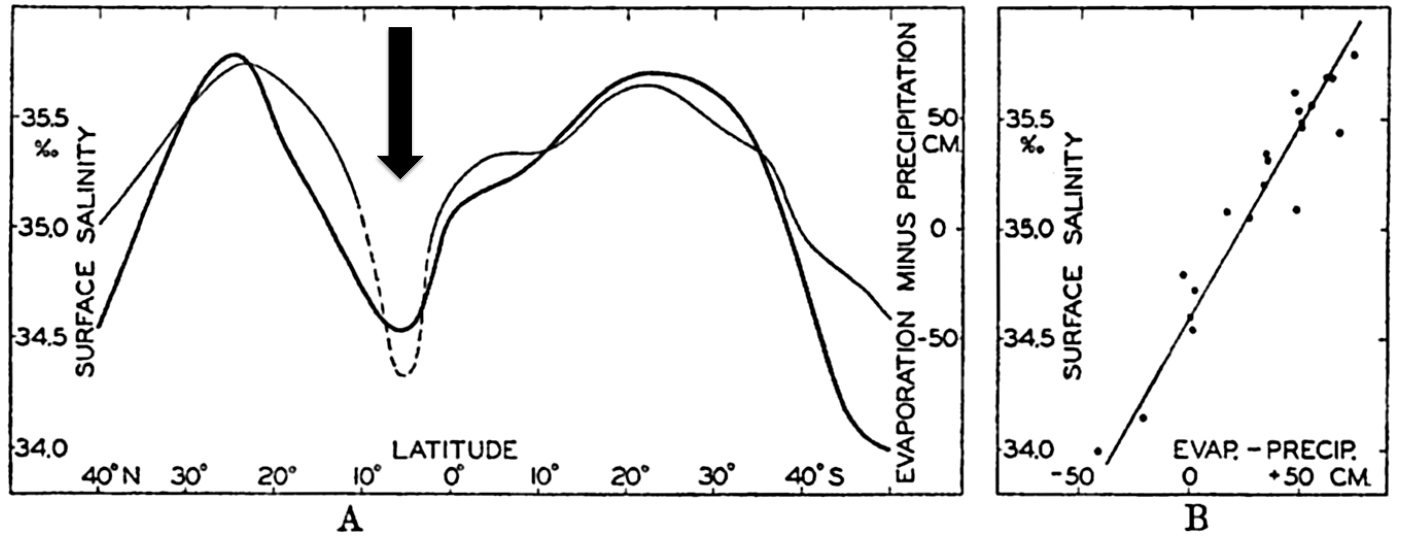
Relationship between evap-precip and salinity
it mirrors salinity patterns
What is the volume transport for water flux
106 m3/s (=SV)
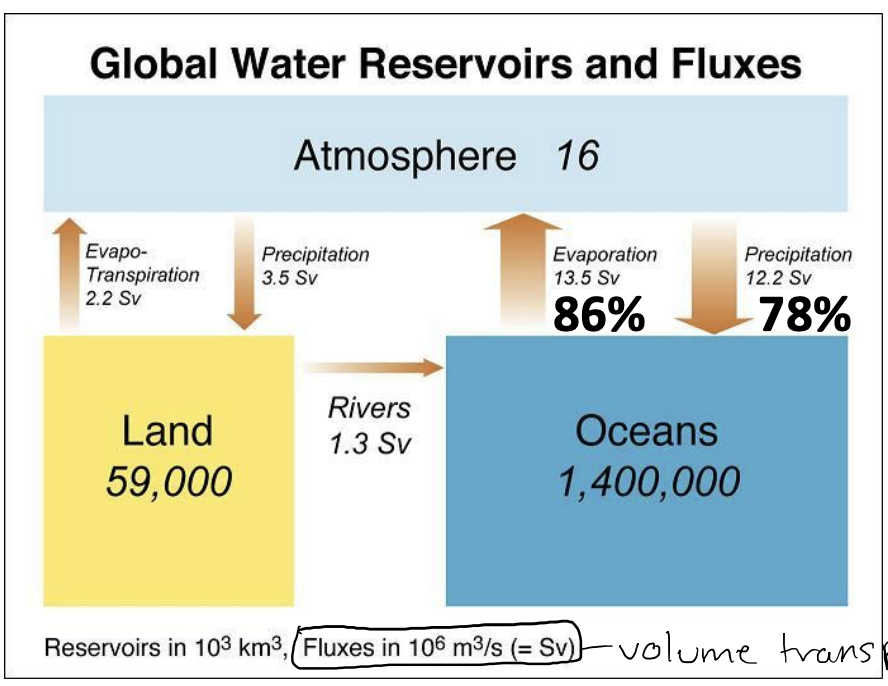
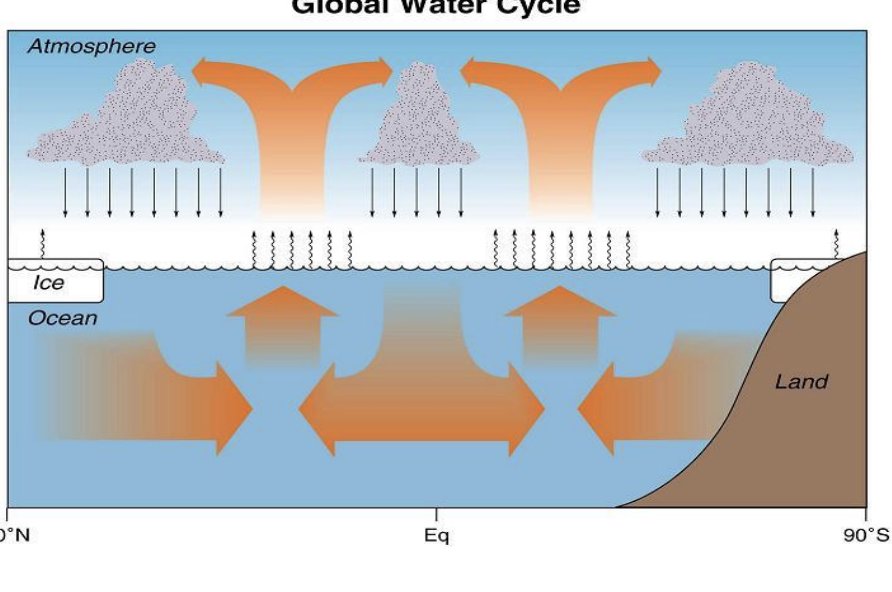
Global water cycle
mid-latitude evaporation
high and low latitudes have high precip
dominance of water cycle is in the ocean with a minor role of the land
complementary return flow in ocean
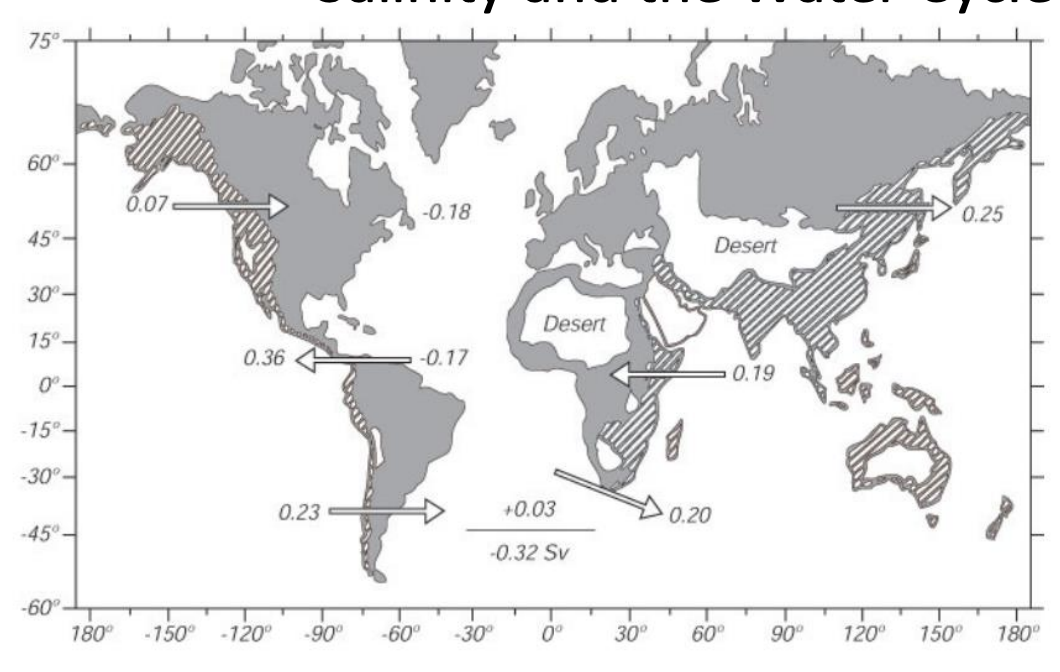
describe salinity and the water cycle
in temperate northern latitudes, there is a net loss from the Atlantic to Pacific totaling 0.32 SV
Salinity and the water cycle summary
The majority of the water cycle is between the atmosphere and the ocean
oceanic salinity is an excellent indicator of a changing water cycle
this makes it an important climate variable to monitor
the general patterns of surface salinity reflect the workings of the global water cycle
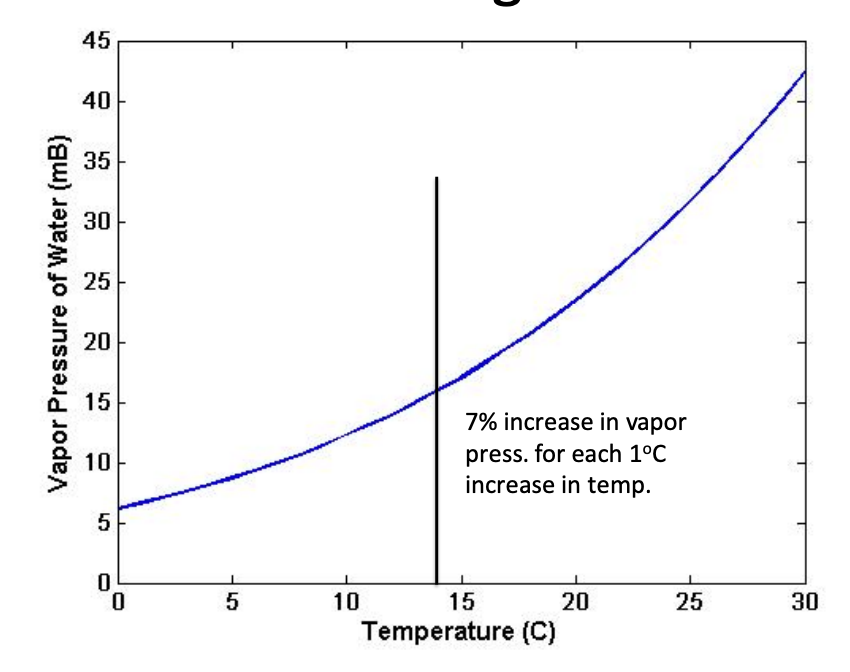
correlation between warming and the water cycle
7% increase in vapor press. for each 1c increase in temp.
in the future we could see more drought, flooding from rain, and more violent storms
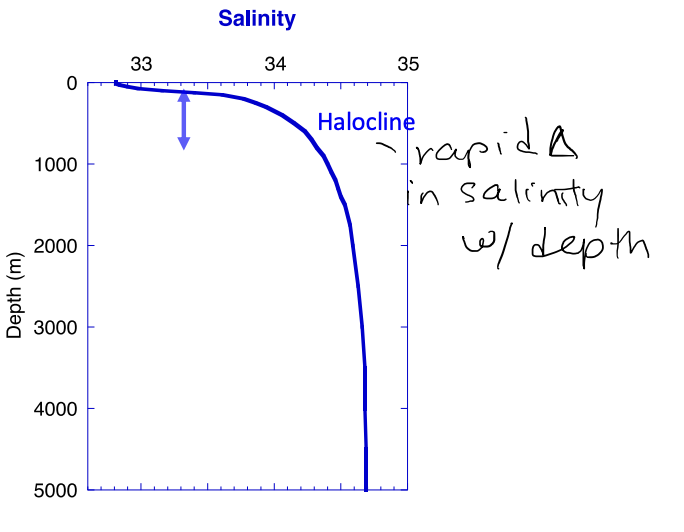
Salinity profile at high latitude
high latitude regions are dominated by precipitation and ice melt
salinity is lowest at the surface and increases along the halocline
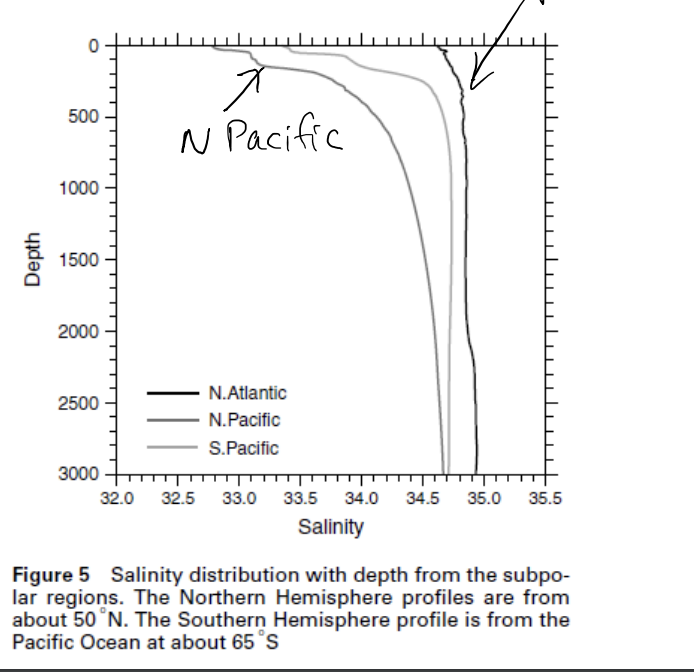
Salinity profile at North Atlantic subpolar gyre
it is affected by inflow of a thick layer of saline, warm surface water from the subtropical gyre
halocline typical of the subpolar pacific and subpolar southern hemisphere
absent in most of the subpolar north atlantic
PROFILE FROM HIGH LAT
Salinity profile for tropics
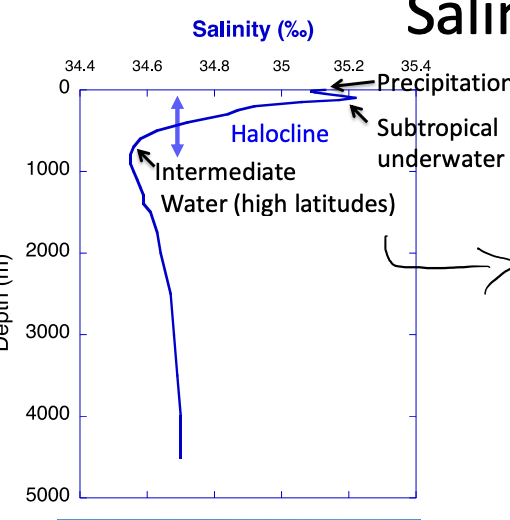
subtropical underwater is gyre water that has flowed equatorward
intermediate water (high latitudes) is coming from high latitudes
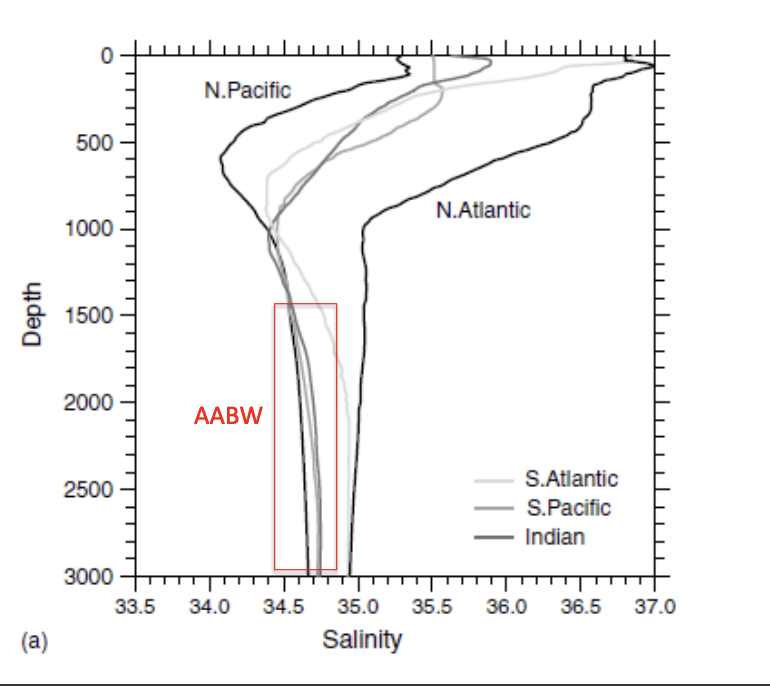
Salinity profile for the subtropics
N. atlantic saltier because of NADW
AABW in pacific and indian oceans
Salinity at 1500m
salinity at 3000m
temperature and salinity in atl vs pacif vertical structure
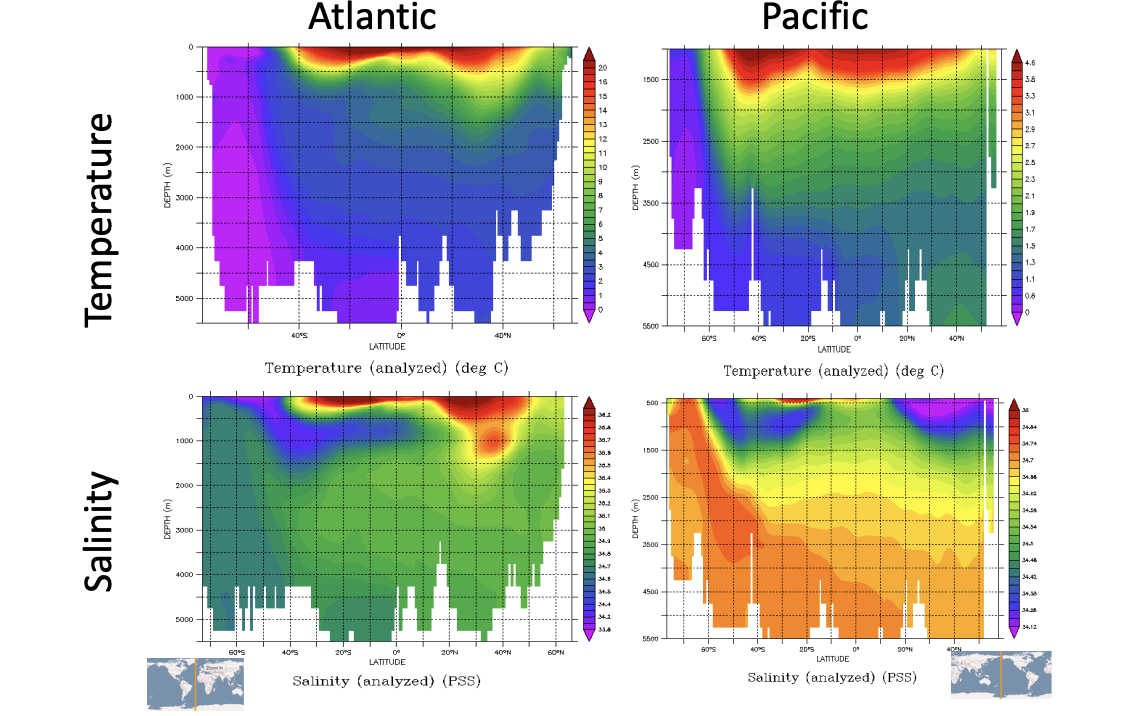
in atl you can see water masses
Shipboard sampling strategies
Profile CTD (conductivity, temperature, pressure)
Rosette: profiling CTD, Niskin bottles
supports numerous auxiliary sensors (dissolved oxygen, pH, turbidity, fluorescence, PAR (photosynthetically active radiation), altimeter)
ARGO float