ess 8.1 quiz
1/23
Earn XP
Name | Mastery | Learn | Test | Matching | Spaced | Call with Kai |
|---|
No analytics yet
Send a link to your students to track their progress
24 Terms
malthusian theory
main limit to population growth is food supply, as population grows geometrically and food supply increases arithmetically
although food production can increase while available fertile land exists, there will be a technological and ecological limit of food production growth that then limits the growth of the population
LIMITATION: agricultural advancements have greatly increased the capacity of food production, but poor distribution has made it so that there is a shortage in poorer countries and communities, so they are the ones suffering a limit of food supply
boserup’s theory
population growth will naturally create a drive for technological development in agriculture to maintain it
LIMITATION: although population stresses can cause development, they are not always sustainable, and can lead to environmental degradation that would impact population limits in the future
population growth past 500+ years
human population has been steady until around the 18th and 19th centuries, when it started to increase. in the 20th century, the exponential growth of the population began to grow more rapidly, and now in the 21st century it’s becoming a more steady rate, though still a sharp increase
demographic transition model
describes the way population growth rates change over time - 5 stages
Preindustrial > Transitional > Industrial or Industrializing > Postindustrial or Industrialized for Stage 4 & 5
stage 1 - preindustrial
high birth rate
high death rate
stable or slow natural increase
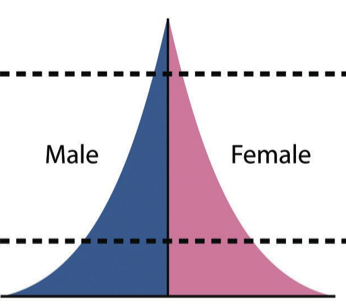
stage 2 - transitional
high birth rate
death rate falling rapidly
very rapid natural increase
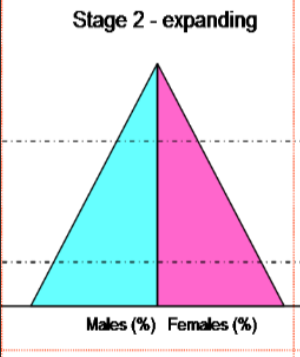
stage 3 - industrial or industrializing
falling birth rate
death rate falling more slowly
natural increase slows down
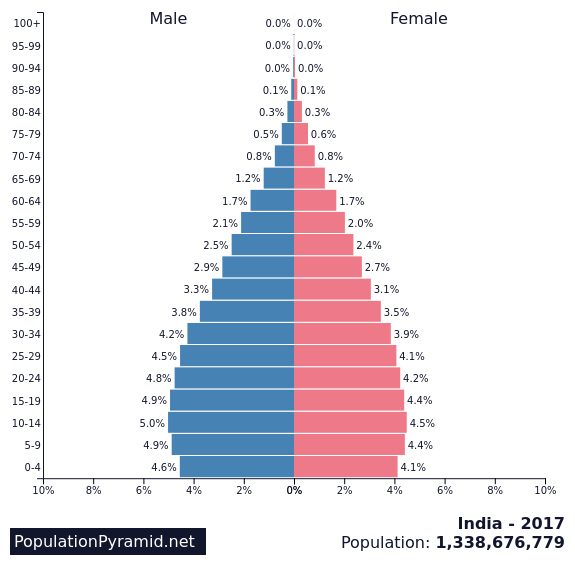
stage 4 - postindustrial/industrialized
low birth rate
low death rate
falling and then stable natural increase
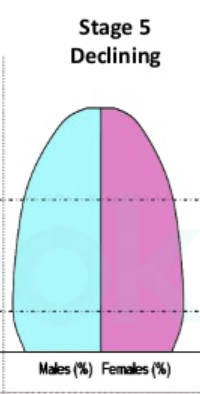
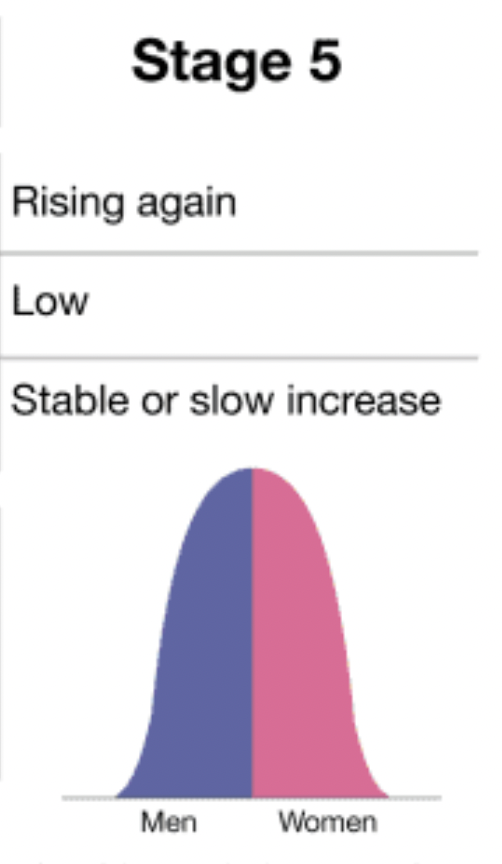
stage 5 - postindustrial/industrialized
rising birth rate again
low death rate
stable or slow natural increase
population pyramid
a type of bar chart that displays the amount of men and women in each age group that make up a population
set up like two bar charts placed on their sides and against one another, one for the male population and one for the female population
due to major life events in certain age groups, the population pyramid can help to show the standard of living and certain problem areas within countries
they can also help predict future population trends or needs that the country will face.
geographic region women have most children
africa
geographic region women have least children
europe
china and india population
china and india had extremely large populations compared to the rest of the countries even in 1800, and as their fertility rate shrank, their populations grew, suggesting child mortality decreased and standard of living increased
K
carrying capacity/cultural carrying capacity
overpopulation video
industrial revolution changed working conditions of developed countries - raised standards of living for working class
family size average is smaller than in past century
most of the world’s countries have reached stage 4
support of developing countries allow them to catch up more quickly
UN forecasts 12th billionth person will not be born - population growth will slow down
hans rosling “global population growth, box by box”
enormous gap in 1960 between developing and industrialized countries
no gap now but distance between is very far
the poorest 2 billion portion of the population will grow to 4 billion if things continue as they are - not unless they are given support to develop into further economic levels, then population growth will stop
role of old west in the developing world is to become the foundation, nothing more, nothing less
crude rates
Expressed by the 1000s
CBR: # births/1000
CDR: # deaths/1000
total fertility rate
the average number of children born to a woman if she was subject during their whole lives to the fertility rates of a given period and if they were not subject to mortality
expressed as children per woman
replacement level fertility
level of fertility in which a population exactly replaces itself from one generation to the next
population momentum effect
when a population continues to grow after the fertility rate reaches or falls below replacement level fertility; depends on age structure of a population
sub-saharan africa
area and regions of African continent that lie south of the Sahara Desert
three pillars to improve population outlook
Education - more educated women have less kids and have them later in life
Better healthcare - lowers child mortality
Contraception - increased contraceptive use and decreased accidental births and made family planning possible
Greatly decreased fertility rate from 7 to 2 in less than a century for Bangladesh
More children were able to get education and the country had more resources to invest in economy, health, and education
Why hasn't the same thing happened everywhere in Sub-Saharan Africa?
Education has improved very slowly
Suffering from effects of colonization, wars, and unstable governments
Cultural aspects disrupt conversations about contraception and family planning do to cultural and traditional values
4 billion people in this part of the world (by 2100) would be highly problematic for the entire world. What can be done?
Investment and aid to help build systems for the three pillars
Women get better education
Universal access to contraception to make families and children a decision
Similar approach has already worked in Ethiopia