Conservation Approaches: Species, Landscapes, and Demography
1/34
There's no tags or description
Looks like no tags are added yet.
Name | Mastery | Learn | Test | Matching | Spaced |
|---|
No study sessions yet.
35 Terms
Most conservation efforts have focused on protecting individual species or populations of single species. Why?
1. Species and populations are the essential unit of evolution
2. Legal mandates are typically centered at the species level (e.g., U.S. Endangered Species Act; Convention on International Trade in Endangered Species = CITES)
3. Education: efforts to engage the public on conservation issues are often tied to the public’s interest in certain high-profile species (e.g., giant panda, gray wolf, sea turtles)
4. Ecological theory on which conservation is based has traditionally focused on species
5. Passion! Conservationists, including conservation biologists, develop a deep, personal and professional interest in a particular species; this duty of care fosters an interest in saving them from extinction
Criticism of ecosystem-level protection
protected areas are often not properly enforced (e.g., Dulvy, 2013)
To be clear, we need both strategies to win battles for biodiversity
There are also individual conservationists that have made tremendous contributions towards saving single species (e.g., Jane Goodall, Dian Fossey)
How do we decide a species needs conserving?
population declining
BIDE Factors
birth rates (B), immigration (I), death rates (D), & emigration (E)
So Nt+1 = Nt + B + I – D – E, where N = population size at time t
there are also secondary demographic factors called life history characteristics
such as sex ratio, age structure, timing of first reproduction/age at maturity, size at maturity
importance of demography in in conservation biology - ex Key Deer
a race of White-tailed Deer that live in the Florida keys
They are found on 20 islands, with 75% found on two islands: Big Pine Key and No Name Key
Although they mainly live on a National Wildlife Refuge, mortality occurs due to habitat loss, vehicle collisions & ‘deaths associated with urbanization’
Lopez et al (2003) showed that vehicle collisions caused > 50% of all adult deaths. In the meantime managers were taking conservation measures to reduce collisions such as fencing, underpasses & cattle guards
However, Lopez et al (2003) also determined that the populations were near carrying capacity, and so reducing mortality due to collisions might increase populations and thus the spread of disease, and increase negative human-deer interactions
Although all agreed that reducing collisions is desirable, they also suggested actions be taken to reduce birth rates (e.g., contraception) to compensate for the decrease in mortality due to measures to reduce collisions
Conservation of these populations benefitted from understanding and manipulating demography
How are populations (mainly) regulated
Increased mortality or decreased natality due to shortage of resources (e.g., shortage of food)
Increased mortality or decreased natality due to increased intensity of intraspecific interactions (i.e., competition)
Increased mortality due to increased predation, parasitism or disease
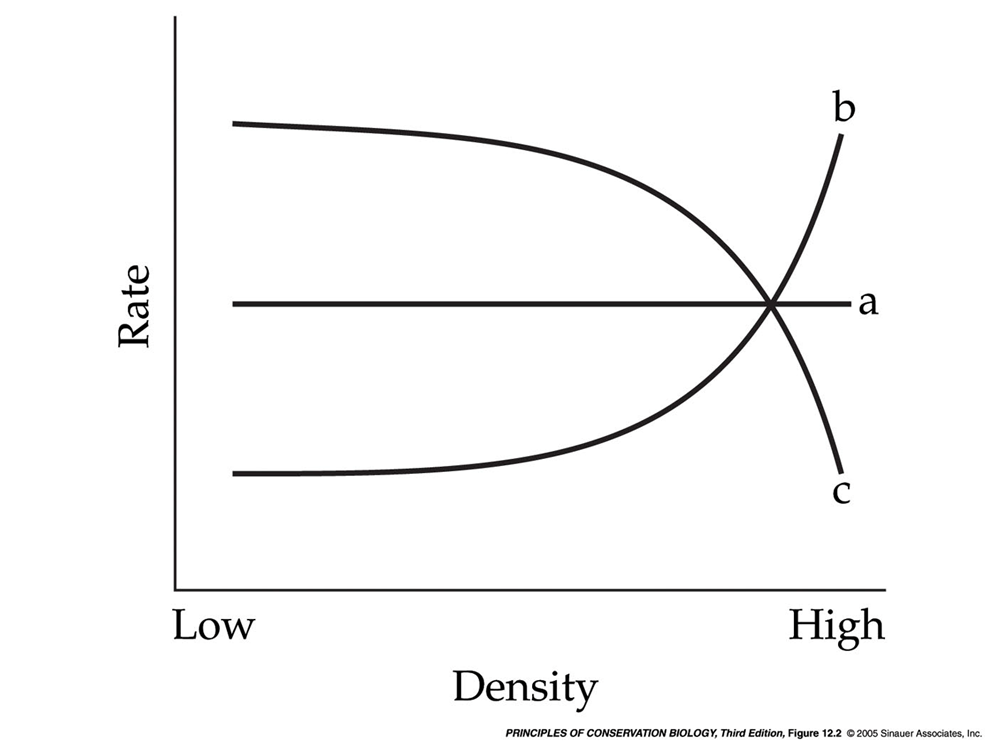
Density dependence

c - birth rates
b - death rates
a - density independence
problems of small populations
allee effect
inbreeding depression
demographic uncertainty/stochasticity
environmental uncertainty/stochasticity
allee effects
at a very low population density there can be problems relating to social behavior
inbreeding depression
loss of genetic diversity (alleles) due to small sample size associated with breeding among close relatives
demographic uncertainty/stochasticity
attributes such as mortality rate and reproductive success - can be highly variable among individuals, such that if the population is too small the population can go extinct
environmental uncertainty/stochasticity
sudden unpredictable increase in mortality or reproductive failure (e.g., due to floods, storms, droughts, etc)
source population
that good habitats result in higher survival and reproductive success
Populations produce an excess of individuals that must disperse outside their habitats
sink population
poor habitats result in lower survival and reproductive success (rely on source)
populations in would become extinct without dispersing individuals from source populations
metapopulations
A population that consists of many subpopulations linked by dispersal
source populations are defined by
demography (survival and reproductive success), not population density
Metapopulations - ex: Peregrine Falcon conservation
Populations crashed starting in the 1950’s due to the pesticide DDT
After DDT was removed from use, northern California (CA) populations began to recover while coastal CA populations did not
A third population type – in urban areas – rebounded quickly because of high survival in young birds due to lack of predators & easy prey = pigeons (Kaufmann et al., 2004)
Source-sink modeling showed that northern populations would persist without intervention, & could theoretically serve as a source population for the coastal populations
However, northern birds rarely dispersed, and so the coastal populations would possibly go extinct without the addition of hundreds of captive-bred young; this was carried out successfully
what do you need to know to determine which habitats/populations are sources vs sinks
a great deal of knowledge about the demography & natural history of organisms. Without this knowledge, it is impossible to design and implement an effective conservation plan
the cougar story
Extirpated in the eastern and central U.S. in the early 1900’s (except in south Florida)
Almost hunted to extinction in the western U.S.
In the 1980’s ‘green movements’ in states such as Colorado encouraged their protection around suburban park areas
Human-cougar interactions increased dramatically
Sightings indicate that they are moving eastward
Wildlife – human interactions
Black Bears have killed 61 people in North America since 1900
Grizzly Bears have killed 8 people at Yellowstone NP in 140 years
Spiders kill 7 people annually in NA
Snakes kill 5 people annually in NA
Domestic dogs kill 35 people annually in NA
Lightning kills 31 people annually in the U.S.
Car accidents kill ~37,000 people annually in the U.S.
Guns kill ~34,000 people annually in the U.S.
Modeling approaches in conservation
▪Conservation biologists often rely on quantitative models to predict the fate of populations, and to test scenarios that may explain decline or indicate what kinds of interventions are more likely to succeed
population viability analysis (PVA)
Examines the demographic effect of different threats or management practices on a population(s) by projecting into the future. Basically we are trying to understand extinction risk
Data plugged into the model include life span, age-specific growth rate, age-specific mortality rates & fecundity
There have been numerous criticisms based on data limitations & uncertainties, and the lack of testing predictions in the short term
Population change and hierarchical analysis
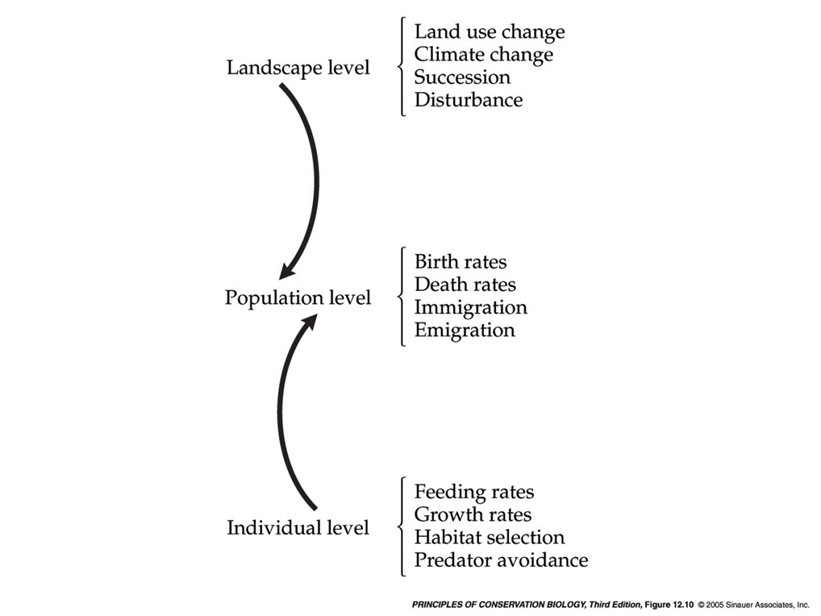
Predicting and understanding population change can be complex, and can be best viewed in a hierarchy comprised of 3 levels:
Landscape level, population level, individual level
Population dynamics should thus be as a hierarchy of processes affecting populations at different levels

Landscape models for conservation
Source-sink dynamics require conservationists and land managers to adopt a landscape approach; the fates of populations linked by dispersal are interconnected
The landscape approach to conservation recognizes the interconnectedness of populations and incorporates this into models and management plans
For example, saving a single piece of critical habitat may not be enough to maintain a population
How is the landscape perspective developed and applied in the field?
A conservation biologist or ecologist is interested in mapping the landscape at the appropriate scale - sensitive enough to capture the habitat requirements but large enough to cover the area an organism will occupy during its lifetime
Mapping boundaries of habitat patches requires a set of criteria that is easiest in disturbed landscapes, harder in natural landscapes, and often not possible in marine landscapes
landscape
is a mosaic of patches of habitat across which organisms move, settle, forage, reproduce, and die
Bachman’s Sparrow habitat mapping
Soil type & topography influence the rate at which seedling trees grow, and thus the ages of pine stands that have vegetation profiles suitable for the sparrows
These can also be mapped for managers
The habitat requirements will obviously differ among species
The maps will not always determine the presence or absence of a species, but it can categorize habitats as suitable or non-suitable, or even provide a probability of occupation
Landscape models informing conservation
Liu et al. (2001) studied changes in habitat for Giant Pandas in China
China, along with WWF, set aside a series of reserves for panda protection in mountainous areas; only a fraction of each reserve contained suitable habitat for bamboo (the panda’s food)
Ecotourism of the reserves benefitted local people in the rural areas; this caused the rate of habitat destruction of panda habitat inside the reserves to increase since reserve establishment
Locals had cleared land for firewood and materials for the increasing human population; landscape modeling demonstrated the loss of habitat
landscape mapping - biosphere reserves
spatially-explicit population models (SEPM)
incorporate the actual locations of organisms and suitable patches of habitat, and explicitly consider the movement of organisms among those patches
They are composed of 3 elements: a landscape map, a scenario of how the landscape will change in the future, & a population dynamics simulation
Metapopulation models are general and do not incorporate the complexities of real landscapes; they are thus of limited use for conservation managers
Mobile Animal Population (MAP)
type of SEPM that simulates habitat-specific demography and the dispersal behavior of organisms on computer representations of real landscapes
The map is a grid of cells, each of which is the size of an individual territory of the species being simulated; models contain information on management practices, succession, and growth rates of important other species (e.g., trees)
The model can depict the current landscape structure and project the landscape structure in the future based on a management plan specifying a harvest and replanting schedule
Geographical information Systems (GIS)
a system designed to capture, store, manipulate, and analyze all types of geographical data - roads, patches of habitat, trees, farms, rivers, etc
incorporate and maps the actual distribution of habitat patches in a region using satellite
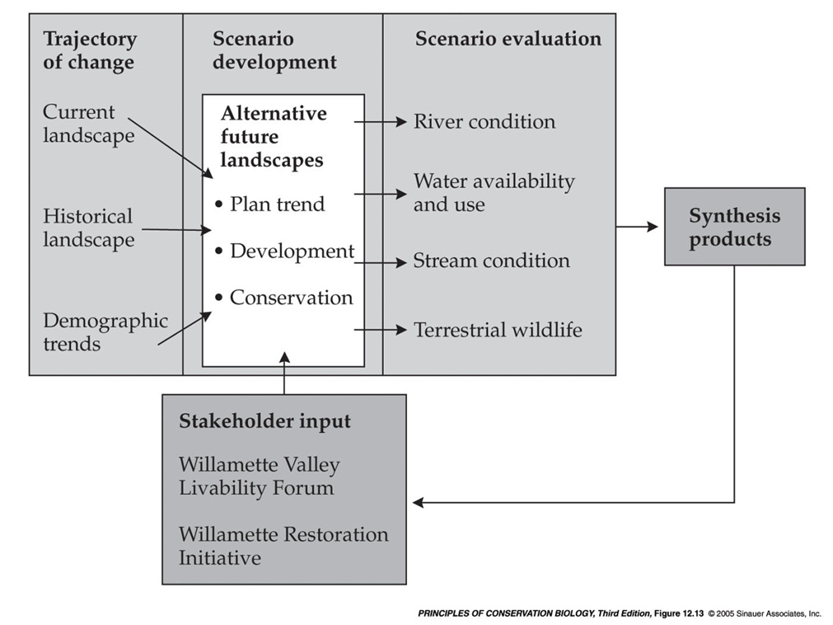
Alternative Future analysis
predicts outcomes in both biodiversity and socioeconomics based on several projections of future development

example of landscape-based demographic model
> 50% of birds that breed in North America are Neotropical migrants – that is, they overwinter in Central and South America
Many are in decline due to habitat loss & fragmentation
SEPM modeling was used to assess the extinction risk of these birds in the face of landscape change; or, how species might respond to various land management scenarios