Population Ecology Quiz
1/40
There's no tags or description
Looks like no tags are added yet.
Name | Mastery | Learn | Test | Matching | Spaced | Call with Kai |
|---|
No analytics yet
Send a link to your students to track their progress
41 Terms
What is population ecology?
the changes in population size and the factors that regulate populations over time - impact with their environment
What is a population?
A collection of inter-breeding organisms of a particular species living together in an area.
What is a community?
A group of interacting organisms sharing an environment.
What is a biotic factor?
A living component of a biological community (eg. grass, animals, bacteria etc.)
What is an abiotic factor?
A non-living component of an ecosystem (eg. water, air, temperature, solar energy etc)
What is population ecology?
The study of how members of a population interact with their environment, focusing on factors that influence
population density and growth.
What are the factors that influence the size of a population?
1. Immigration (I) - movement of new individuals from another area into the population
2. Natality (N) - the birth rate of a population
3. Emigration (E) - the movement of individuals out of a population to another area.
4. Mortality (M) - the death rate of a population.
What is the formula for Population Size?
Population Size = (N+I)-(M+E)
What is Density of a population?
The number of individuals of a certain species per unit area or volume.
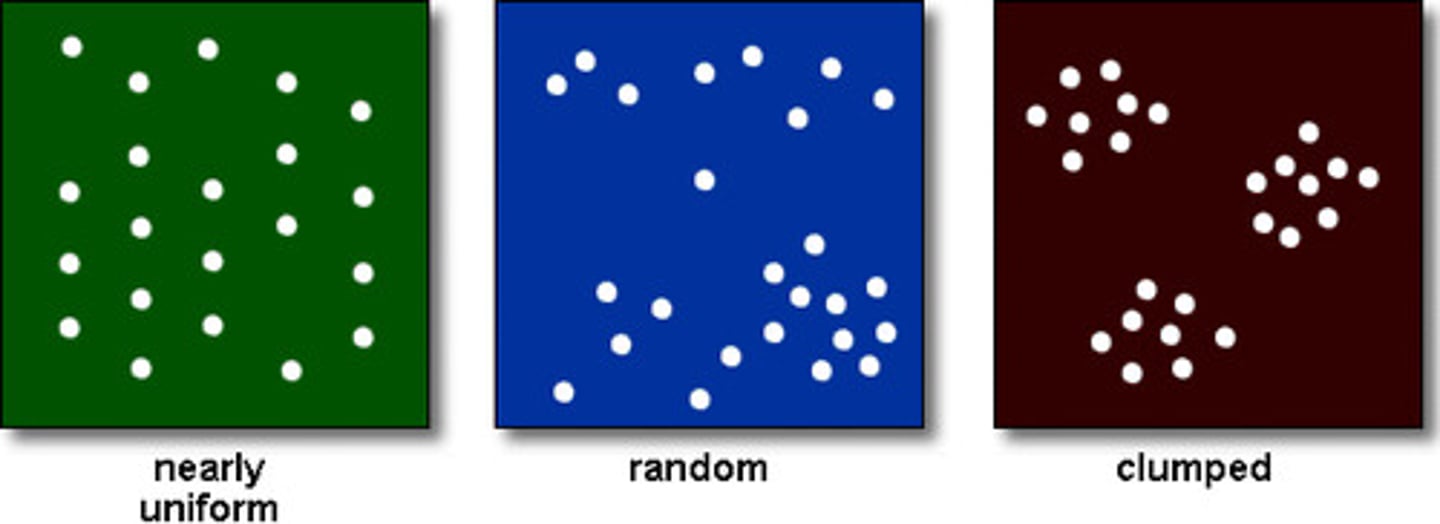
What is population Dispersion?
How the population is dispersed in an area. (eg clumped, uniform or random).
clumped - individuals are in patches
uniform - individuals are evenly distributed
random - there is an unpredictable distribution
What are some techniques for estimating population density?
1. Sample plot method.
2. Mark recapture method.
What is the sample plot method for estimating population density?
Count the number of organisms of the study species in a plot of a known size.
With what type of organisms is the sample plot method appropriate?
In a sessile population (stationary organisms) eg. plants
What is the formula for density in the sample plot method?
Population Density = Number of individuals in a population sample plots/total area of all sample plots.
What is the mark recapture method for estimating population density?
Use two trapping events. First, the study area is determined and a trap is set. All animals caught in the trap are marked and released. Later, the traps are set again and the proportion of parked to unmarked animals captured in the second trapping gives an estimate of the number of individuals in a population.
For what type of organisms is this method
appropriate?
Organisms that are moving (eg mice)
What is the formula for the Mark-recapture method?
Population Density = M x C/R
M = total number of animals captured and marked in the first trapping event.
C = total number of animals captured in the second trapping event.
R. = number of animals captured int the first trap that were recaptured in the second trapping event.
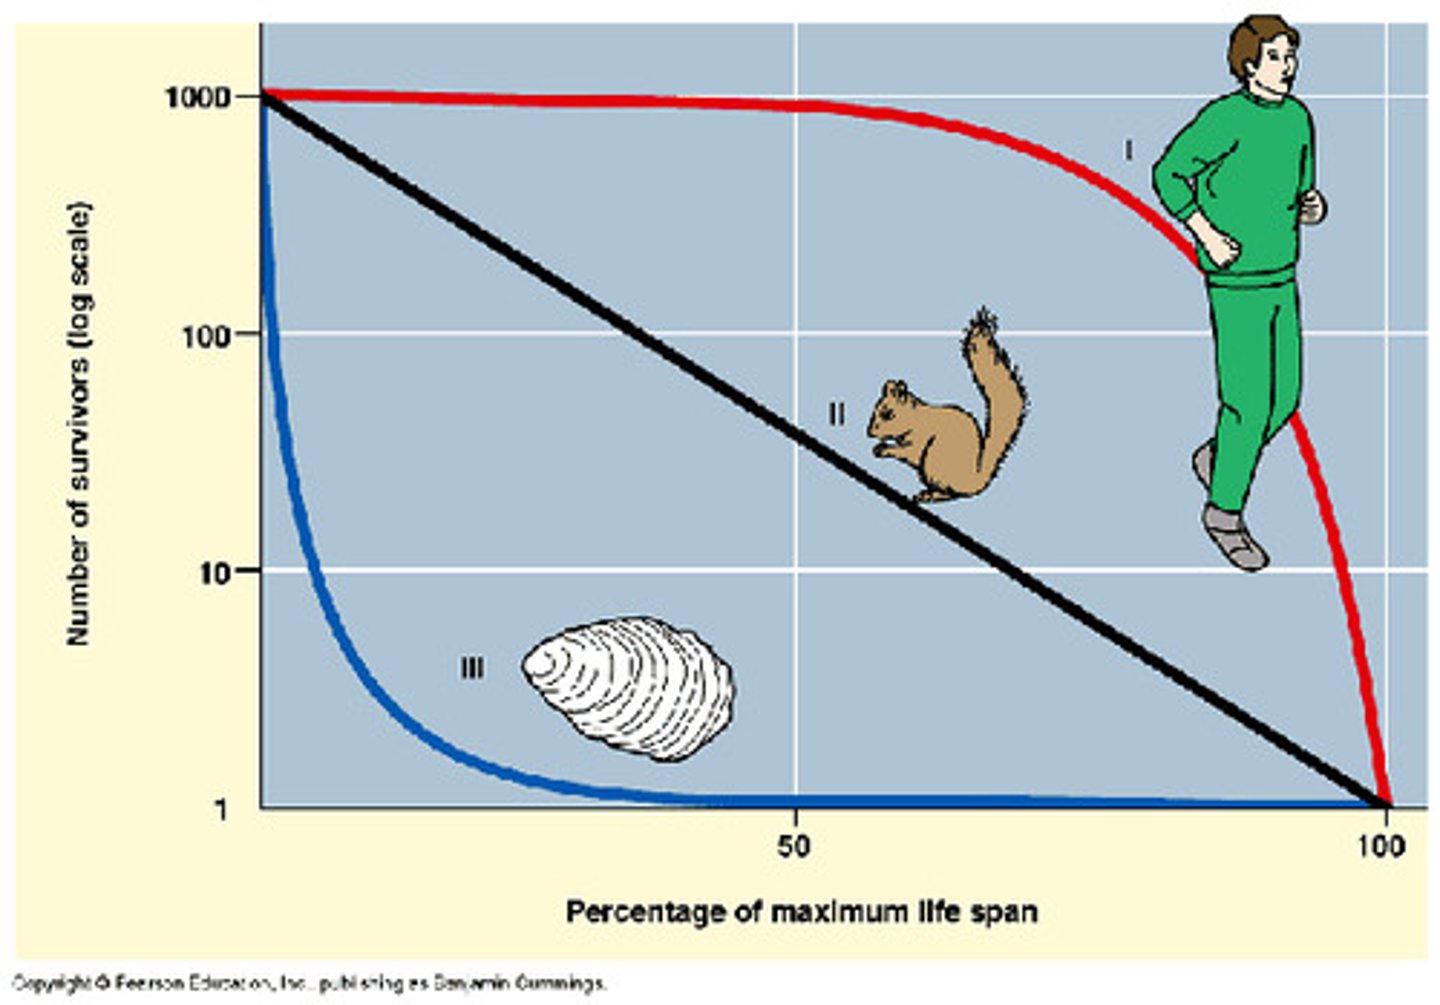
What is a survivorship curve?
A graph that allows population ecologists to estimate how many members of an original study group are still alive at different time intervals.
What are the three types of survivorship curves?
Type 1 - Curve in which there are few offspring born and there is good parental care so that most of the individuals live to an old age. (eg elephants, humans, large mammals)
Type II - The organisms die at an equal rate at all ages. There is some parental care (eg. rodents and birds)
Type III - Many offspring are produced because many do not survive in the first few days. If they do survive they have few predators (eg mussels, grasses, oysters etc.)
What is per capita increase in a population?
The average contribution of each individual to population growth.
What biotic potential of a population?
The highest possible rate of per capita increase for a population.
What factors affect the growth rate of a population?
The biotic and abiotic factors in the environment.
What is environmental resistance in a population?
Factors that restrict population growth thus preventing it from achieving its biotic potential.
What are some examples of limiting factors in
population growth?
Limited food supply, size of habitat, accumulation of waste, and natural disasters.
What is the difference between density dependent and density independent limiting factors?
Density dependent factors are a result of the population itself limiting growth (eg. build up of waste from the population or overgrazing can limit the growth.
Density independent factors are from an outside influence such as fires, droughts, temperature etc.
What creates a Logistic growth pattern with population?
When limiting factors cause the growth of a population to level off this creates a logistic growth pattern.
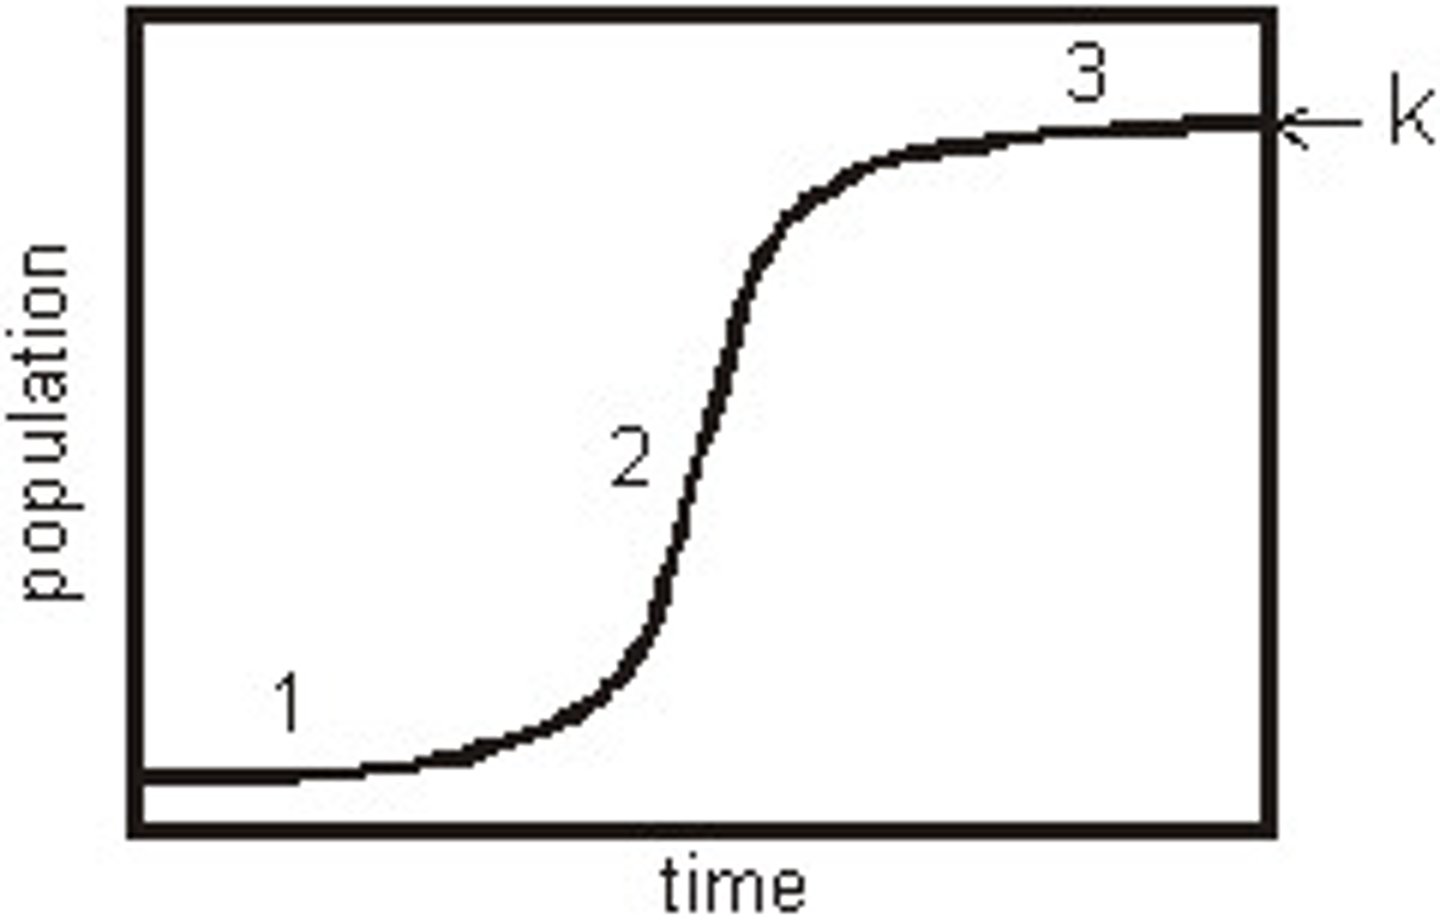
What are the parts of a logistic growth curve?
1. slow growth - part at the beginning of the curve where population is slowly increasing
2. Exponential growth - part if the middle where the population is increasing rapidly.
3. Carrying capacity (population equilibrium) - the part at the end of the curve where the population growth stays fairly constant. This is the maximum population size the environment can maintain.

What is the exponential growth model or curve?
Curve which shows unregulated population growth.
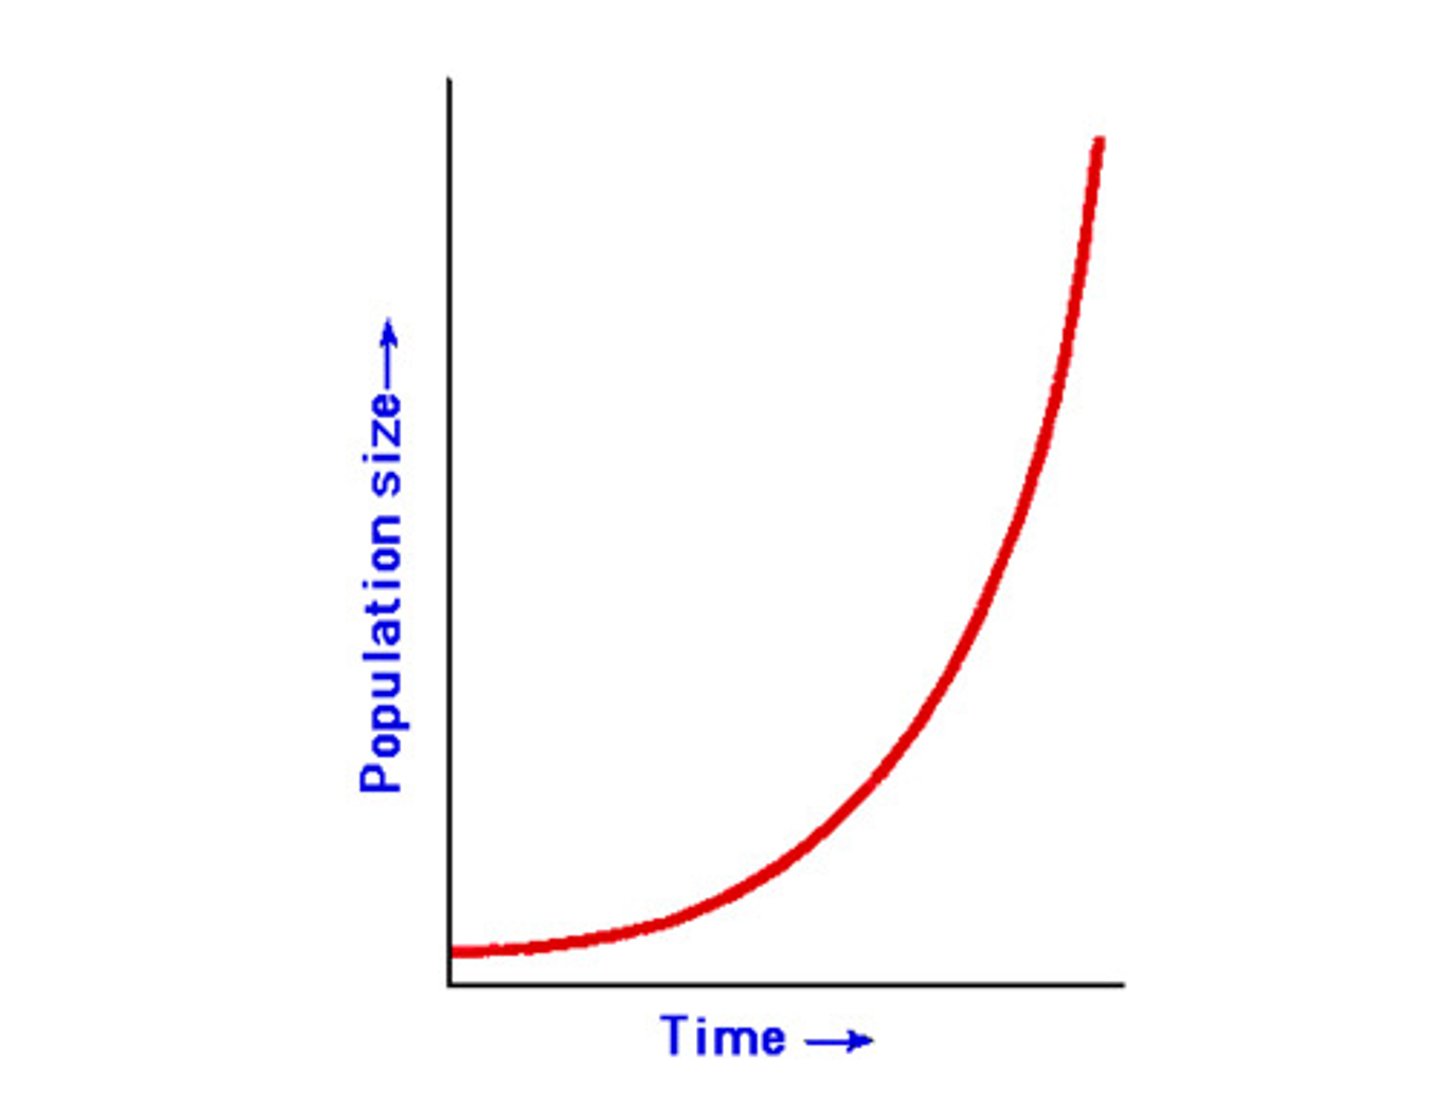
What is an example of an organisms that
follows the exponential growth model?
Humans (our population is increasing out of control).
How did improvements in agriculture affect
human population growth?
This lead to improved livestock and increased crop yields so population could increase.
What caused the drop in the human growth
curve in 1400 AD?
There was a massive deadly epidemic in Europe (the bubonic plague which killed over 1/3 of the population in Europe.
What lead to the greatest increase in human
population growth?
The discovery of antibiotics and vaccines which prolong lives.
What factors may eventually lead to a decline
in human population growth?
Lack of food, space resources etc.
What is biodiversity?
The variety of living things including genetic diversity, species diversity and ecosystem diversity?
What are the three levels of biodiversity?
1. Genetic Diversity - having lots of different genes in a population
2. Species diversity - having lots of different organisms in a population.
3. Ecosystem diversity - having lots of different ecosystems in the world.
What is an ecological footprint?
An estimate of the amount of land required to provide the raw materials an individual or nation consumes including food, fuel water, housing and waste disposal.
How does our ecological footprint in Canada compare with the rest of the world?
People in the developed world (eg Canada and the US) have a much higher per person ecological footprint than in the undeveloped world (eg India) because we use more resources per person. There is over consumption by the individual.
What can you do to reduce your ecological footprint?
Drive less, fly less, eat less meat, turn off electronics consume less by buying only what you need, not what you want, eat locally, reduce, reuse, recycle.
Species diversity
The total number of different species in a community., the number and relative abundance of species in a
biological community
ecosystem diversity
variety of habitats, living communities, and ecological processes in the living world
genetic diversity
sum total of all the different forms of genetic information carried by all organisms living on Earth today