M1: Understanding the financial planning process & M2: Financial Statements
1/30
Earn XP
Description and Tags
Name | Mastery | Learn | Test | Matching | Spaced | Call with Kai |
|---|
No analytics yet
Send a link to your students to track their progress
31 Terms
Financial Literacy
the ability for people to make informed judgements and decisions to take effective actions. About your current and future situation.
Net-Worth-to-Earnings ratio =
net worth / annual earnings
Net Worth =
Total Assets - Total Liabilities
Financial Planning
process of planning your spending, financing and investing as to your optimise financial situation
6 Steps to Financial Planning
Define financial goals, be specific and focus on results, make them realistic (consider current situation and reasonable expectation), prioritise goals and define time frame→ have $200
Develop financial plans and strategies to achieve goals → save a certain amount each month
implement financial plans and strategies
develop budget to monitor control and progress towards goals
evaluate results by using financial statements
review and redefine in light of new information → prepare financial statements
Types of Goals
Short-term goals: within the year
Intermediate-term goals: within next 2-5 years
Long-term goals: periods greater than 5 years
personal financial plan:
specifies your financial goals and describes the spending, investing and financing so you can achieve tour goals
Average Propensity to Consume (APC)
income spend on current needs / total income then turn into % by / 100/1
eg 60% = spending 60% if income so every $1 they earn they spend 0.6c
What determines personal income:
Age, martial status, education (higher income and higher employment), where you live, career choice
Reserve Bank
Government setting level of interest rate and take charge of economy to manage inflation and stabalise the economy
controls money supply → increase price of good if there is more money.
used to stimulate or contract economic growth → if economy is looking like there will be a recession, reserve bank reduce the supply of money and adjust.
interest rate management (role of OCR - offical cash rate)
effect on exchange rates
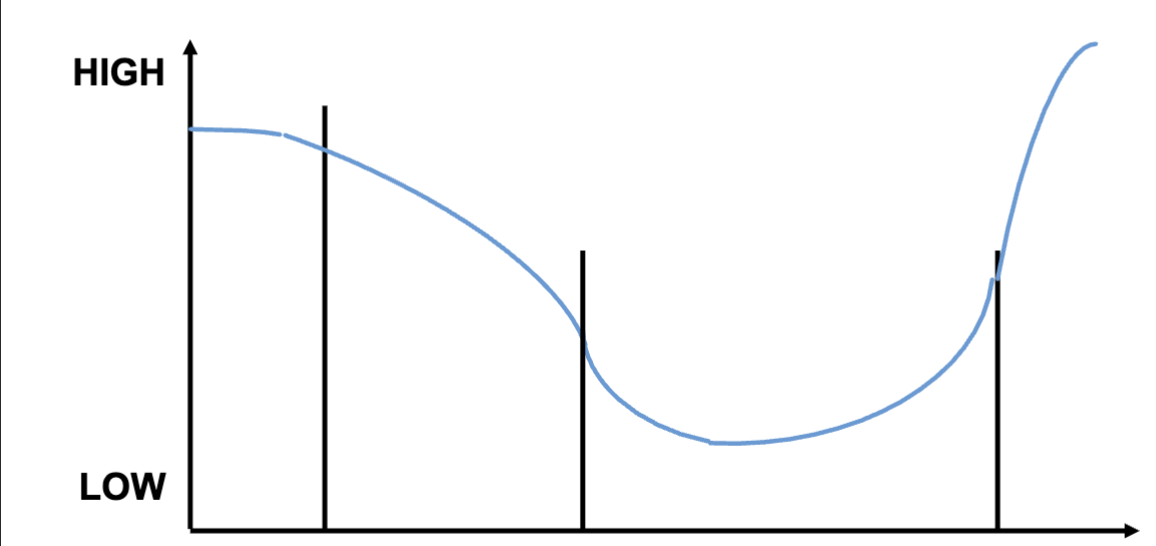
Economic Cycles
→ expansion - economy good everything happy
→ recession - decreasing economy
→ depression - lose jobs, cant raise family,
→ recovery - prices are cheaper and economy will grow
The Financial Wonder
The power of ‘compounding’ with the understanding of ‘time value of money’.
Present Value (PV)
How much money you currently have
Interest Rate (r)
How much you earn each year as a percentage od your principle
Future Value (FV)
any money that we will consider to have in the future
Time period
today is 0 - goes up in years.
Compound Interest Equation
Principle + interest = Total savings
PV + Interest (PV*r) = FV
PV*(1+r) = FV
FV3 =
PV * (1 + r)3
FVn =
PV * (1 + r)n
Balance sheet
A statement of your financial position at one point in time
What is this called? And what is located on the ‘x’ axis?
Economic Cycles
→ expansion - economy good everything happy
→ recession - decreasing economy
→ depression - lose jobs, cant raise family,
→ recovery - prices are cheaper and economy will grow
What Balance sheet summarises
Assets (what you own)
Individual level
Bank account
Car
Investments
Jewellery
Furniture
House
Liabilities (what you owe)
Car loan
Credit card balances
Student loan
Unpaid monthly bills
Mortgage
Net Worth
(Subtract total liabilities from total assets to determine net worth.)
Balance Sheet Equation
First equation of accounting
Assets = Liabilities + Net Worth(Equity)
A = L + E
E = A - L
Revenue Statement
Statement of Financial Performace
A measure of your financial performance over a given time period.
For example – the revenue statement of ‘you’ for the year ended 31 March 2020.
Total Income – Total Expenses = PROFIT OR LOSS. (indv. Surplus or Deficit)
For us, as individuals, this is usually recorded on a cash basis (i.e. when we actually receive or pay money).
For companies, this is usually recorded on an accrual basis
Balance Sheet Ratios
Solvency ratio & Liquidity ratio
Solvency ratio
Shows the state of your net worth at a given point in time.
Indicates your potential to withstand financial problems.
Total net worth / Total assets
Liquidity ratio
Current: asset or a liability that is expected to be turned into cash within one year
Liquid: Subset of current assets. An asset which will be turned into cash within one week
Measures your ability to pay current debts (liabilities) with existing liquid assets.
Liquid assets / Total current debts (liabilities)
Revenue statement ratios
Saving ratio & Debt service ratio
What Revenue statement summarises
Income & expenses
Saving Ratio
Cash surplus: total income - total expenses
Shows the percentage of after-tax income being saved during a given period.
Debt Service Ratio
Indicates ability to repay loan obligations promptly with after–tax income.
Total monthly loan payments / monthly income