Techniques to Study Gene Regulation
1/32
There's no tags or description
Looks like no tags are added yet.
Name | Mastery | Learn | Test | Matching | Spaced | Call with Kai |
|---|
No analytics yet
Send a link to your students to track their progress
33 Terms
How do we know that transcriptional regulation is a commonly used mechanism for differential gene expression?
differential gene expression is a used mechanism
see differences in level of RNA transcripts being produced in different tissues
differential distribution of transcripts within a developing organism
transcripts (mRNA) for only a subset of the genes of a genome are found in a specific cell/tissue/organ type
some genes are expressed in all cells, but most are not
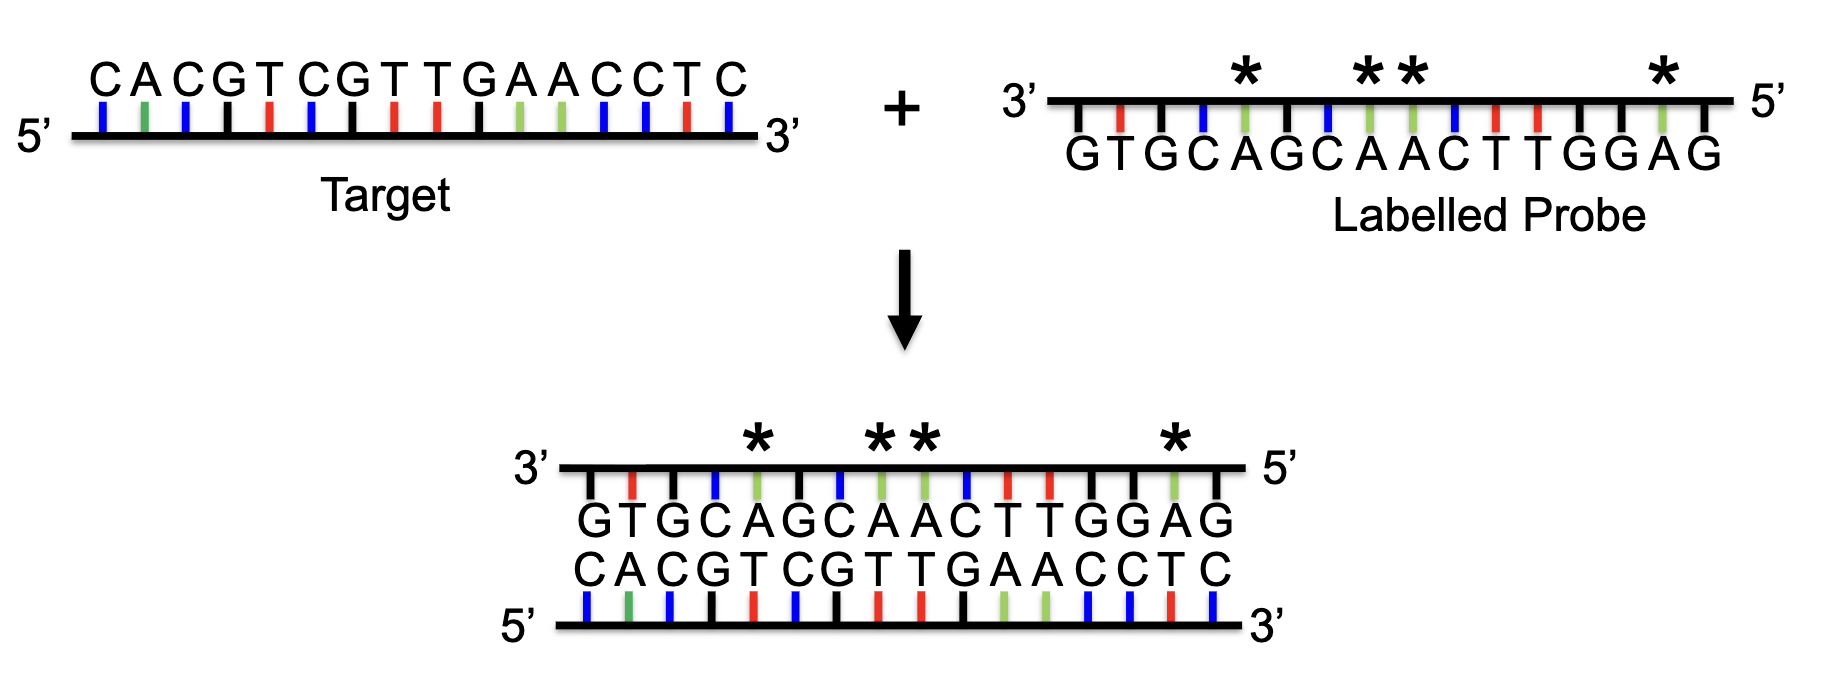
Nucleic Acid Hybridization
hybridization: phenomenal in which single-stranded DNA or RNA molecules anneal to complementary DNA or RNA
a hbridization probe is a fragment of DNA or RNA which is readioactively or non-radioactively labeled
it can be used t detect the presence of nucleotide sequences (DNA or RNA) complementary to the sequences in the probe
Methods: Transcript Distribution in an Organism
Several methods can be used to determine the temporal and spatial distribution of gene transcripts during development
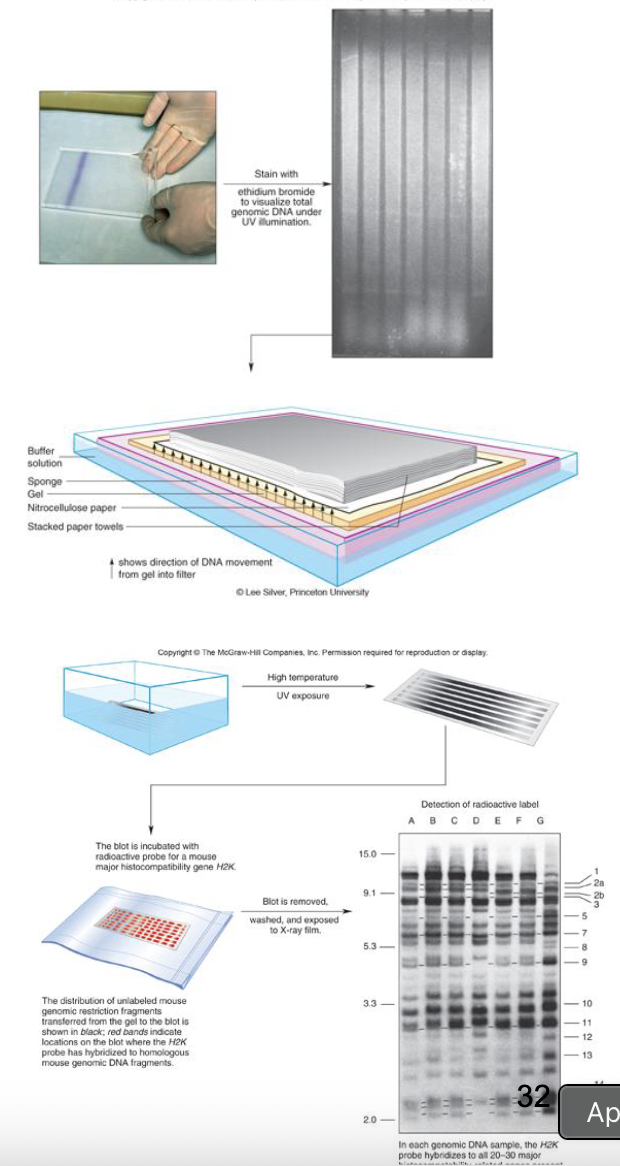
Methods for detecting Transcript Distribution: RNA Northern blot
isolate mRNA from cells from different tissues or developmental times
separate RNA transcript by size using electrophoresis (will smear b/c its all types of RNA)
capillary action (ability of a liquid to flow in narrow spaces)
transfer to a hybridization membrane
hybridize a labelled gene-specific probe to the RNA on the membrane to detect any RNA molecules that are homologous to the probe
only want the ones that stick, otherwise washed away
RNA Northern Blot FIGURE
RNA Northern Blot: Advantages vs Disadvantages
Advantages: provides transcript size, presence/absence, abundance and presence of splice variants
Disadvantages: Time consuming
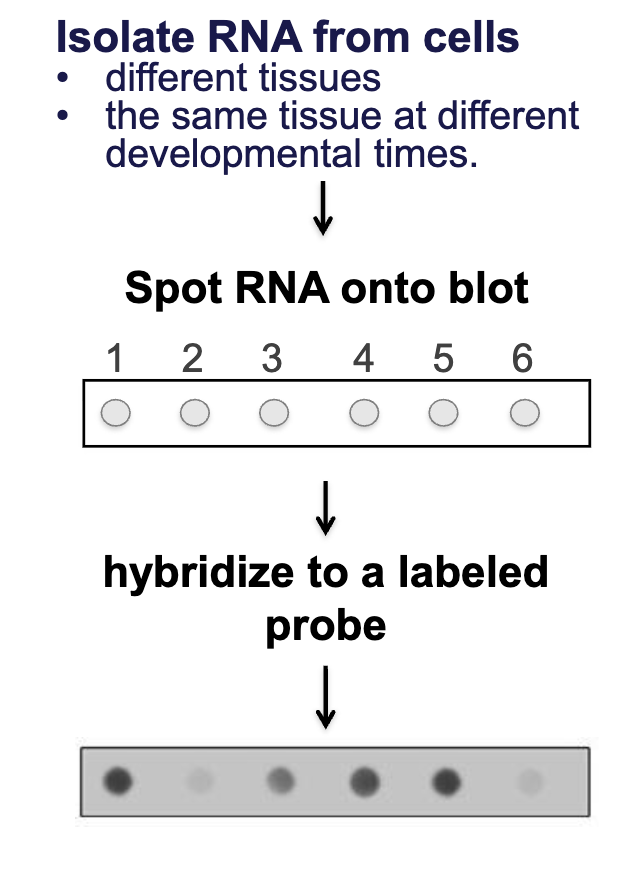
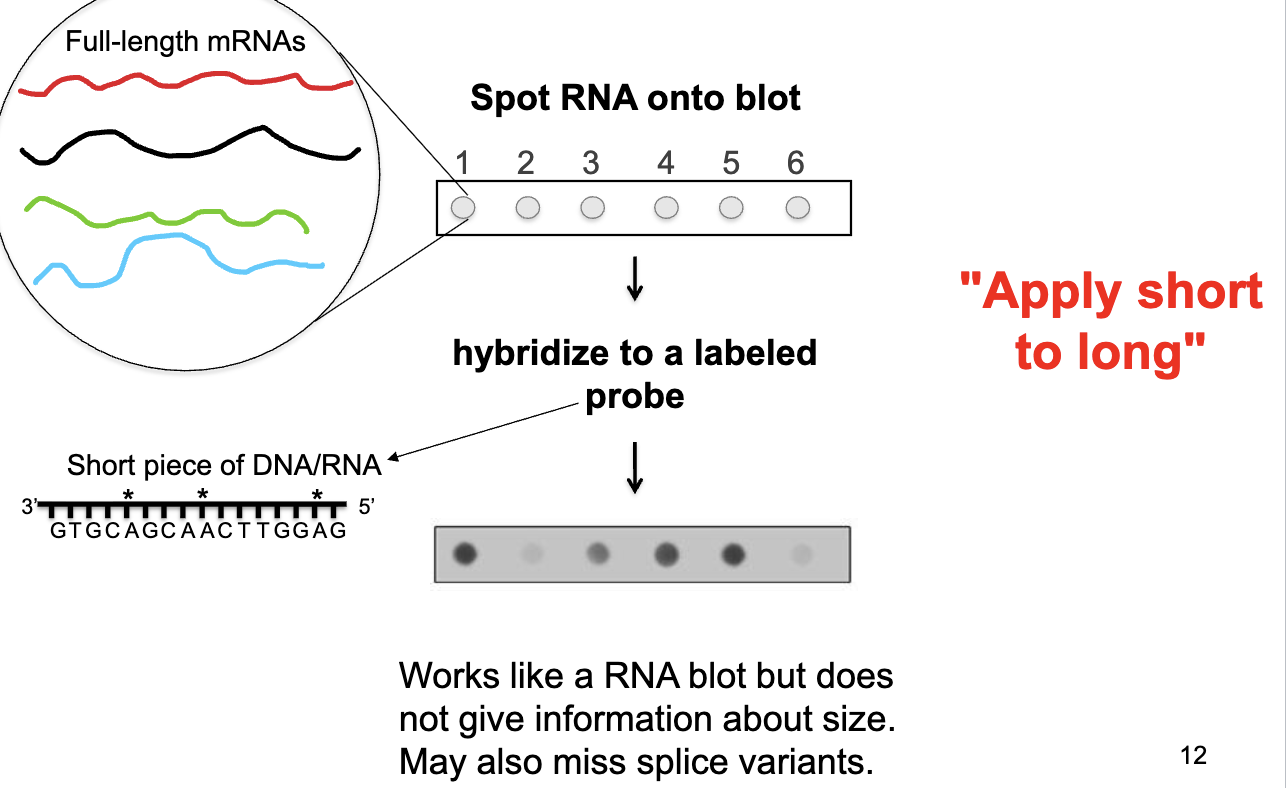
RNA Dot Blot
isolate RNA from cells
different tissues
the same tissue at different developmental times
spot RNA onto blot
hybridize to a labeled probe
if target sequence is present, can detect that label
no need to separate by size
RNA Northern vs Dot Blot
Northern Blot: - more time consuming
provides info about presence/absence of transcript
gives info about transcript size and presence of splice variants
Dot Blot: - simpler, faster
provides info about presence/absence of transcript
lacks info about transcript size or presence of splice variants
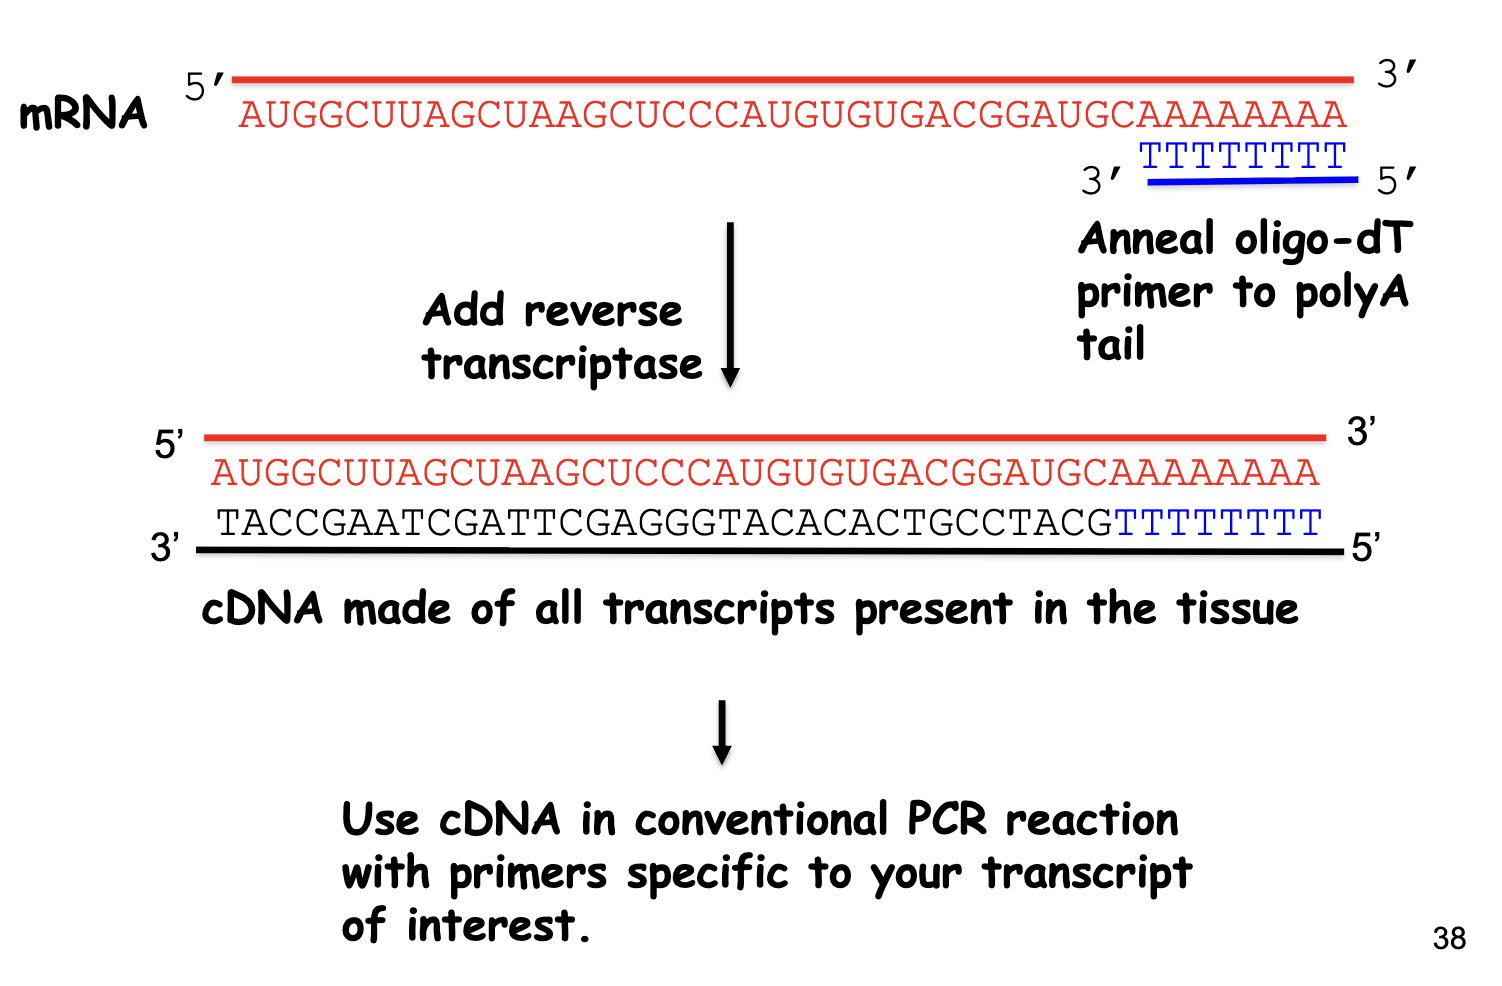
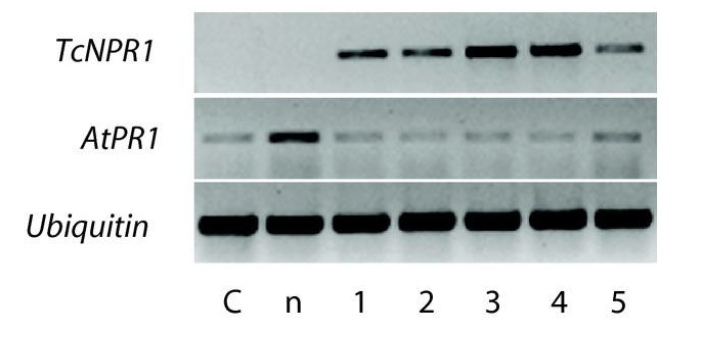
Methods for detecting Transcript Distribution: Reverse Transcriptase (RT-PCR)
starts w/ a mRNA template
mRNA → anneal oligo-dT primer to poly A tail → reverse transcriptase → cDNA made of all transcripts present in the tissue → use cDNA in conventional PCR reaction w/ primers specific to your transcript of interest (gene-specific primers)
more sensitive at detecting specific RNAs than RNA blot
RT-PCR Steps
isolate RNA from cells from different tissues or the same tissue at different developmental times
make cDNA from mRNA using reverse transcriptase and oligo-dT primer
use gene specific primers to amplify cDNA (if the transcript corresponding to the primers is present)
i.e carry out PCR on the cDNA
run PCR reaction on a gel to observe if there is an amplified product
PCR and RT-PCR are only somewhat quantitative
band intensity reflects how many copies of template DNA were present at the start of PCR
fainter bands means less starting template and less overall amplification
over the 25-40 cycles of a typical PCR, the amount of DNA product reaches a plateau that is not directly correlated w/ the amount of target DNA in the initial PCR
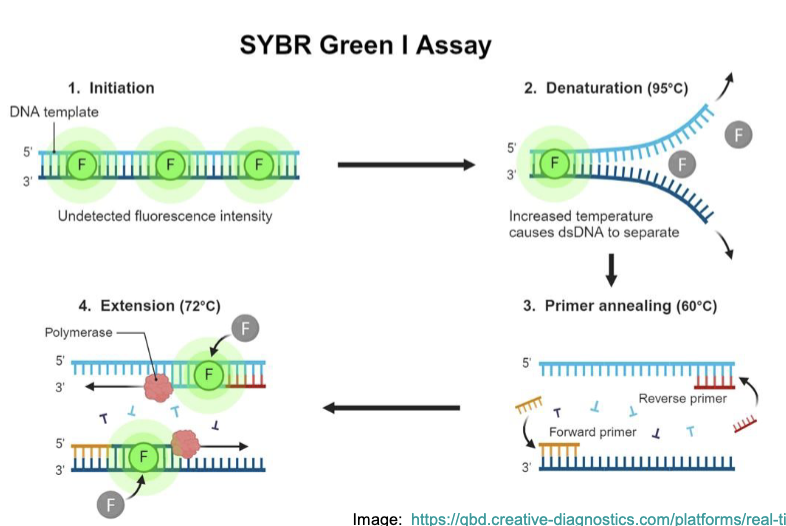
Solution: Quantitative (Real-time) PCR and RT-PCR (qPCR + qRT-PCR)
include a probe w/ a reporter that fluoresces only when new DNA is synthesized (e.g SYBR green, which fluoresces when bound to dsDNA)
amount of fluorescence measured reflects the total amount of amplified DNA present
measuring the amount of PCR product after every cycle
analyze how fluorescence changes w/ PCR cycle
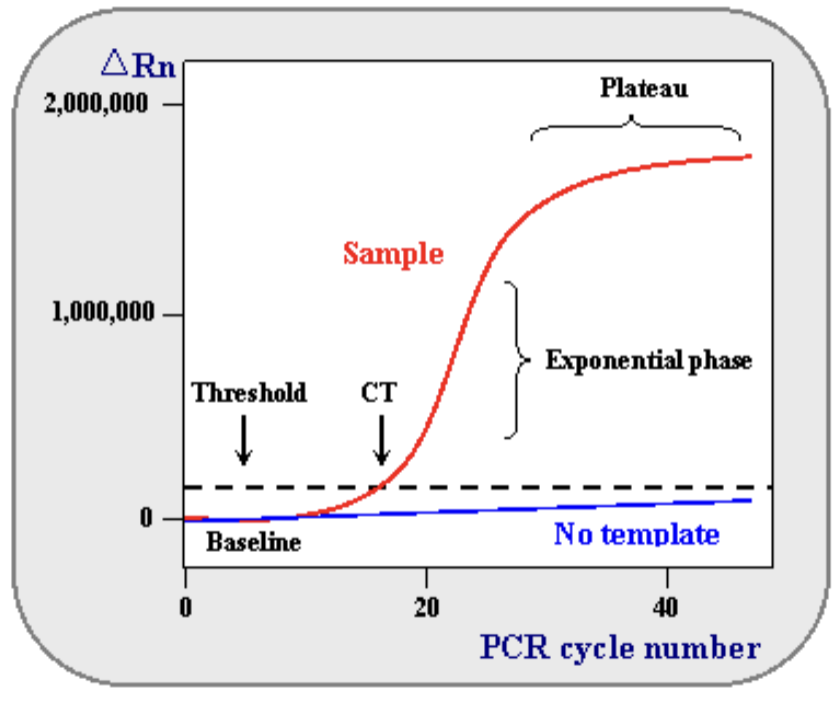
Quantitative (Real-time) PCR and RT-PCR (qPCR + qRT-PCR) CONTINUED
normal PCR and RT-PCR: we visualize DNA after PCR cycles are complete
amplified DNA already at a plateau
qPCR: we measure CT (threshold cycle), the number of PCR cycles it takes for detected fluorescence to be greater than threshold levels – before the plateau is reached
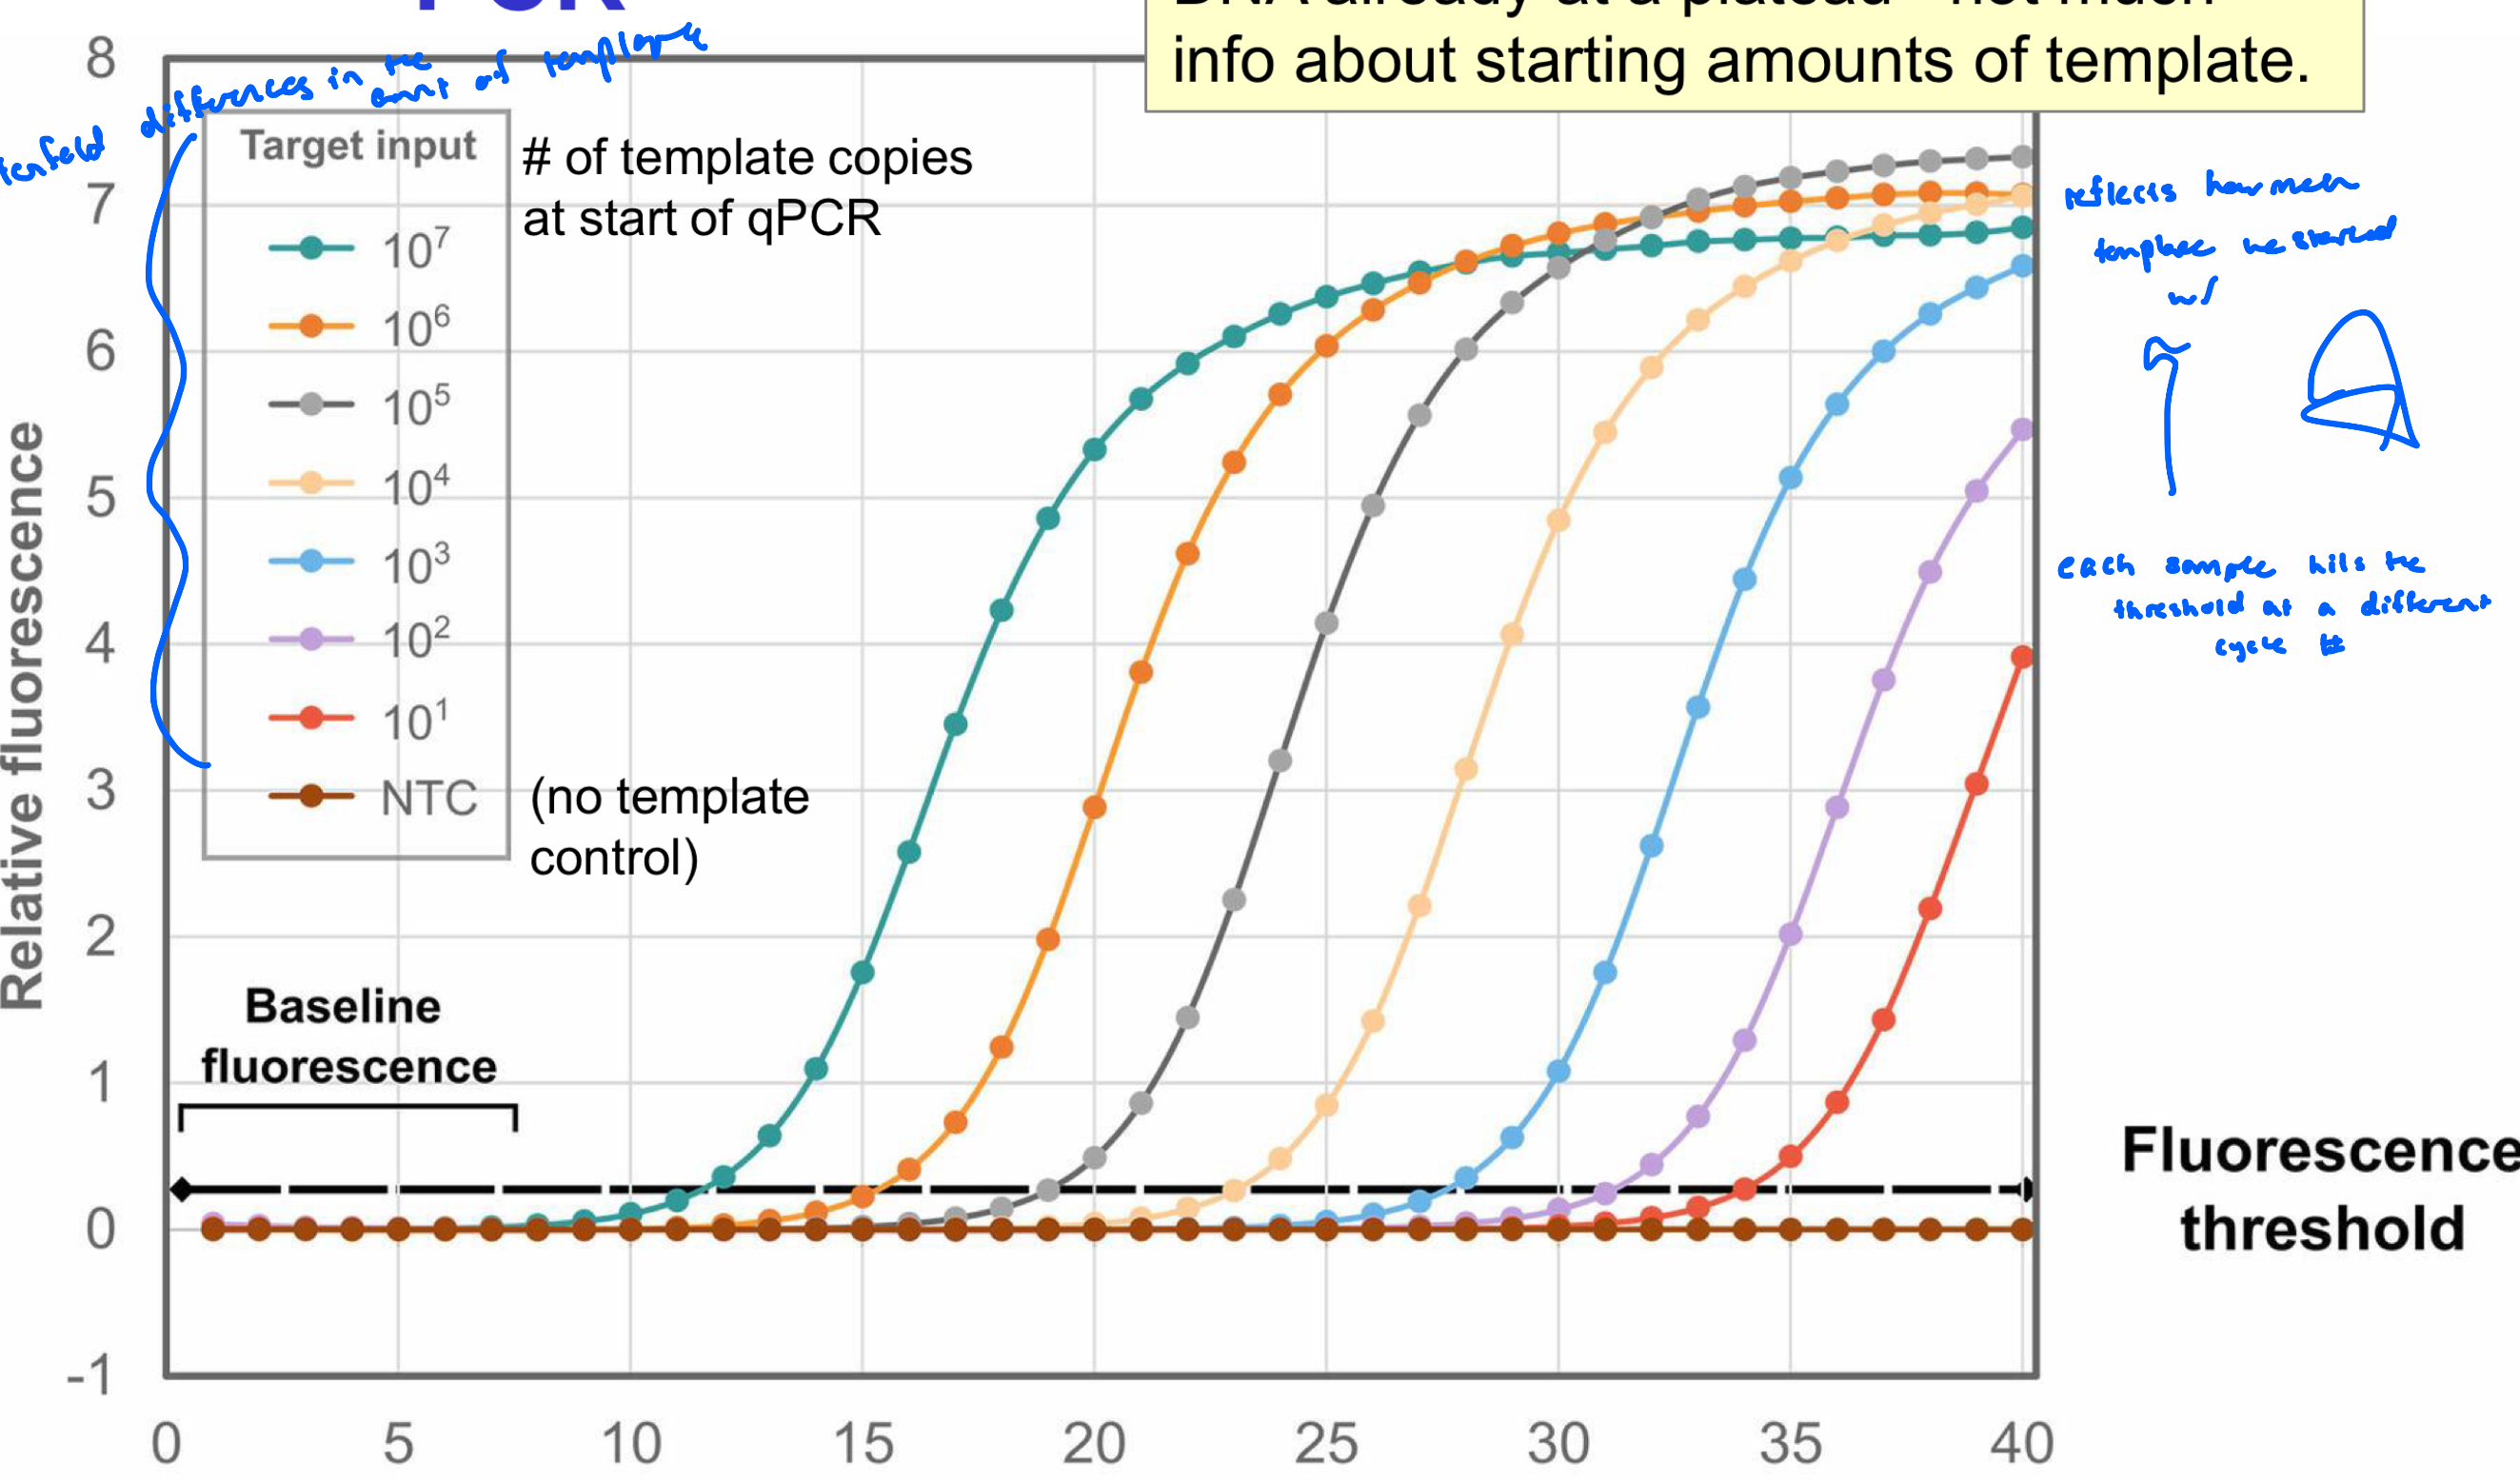
Model of Real-Time PCR
legend: tenfold differences in the amount of template
each sample hits the threshold at a different cycle number
reflects how much template we started w/
whatever hits the threshold first has more copies of template DNA
regular PCR and RT-PCR: amplified DNA already at a plateau (not much info about starting amounts of template)
Advantages/Disadvantages of RT-PCR and qRT-PCR
Advantages: fast, sensitive
Disadvantages: no information on transcript size
RT-PCR is crudely quantitative
subject to artifacts (contamination)
In Situ Hybridization
section organism/organ/tissue of interest
hybridize a gene specific probe to a tissue section on a slide, or to whole embryo if small
if any cells within the sectioned tissue have transcripts of the gene of interest (matches the probe), the probe will hybridize to those cells
detection of the probe will identify those cells
In Situ Hybridization: Advantages + Disadvantages
Advantages: provides precise information on spatial distribution of gene transcript
can be combined w/ time (take slices of organism at diff developmental time points)
can see where + when transcripts show
Disadvantages: difficult, time consuming, differences in tissue slice
not as quantitative as other methods (little information on amount of transcript)
not as sensitive/precise as quantitative PCR
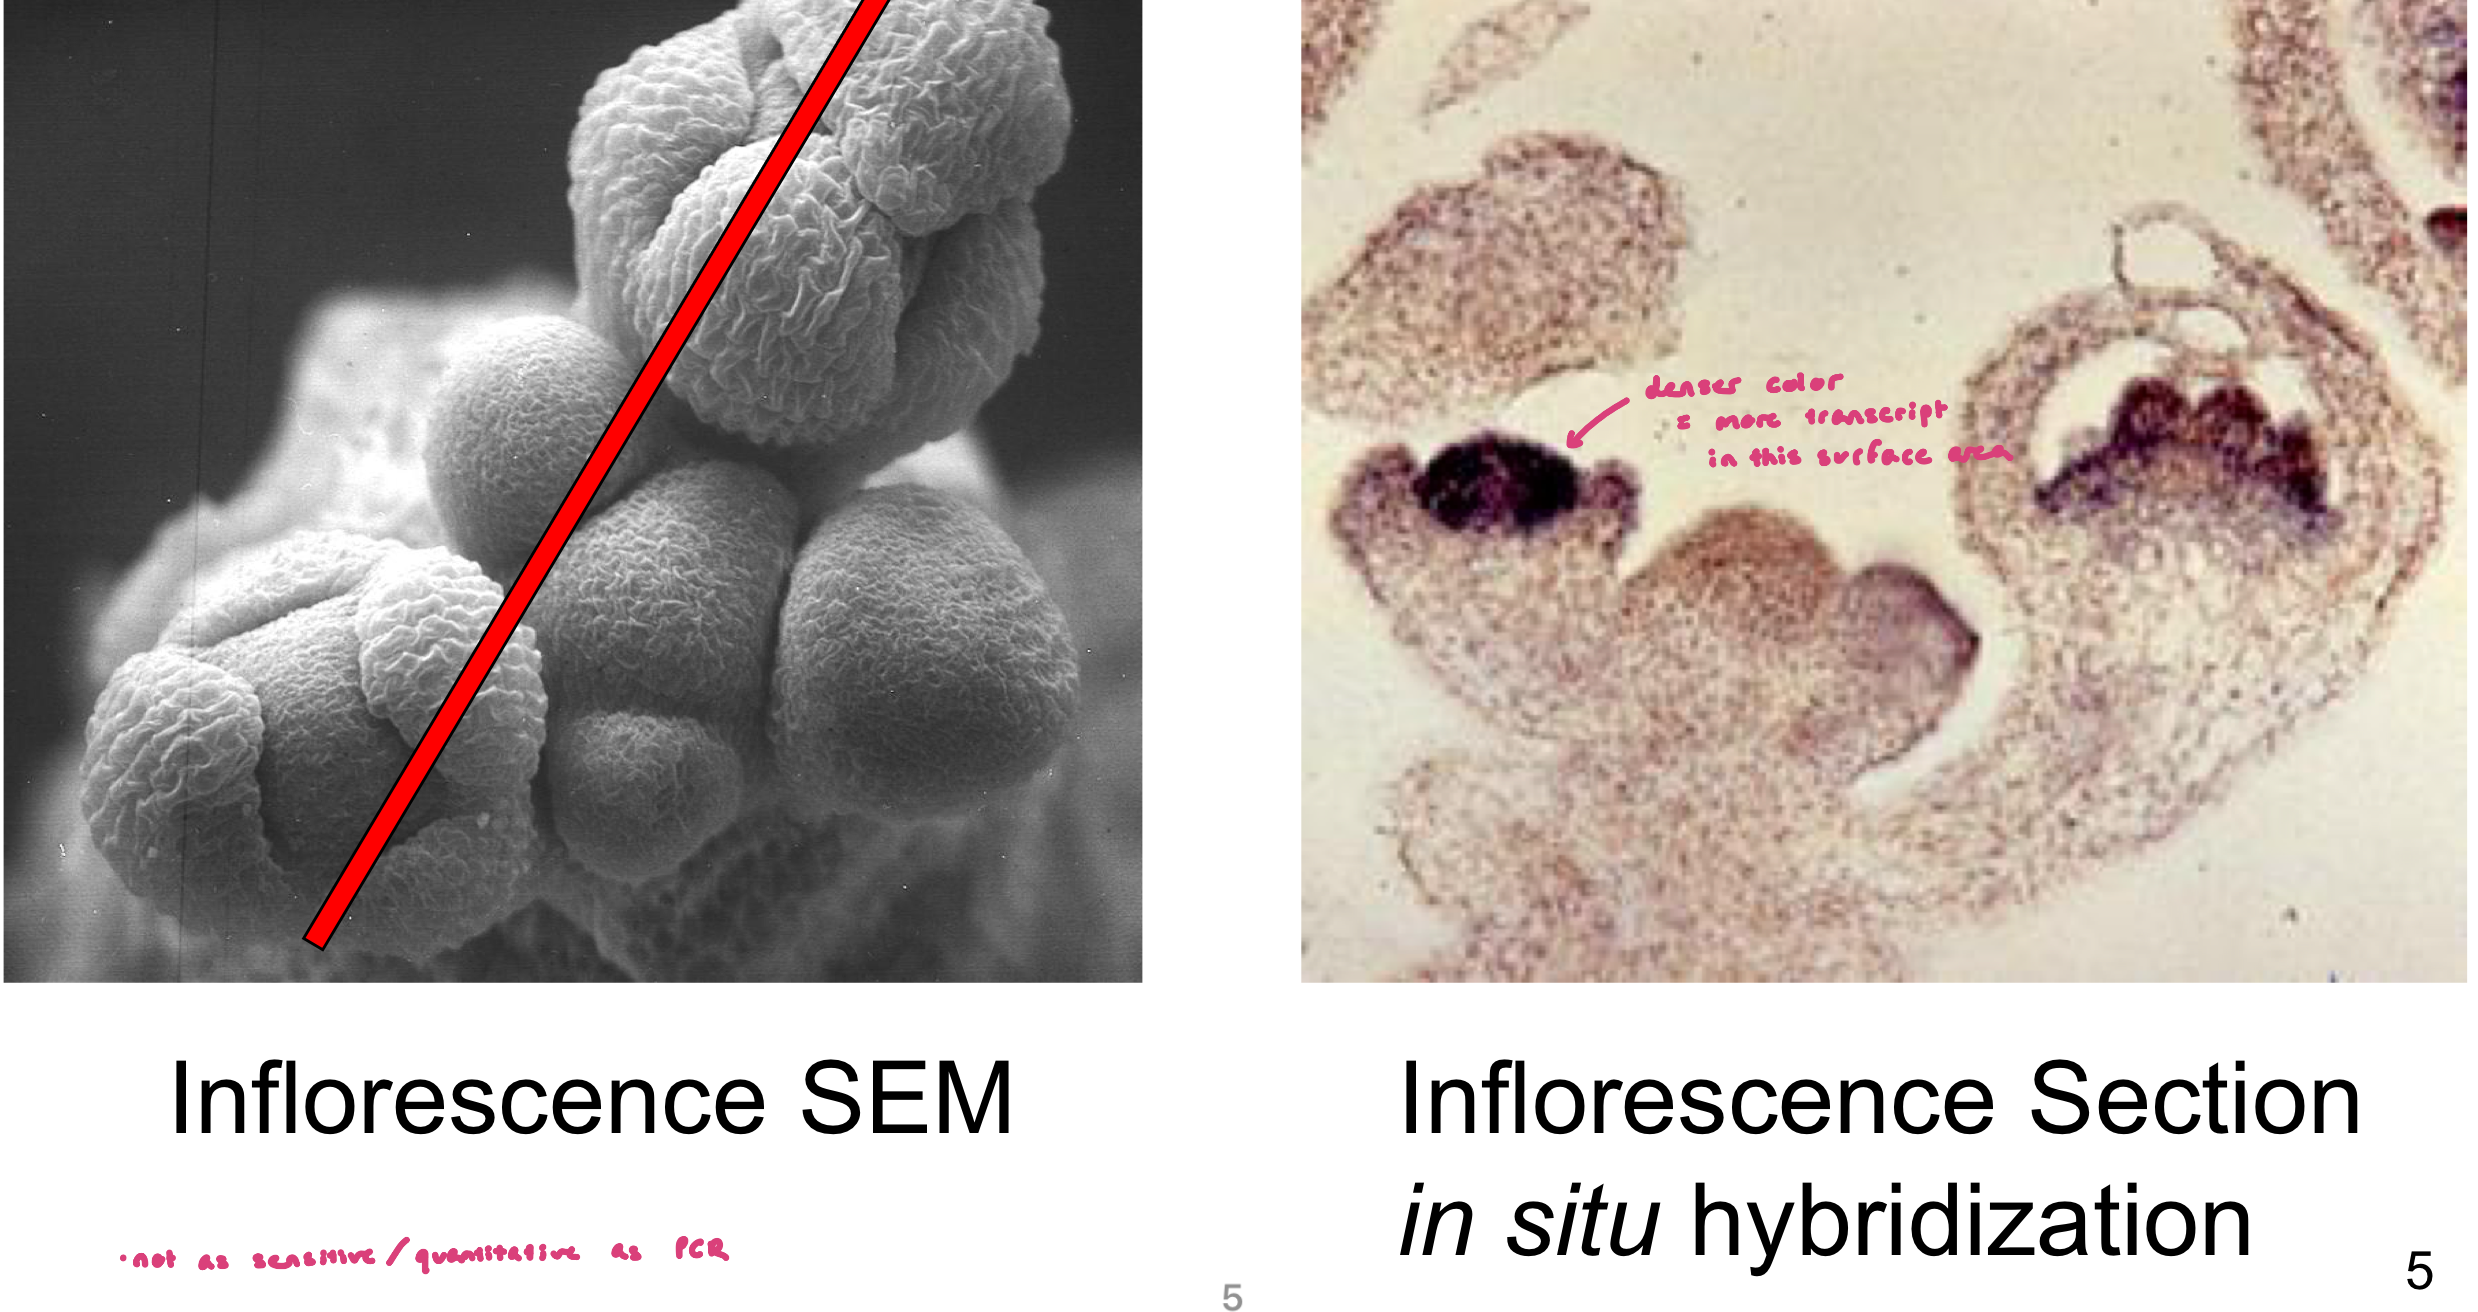
Example: Arabidopsis Floral Development
looking at where agamous gene might be transcribed (using tissue slice of developing bud since gene has to do w/ flower development)
imaging: Inflorescence SEM (surface structures), Inflorescence Section (transmitted light microscopy; internal structures)
AG gene-specific probe hybridized only to cells containing AG transcript. Probe appears as blue coloration
denser color = more transcript
Gene Expression in WT Tissue
gene specific probe hybridizes only to cells containing the target transcript
probe signal is visualized as a color change
denser color = more transcript in expected surface area
Consider:
does the observed expression pattern match what you would expect based on the gene’s known function?
can you estimate the abundance of transcripts in different cells or regions
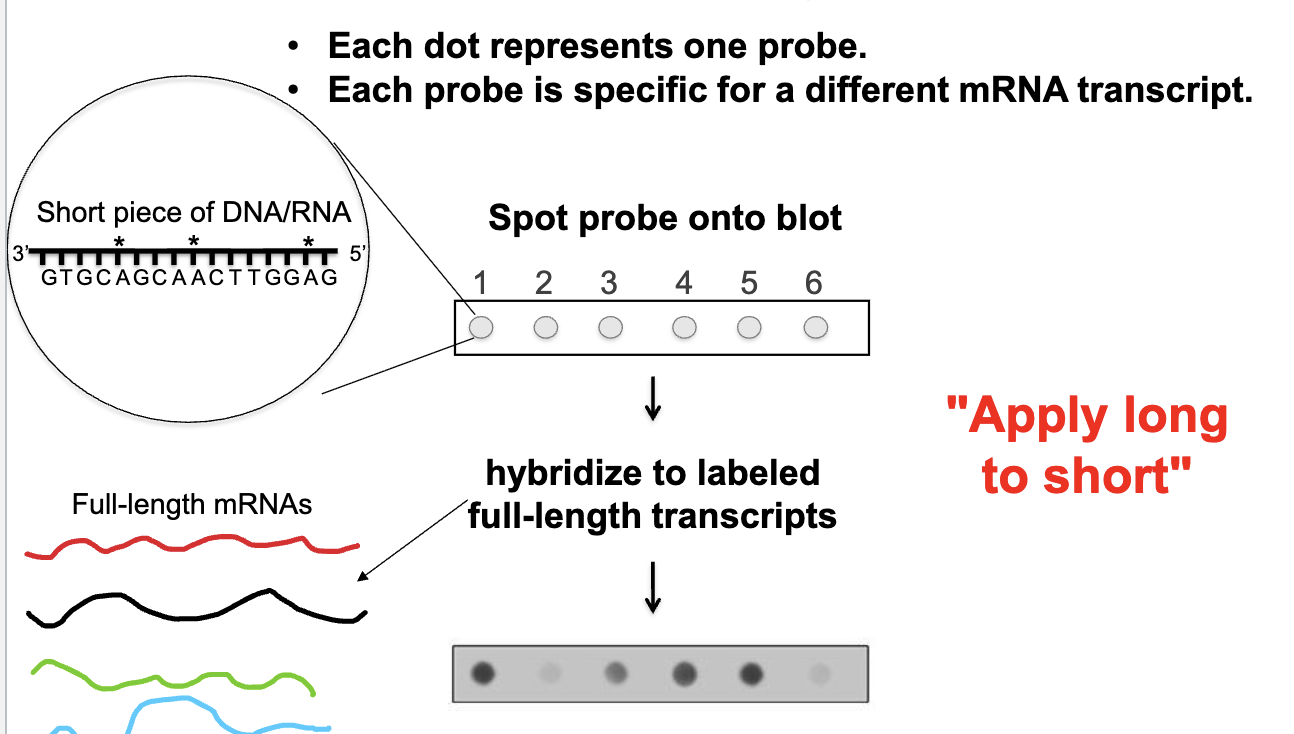
Microarray
each dot represents one probe
each probe is specific for a different mRNA transcript
looking at all transcripts that might be produced by cells/tissues at one time
spot different probes onto blot → hybridize to labeled full-length RNA transcripts
apply long to short: hybridizing something long against a short template
Microarray vs RNA Dot Blot
RNA Dot Blot: spot RNA onto blot → hybridize to a single labeled probe → wherever the probe binds is where a particular transcript is being expressed
doesn’t give information about size (little bit based on densities), may miss splice variants
short to long: hybridizing a short piece of nucleic acid to a longer one
Microarray: long to short
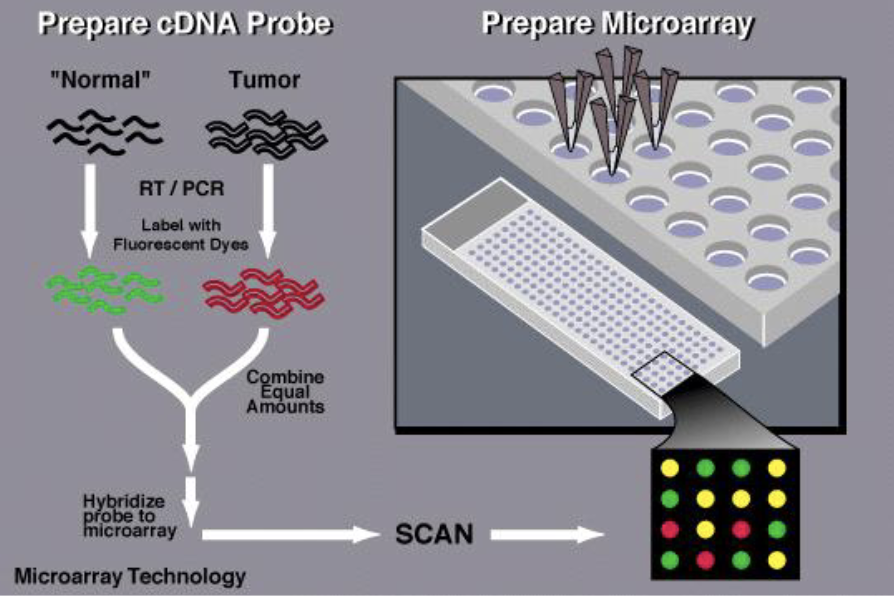
Microarray Hybridization
synthesize gene specific probes (oligonucleotides) for thousands of genes
array the probes on a hybridization membrane or chip
isolate RNA from a specific tissue/developmental time
need a reference sample and an experimental sample to see differences in gene expression
make labelled cDNA from the RNA
reference and experimental samples labelled w/ diff fluorescent dyes
hybridize equal amounts labelled cDNA to the array of probes and detect which probes hybridize to the population of cDNAs
Microarray Hybridization: Advantages + Disadvantages
Advantages: provides information on the amount of RNA transcript for every gene included in the array
Disadvantages: expensive, results must be repeated or verified by another technique, only a subset of genes/genome is represented on array
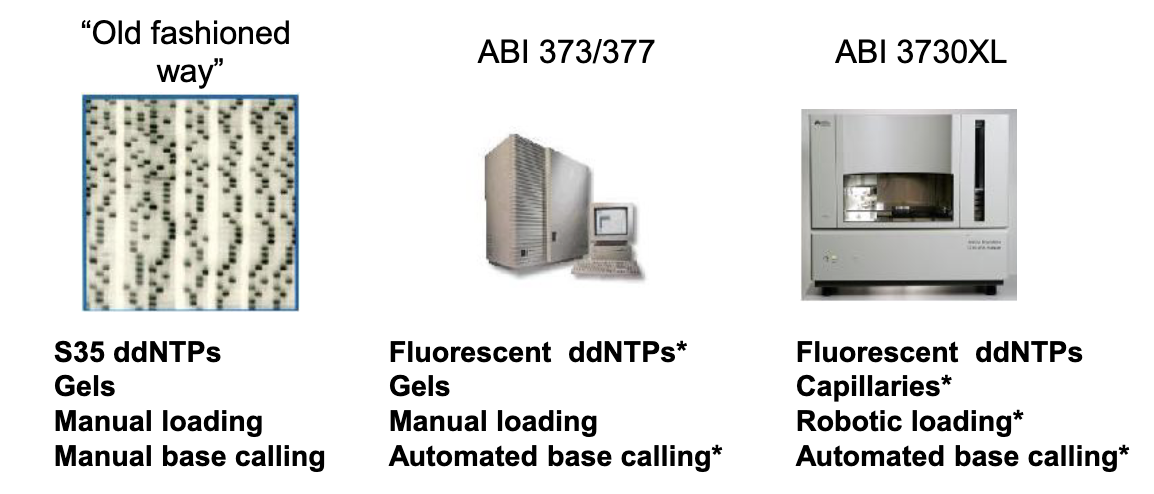
Past + Current Sequencing Technologies
all based electrophoresis, one sequence per lane capillary
Next Generation Sequencing: RNAseq Background
not based on electrophoresis
millions to billions of sequence reactions in parallel (massively parallel sequencing)
sequences are generally short (50-300 bp)
cost per base pair is much lower
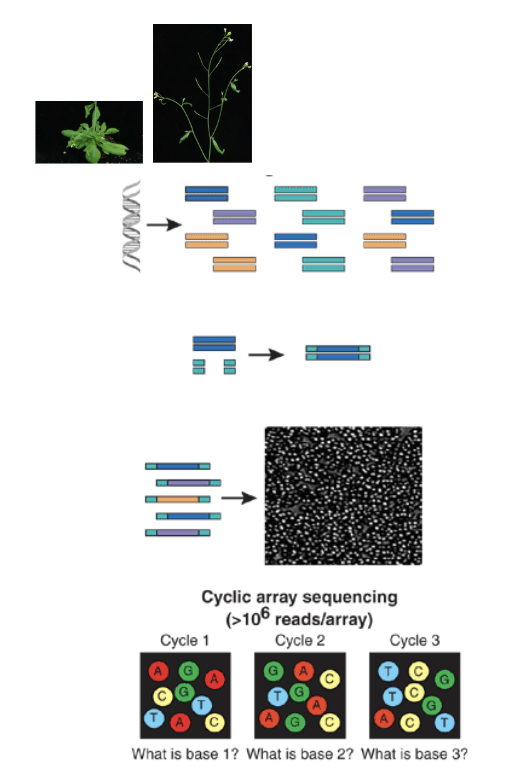
RNAseq Overview
isolate RNA from tissues
make cDNA and fragment to smaller pieces (thru RT-PCR)
more stable than RNA
add PCR adaptors to fragments
adding short DNA sequences of known sequence to both ends of unknown cDNAs
all cDNA fragments now flanked by known sequences
generate array of PCR colonies by bridge PCR (using primers against adaptors sequences)
i.e PCR carried out on fixed surface (membrane)
sequence each PCR colony
assemble PCR fragments into full sequence
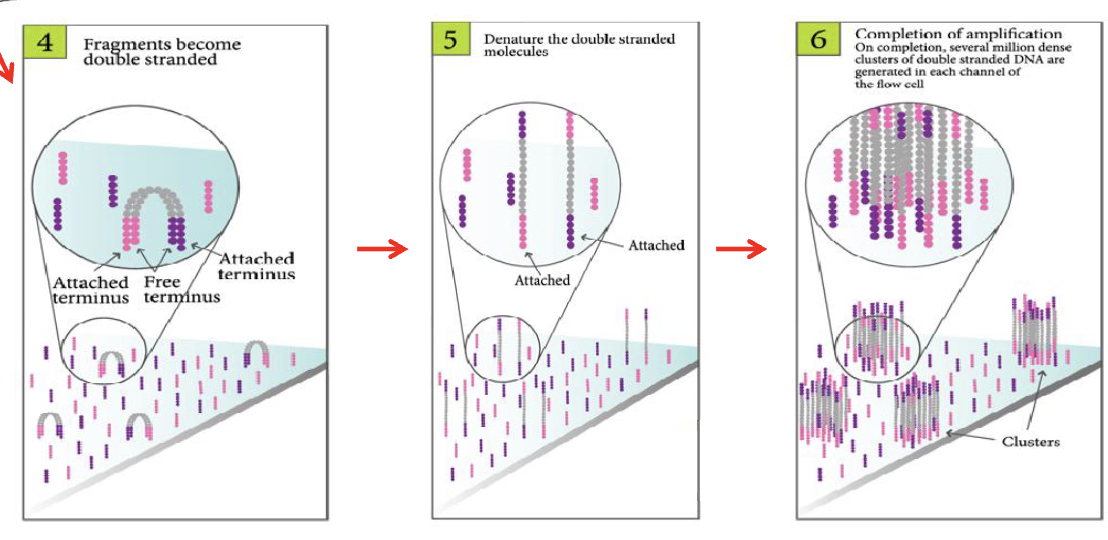
Bridge PCR: Key Ideas
randomly generated DNA fragments were ligated to adaptors in step 3
one end of each DNA fragment is fixed to a solid surface
surface is also coated w/ forward and reverse PCR primers that correspond to the adaptors
bends backwards to anneal to primers on chip → duplicate DNA → now have copied piece of DNA that’s also fixed at one end
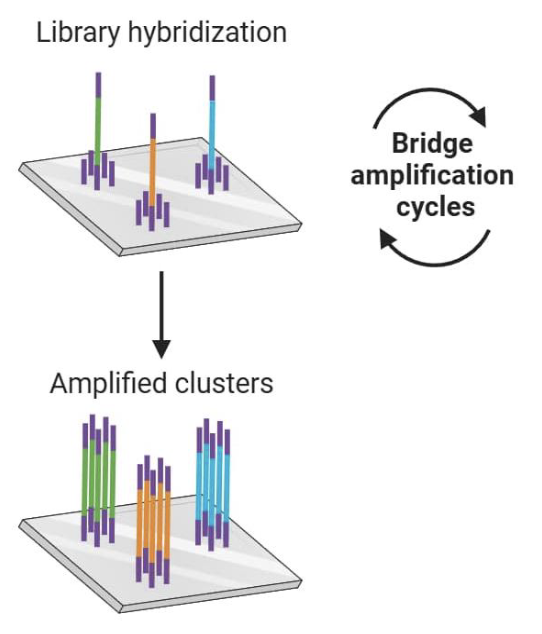
Bridge PCR
amplification proceeds in cycles, with one end of the DNA tethered to the surface
after several cycles, each amplified genomic fragment results in a cluster of fragments on the surface
each colony/spot represents a different PCR product, from a different fragment
we amplified everything to have enough fluorescence for a readout → can move onto sequencing step
Reversible Terminator Chemistry
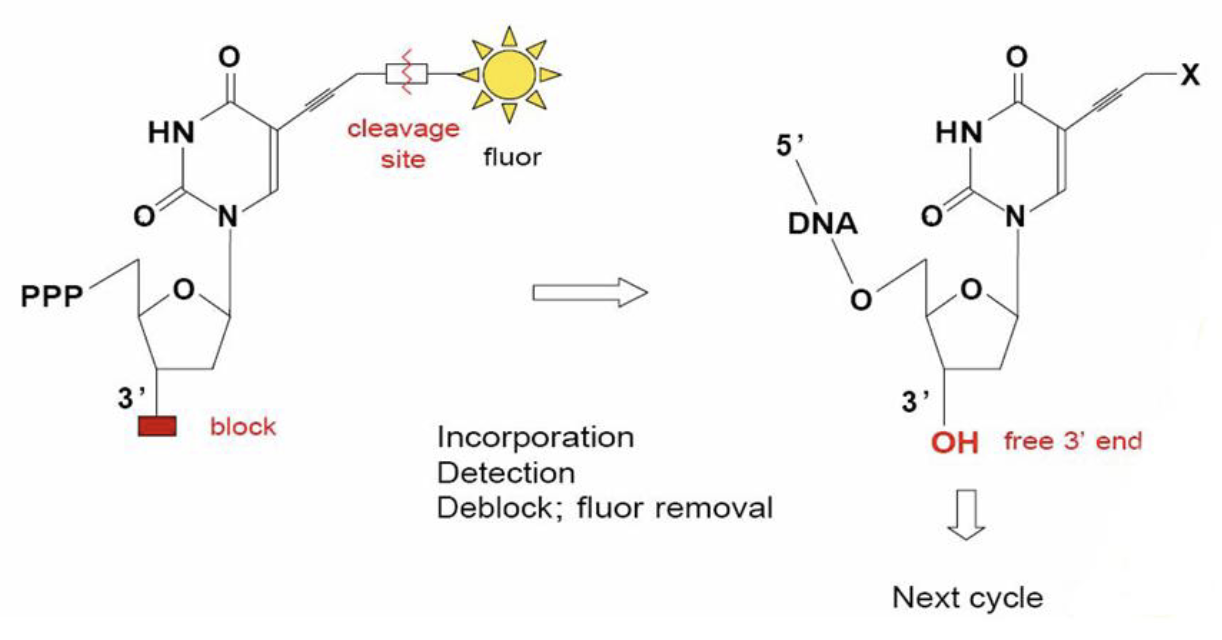
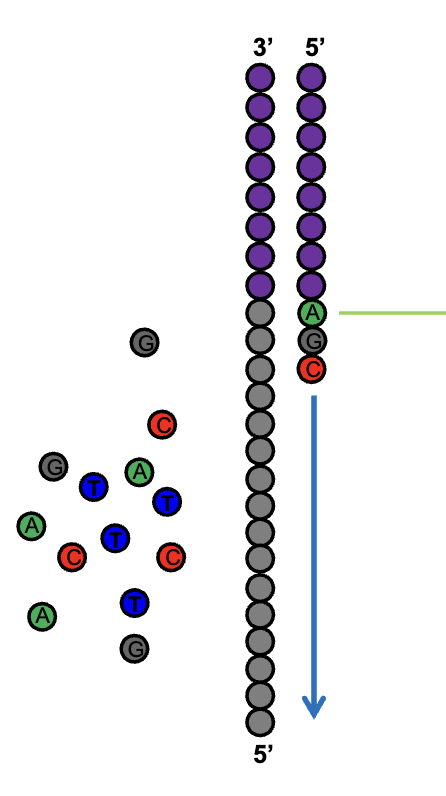
Sequencing by Synthesis
enzymatic extension w/ fluorescently tagged nucleotides
the sequence of each DNA fragment (each amplified into a cluster of identical fragments) is recorded simultaneously; the newly added base for each cluster is read w/ each cycle
Cycle 1: add sequencing reagents → first base incorporated → remove unincorporated bases → detect signal → cleave block and fluorescent groups
Cycle 2-n: add sequencing reagents and repeat
Sequencing Cycles Figure
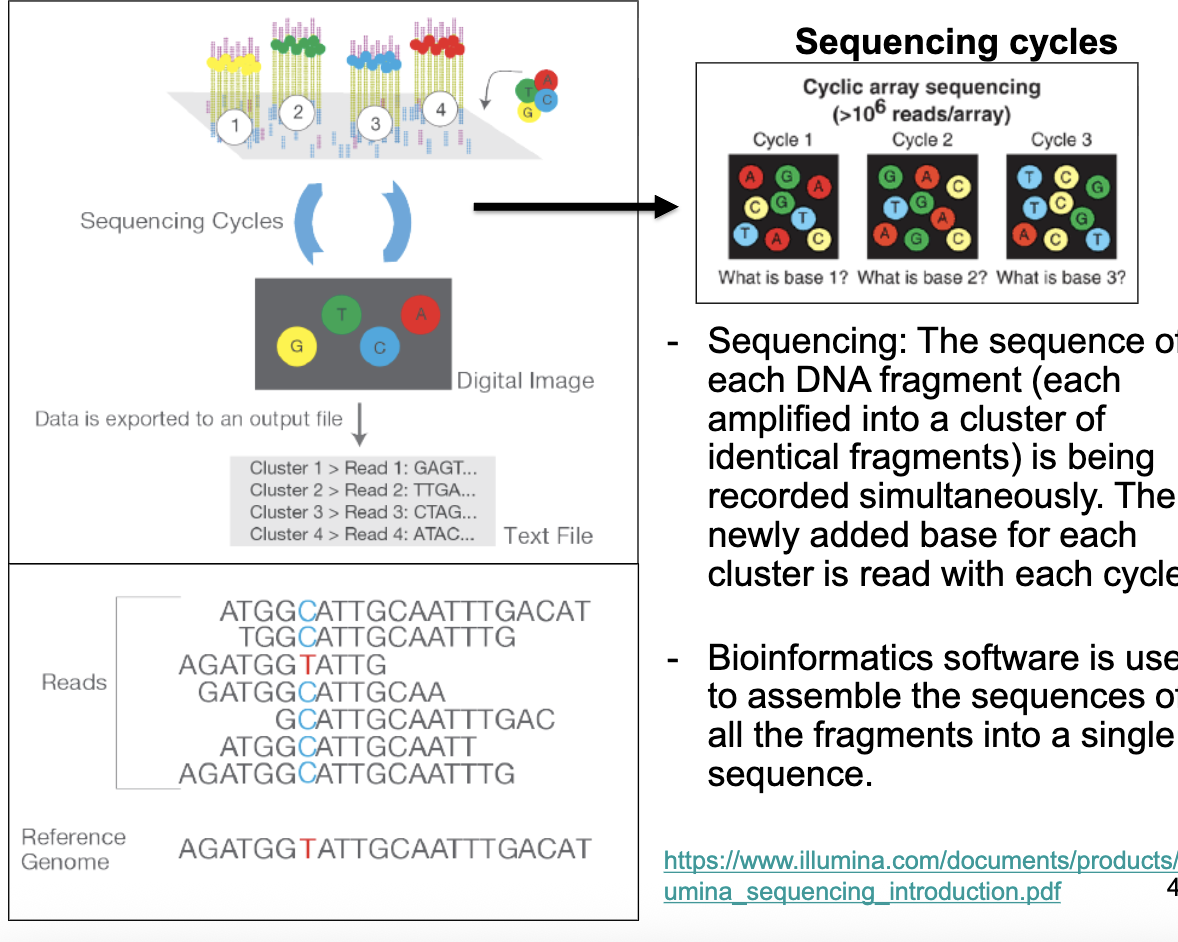
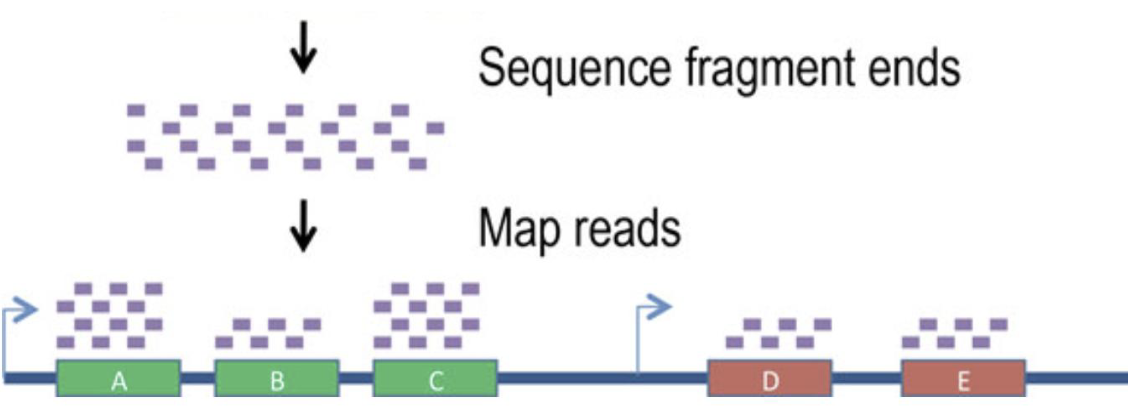
Assemble Fragments
computers used to assemble the sequences of all the fragments into a single sequence
see where sequence fragments are overlapping → allows assembly into longer sequence
if you have a reference genome, you can compare sequence against reference (helps w/ assembly)
quantitative method: the more a gene is transcribed = more sequence reads
can get info abt alternative splicing (how many exons, how often expressed)
RNAseq: Advantages vs Disadvantages
Advantages: sensitive, quantitative, provides information on all transcripts
Disadvantages: relatively expensive, spatial information is lost, need to assemble into full sequences