ECON002 Exam Study Guide: Key Concepts and Terms
1/653
There's no tags or description
Looks like no tags are added yet.
Name | Mastery | Learn | Test | Matching | Spaced | Call with Kai |
|---|
No analytics yet
Send a link to your students to track their progress
654 Terms
Unlimited Wants
Desire for goods exceeds available resources.
Limited Resources
Finite inputs available for production.
Ceteris Paribus
Assumes all else remains constant.
Positive Statement
Factual claim that can be tested.
Normative Statement
Opinion-based claim about what ought to be.
Scarcity
Fundamental economic problem of limited resources.
Labor
Human effort in producing goods and services.
Land
Natural resources used in production.
Endogenous Variables
Variables explained by the model.
Exogenous Variables
Variables taken as given in the model.
Circular Flow Model
Describes flow of resources and money in economy.
Production Possibilities Curve
Graph showing trade-offs between two goods.
Opportunity Cost
Value of the next best alternative forgone.
Increasing Opportunity Cost
More production leads to greater sacrifices of other goods.
Marginal Cost
Cost of producing one additional unit of a good.
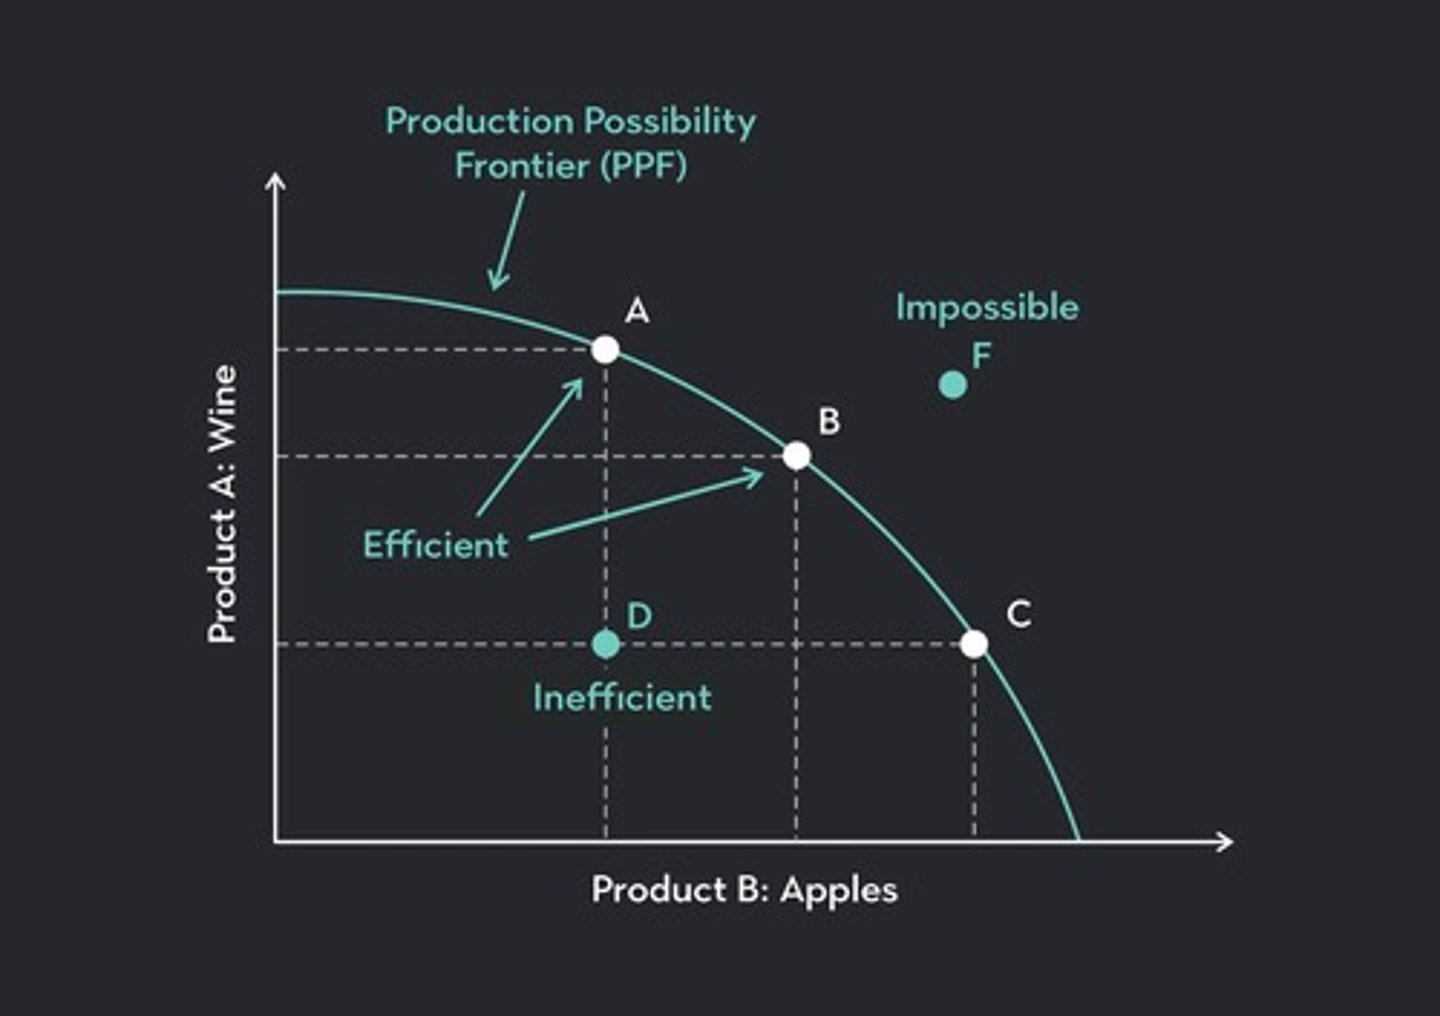
Production Possibility Frontier (PPF)
Illustrates maximum production capabilities of an economy.
Technological Advancement
Discovery that improves production efficiency.
Unattainable Points
Points outside the production possibilities frontier.
Attainable Points
Points within the production possibilities frontier.
Fully Utilizing Resources
Producing on the production possibilities frontier.
Concave PPF
Indicates differing resource efficiency for goods.
Revenue in Goods Market
Income firms earn from selling products.
Inputs in Factor Market
Resources firms purchase for production.
Empirical Evidence
Data used to conduct positive economic analysis.
Value Judgments
Assessments based on personal beliefs or opinions.
Trade-offs
Choices made when allocating limited resources.
Economic Models
Simplified representations of economic processes.
Production Efficiency
Optimal use of resources to produce goods.
Production efficiency
Achieved when producing on the PPF.
PPF
Production Possibility Frontier; shows maximum output.
Comparative advantage
Ability to produce at lower opportunity cost.
Specialization
Focusing production on specific goods.
Trade
Exchange of goods to benefit both parties.
Opportunity cost
Value of the next best alternative foregone.
Alice's opportunity cost of shoes
0.8 bookshelves per pair of shoes.
Alice's opportunity cost of bookshelves
1.25 pairs of shoes per bookshelf.
Roger's opportunity cost of shoes
0.6 bookshelves per pair of shoes.
Roger's opportunity cost of bookshelves
1.667 pairs of shoes per bookshelf.
Law of demand
Quantity demanded inversely related to price.
Movement along supply curve
Change in quantity supplied due to price change.
Law of supply
Producers reduce quantity supplied when prices fall.
Supply increase
Shift rightward in the supply curve.
Demand for pizza unchanged
No change in price of pizza.
Demand curve for donuts
Shifts right if coffee price declines.
Supply curve shift left
Caused by increased production costs.
Shortage
Quantity demanded exceeds quantity supplied.
Equilibrium price increase
Indicates increased demand for coffee.
Price below equilibrium
Causes a shortage in the market.
Surplus
Occurs when quantity supplied exceeds quantity demanded.
Equilibrium price fall
Results from decreased demand and increased supply.
Price of good falls
Occurs when there is a surplus.
Leftward shift in supply curve
Caused by increased production costs or regulations.
Leftward shift in supply curve
Caused by increased wage rates for refinery workers.
Cod supply curve shift
Government limits fish catch, reducing supply.
Market price below clearing level
Creates upward pressure on current market price.
Shortage in bread market
Occurs when actual price is below equilibrium.
Nursing services shortage
Increased demand leads to higher nursing wage rates.
Price ceiling on milk
Government sets price above equilibrium, causing surplus.
Surplus of milk
Quantity supplied exceeds quantity demanded at higher price.
Demand curve shift for good X
Rightward shift increases existing shortage.
Government price control effects
Some sellers find buyers; others do not.
Consumer benefits from price controls
Lower prices help some, but supply may be insufficient.
Non-binding price ceiling
Maximum price above current equilibrium price.
Binding price floor
Minimum price set above equilibrium causes excess supply.
Value of a good
Maximum price willing to pay for it.
Total surplus definition
Sum of consumer surplus and producer surplus.
Allocatively efficient market
Maximizes total consumer and producer surplus.
Efficient resource use
Maximizes sum of consumer and producer surplus.
Consumer surplus in equilibrium
No requirement to be less than or equal to producer surplus.
Economic inefficiency sources
Rapid technological change is not a source.
Deadweight loss
Decrease in consumer and producer surplus from inefficiency.
Tax impact on goods
Increases buyer's price, decreases seller's received price.
Sales tax on gasoline
Imposed on sellers, affecting market prices.
Sales Tax
Tax imposed on sellers of goods.
Supply Curve Shift
Movement of supply curve due to tax.
Tax Burden
Division of tax costs between buyers and sellers.
Elasticity of Demand
Responsiveness of quantity demanded to price changes.
Inelastic Demand
Buyers are less responsive to price changes.
Inelastic Supply
Sellers cannot easily change production levels.
Binding Price Ceiling
Regulation to keep prices below market equilibrium.
Price Floor
Minimum price set above equilibrium price.
Rent Control
Price ceiling that caps rent below equilibrium.
Opportunity Cost
Cost of time spent searching for apartments.
Quantity Demanded
Higher when price is below market price.
Surplus
Excess supply when price floor is above equilibrium.
Minimum Wage
Binding price floor in the labor market.
Labor Supply Increase
More workers willing to work at higher wages.
Labor Demand Decrease
Fewer workers hired due to higher costs.
Externality
Costs or benefits affecting third parties.
External Benefit
Positive effect on third parties from consumption.
Free-Rider
Benefits from a good without paying.
Free-Rider Problem
Lack of incentive to pay for consumption.
Non-Excludable Good
Cannot prevent others from benefiting.
Excludable Good
Possible to restrict access to benefits.
Non-Rival Good
One person's use does not reduce availability.
Public Good
Non-excludable and non-rival in consumption.
Production Function
Relationship between inputs and output levels.
Output Change
Variation in output with changes in input.
Variable Input
Input that can be changed in production.
Efficiency Quantity
Optimal output level for public goods.