Chapter 4 Free Response
1/12
There's no tags or description
Looks like no tags are added yet.
Name | Mastery | Learn | Test | Matching | Spaced | Call with Kai |
|---|
No analytics yet
Send a link to your students to track their progress
13 Terms
Describe each of the following immune responses, including
identifying whether is it innate or adaptive, identifying what
initiates the response, what is targeted by the response, and
identifying a taxon that exhibits this type of response.
PAMP-triggered Immunity
Systematic Acquired Response (SAR)
Hemocyte Response
Humoral Immune Response
Cell-mediated Response
PAMP-triggered Immunity -
1) innate immunity
2) recognition of PAMPs by pattern recognition on host cells
3) bacteria and fungi based on their PAMPs
4) Plants
Systematic Acquired Response (SAR) -
1) Innate
2) local infection or wounding in plants
3) broad protection against infections by pathogens
4) plants
Hemocyte Response -
1) innate
2) pathogens or tissue damage
3) pathogens
4) invertebrates (arthropods)
Humoral Immune Response -
1) adaptive
2) detection of antigens by B cells
3) bacteria, viruses, toxins
4) vertebrates
Cell-mediated Response -
1) adaptive
2) antigens on infected or abnormal host cells by T cells
3) intercellular pathogens
4) vertebrates
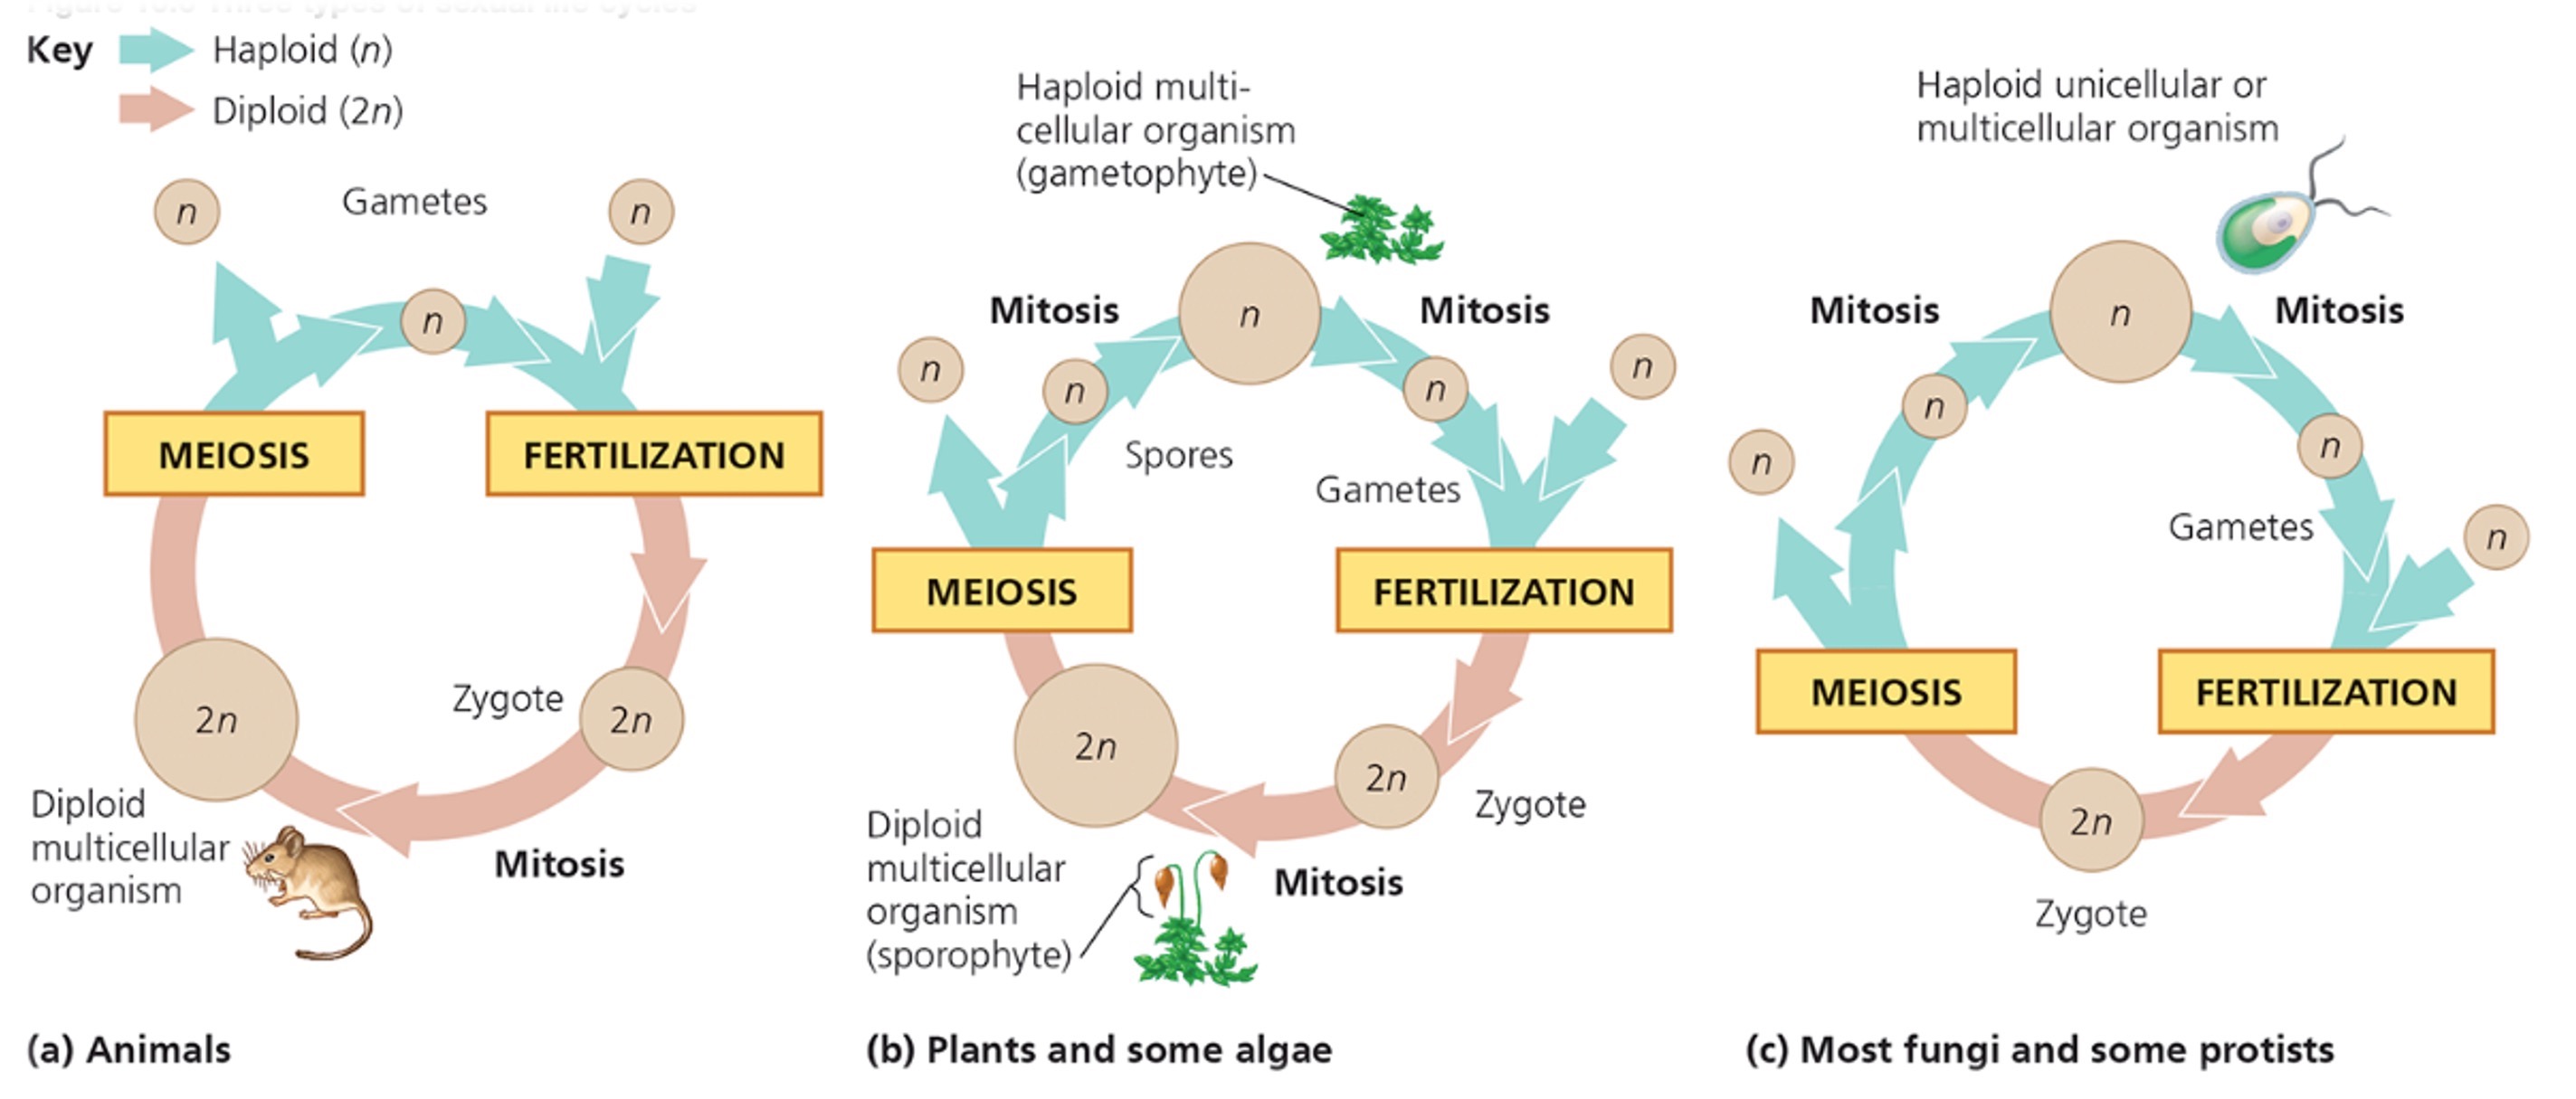
Draw and label a generalized sexual life cycle for each
of the following:
§ Animals
§ Plants
§ Fungi
Your diagram should include meiosis, fertilization, at least one
correct place where mitosis occurs in the life cycle, gametes,
spores (if applicable), zygote, and multicellular organism. Your
diagram should indicate which part of the life cycle is haploid (n)
and which part is diploid (2n)
Briefly describe (1-2 sentences) what is meant by alternation of
generations. What is a sporophyte? What is a gametophyte? Be
sure to include whether each is haploid or diploid, what type of
cells it produces, and whether those cells are produced through
mitosis or meiosis. Explain which is the dominant life stage for
each of the following plant groups:
§ Non-vascular plants
§ Seedless vascular plants
§ Seed plants
Alternation of generations: It is a life cycle in plants in which a multicellular haploid gametophyte generation alternates with a multicellular diploid sporophyte generation, each producing the other through reproduction.
Sporophyte: the diploid (2n) stage that produces haploid spores by meiosis
Gametophyte: the haploid (n) stage that produces haploid gametes by mitosis
Non vascular plants Seedless: gametophyte
Seedless vascular plants: sporophyte
Seed plants: sporophyte
Briefly describe the difference between primary and secondary
growth in plants. What is the main site of cell division for primary
growth in roots? What is the primary site of cell division for
primary growth in shoots? What is one function of the root cap?
What do leaf primordia develop into? What do axillary buds
develop into? What is the main site for secondary growth? Where
are new layers of xylem and phloem produced? Describe the major
developmental difference between the two groups of angiosperms,
monocots and eudicots
1) primary growth - increases length
Secondary growth - increases thickness
2) roots: apical meristem
Shoots: shoot apical meristem
3) root caps protect the apical meristem and eases the root movement
4) leaf primordial develops into mature leaves
5) auxiliary buds develop into branches and flowers
6) lateral meristems (vascular and cork cambiums)
7) vascular cambium xylem (inside) phloem (outside)
8) Monocots - one cotyledon (vascular bundle)
Eudicots - two cotyledon (vascular bundles in a ring)
In each of the two major groups of seed plants
(gymnosperms and angiosperms), where would you find
the male and female gametophytes? What occurs
during double fertilization in angiosperms? What is
endosperm? Explain why seeds represent an adaptation
to terrestrial life
1) gymnosperms:
male gametophyte: in pollen grains
Female gametophyte: in ovules
Angiosperms:
male gametophyte: pollen grains
Female gametophytes: embryo sac inside the ovule
2) double fertilization:
One sperm fertilizes the egg → forms the zygote
Another sperm fuses with two polar nuclei → forms triploid endosperm
3) endosperm:
nutrient-rich tissue (usually triploid) that provides food for the embryo
Unique to angiosperms due to double fertilization
4) seeds are an adaption
protect the embryo from drying out
Provide stored food for early growth
Allow dispersal over long distances without needing water for fertilization
Can remain dormant until conditions are favorable
Name and describe the four stages of embryonic development
in animals. What is the major difference between diploblasts and
triploblasts? What is the major difference between protostomes
and deuterostomes? Provide an example of an organism that
belongs to each of those four groups
1) fertilization:
sperm and egg fuse → zygote forms
Restores the diploid chromosome number
2) cleavage:
rapid mitotic divisions of the zygote
Produces a morula (solid ball of cells) and then a blastula (hollow ball of cells)
3) gastrulation
cells rearrange to form germ layers (ectoderm, mesoderm, endoderm)
Blastopore (opening) forms
4) organogenesis
germ layers differentiate into tissue and organs
Nervous system, muscles, and other organs stat forming
Diploblasts vs triploblasts
Diploblasts: 2 germ layers
Tripoblasts 3 germ layers
Protostomes vs deuterostomes
Protostomes:
Blastopore: becomes mouth first
Cleavage: spiral, determinate
Coelom foundation: splitting of mesoderm
Deuterostome:
Blastopore: becomes anus first
Cleavage: radial, indeterminate
Coelom foundation: out-pocketing of archenteron
Examples of each group
Diploblasts: jellyfish
Triploblasts: earthworm
Protostomes: grasshopper
Deuterostomes: human
Define ecology. name and briefly describe (1-2 sentences each) the six levels that compose the hierarchical organization of ecological research
Ecology:is the study of interactions between organisms and their environments.
1) organismal
2) population
3) community
4) ecosystem
5) landscape
6) biosphere
escribe four different factors that limit species
distributions with a specific example of how they limit
species distributions. State whether each of the four
factors you chose is an abiotic or biotic factor and
include at least one of each. Several of these factors also
influence population dynamics. Provide definitions for
population and population dynamics
1) temperature (abiotic)
many species can only survive within a certain temperature range
Tropical plants will freeze in cold climates
2) water availability (abiotic)
organisms need water for survival
Cacti are adapted to deserts
3) food availability (biotic)
food availability limits where organisms can live
Giant pandas only live where bamboo grows cause it solely relies on it for food
4) predation (biotic)
predators prevent prey species from living in certain areas
Sea urchin populations are limited where predators like otters are abundant
Definitions:
Population:
A group of individuals of the same species living in the same area at the same time.Population dynamics:
The study of how and why populations change over time, including factors like birth rates, death rates, immigration, and emigration.
Define population density and dispersion. Name and
describe three types of dispersion patterns that can be
observed in nature. For one of these patterns, give
examples of two different processes that could have led
to the same pattern. What two factors add individuals to
a population? What two factors remove individuals from
a population? What is a metapopulation
Population density:
The number of individuals of a species per unit area or volume (e.g., per square kilometer).Dispersion:
The pattern of how individuals are spaced within a population.
Three types of dispersion patterns
1) Clumped dispersion
individuals grouped together in patched
Common when resources are unevenly distributed
2) uniform (even) dispersion
individuals are spaced evenly apart
Competition or territorial behavior
3) random dispersion
individuals are distributed unpredictably
When resources are abundant and interactions between individuals are minimal
Two processes leading to to the same pattern (clumped dispersion)
patchy resources: individuals gather where food or water is available
Social behavior: individuals stay together for protection, mating, or cooperation
Factors affecting population size
1) add individuals
births (natality)
Immigration (individuals moving into the population)
2) Remove individuals
deaths (mortality)
Emigration (individuals leaving the populations)
Metaopulation
A metapopulation is a group of spatially separated populations of the same species that interact through migration.
Local populations may go extinct, but the overall metapopulation persists because individuals can recolonize empty areas.
Write the equation and draw a simple graph for the exponential
growth model. You do not need to have numbers on your axes, but
you should know what is represented on the vertical, or y-axis, and
what is represented on the horizontal, or x-axis, and you should be
able to explain the shape of the curve. Thinking about what adds
individuals to a population, why is the curve J-shaped – that is, why
does the curve start out relatively flat and then get steeper and
steeper as you move to the right? What are the two factors that
influence the population growth rate (dN/dt) in the exponential
growth model? What is the main assumption of the exponential
growth model related to resource availability? How do larger
values of r influence population growth
dN/dt = rN
Y-axis: population size
X-axis: time
Shape: j-shaped curve
is j shaped because the fewer in the population the fewer the reproduction, but the more is in the population the more is produces
Population size and intrinsic rate of increase
Unlimited resources And no environmental resistance
Larger r → faster population growth
The curve becomes steeper more quickly
Write the equation and draw a simple graph for the logistic growth
model. You do not need to have numbers on your axes, but you should
know what is represented on the vertical, or y-axis, and what is
represented on the horizontal, or x-axis, and you should be able to
explain the shape of the curve. Why is the curve S-shaped – that is, why
does the curve start out relatively flat, get steeper, and then become flat
again? How does the logistic growth model equation differ from the
exponential growth model equation? What is carrying capacity (K)?
What happens to the equation (and to the population growth rate,
dN/dt), when N = K? What happens when N is larger than K? What
happens when N is much, much smaller than K? When is the overall
population growth rate the highest in the logistic growth model? Why?
(Hint: think about what adds individuals to a population and what
happens in terms of resource availability as the population grows)
dN/dt = rN (K-N /K)
N = population size
r = intrinsic rate of increase
K = carrying capacity
dN/dt = population growth rate
Y-axis: Population size (N)
X-axis: Time (t)
Shape: S-shaped (sigmoidal curve)
Beginning is flat cause of small population
Middle is steep due to reproduction
End becomes flat because sources become limited
How it differs from exponential growth
Exponential: dNdt=rN (no limits)
Logistic: includes (K−N/ K), which reduces growth as N approaches K
Carrying capacity (K)
The maximum population size the environment can sustainably support.
What happens at different values of N?
When N = K:
K−NK=0⇒dN/dt=0KK−N=0⇒dN/dt=0
→ Population stops growing (stable).
When N > K:
(K−N)<0⇒dN/dt<0(K−N)<0⇒dN/dt<0
→ Population decreases (too many individuals for available resources).
When N ≪ K (much smaller than K):
K−NK≈1KK−N≈1
→ Growth is nearly exponential (resources abundant).
When is population growth rate highest?
When N ≈ K/2
Why?
There are enough individuals reproducing (large N)
But resources are still abundant (not yet limited)
This creates the maximum balance between reproduction and resource availability, leading to the fastest growth.
What is demography? What does a life table
summarize? Why do demographers typically consider
females only when constructing a life table? How is
reproductive output measured? Why might the age of
individuals be important to consider when measuring
reproductive rates
Demography
The study of the size, structure, and dynamics of populations over time, including birth rates, death rates, and age distribution.
Life table
A life table summarizes:
Survivorship (how many individuals survive to each age)
Mortality rates (death rates at different ages)
Often also includes reproductive output by age
Why females are typically used
Females are usually the limiting factor in reproduction because they invest more energy in producing offspring (eggs, pregnancy, care).
Tracking females gives a more accurate estimate of population growth potential.
How reproductive output is measured
Measured as the average number of female offspring produced per female at each age (often called age-specific fecundity).
Why age matters for reproductive rates
Individuals typically:
Do not reproduce when very young
Reach a peak reproductive age
Have declining reproduction as they age
So, the age structure of a population strongly affects overall population growth.
Example: A population with many individuals in reproductive age will grow faster than one with mostly older individuals.
Draw the basic shape of a Type I, Type II, and Type III
survivorship curve including the axis labels. What does
each type of curve tell you about the number of
individuals surviving in a population throughout an
organism’s life span? Provide an example of an organism
that exhibits each type of survivorship curve
Y-axis: Number of survivors (often shown as % surviving)
X-axis: Age
Type 1
high survival through early and middle ice
Most individuals die at old age (humans)
Type 2
constant death rates throughout life
Equal chance of dying at any age (birds)
Type 3
very high mortality early life
Few individuals survive to adulthood, but those who do live longer (oysters)