Lesson 2: Static Demography
1/44
There's no tags or description
Looks like no tags are added yet.
Name | Mastery | Learn | Test | Matching | Spaced | Call with Kai |
|---|
No study sessions yet.
45 Terms
What is demography?
science that statistically studies the structure and dynamics of the populations
What is the target of demography?
human population, defined as a group of people that live in a specific geographical area, at a given time.
What are the characteristics of a population?
Size
age
sex
race
level of education
location
What causes population variation?
Births, deaths, emigrants, and immigrants.
How do individuals enter and leave a population?
Individuals enter through birth and leave through death; changes also occur when people change their usual place of residence.
What are the uses of demography in Public Health?
The elaboration of rates and other health indexes
Carrying out epidemiological studies
Public Health management and planning
What are the two branches of demography?
Static demography and dynamic demography.
What does static demography study?
size and composition of a population at a specific moment.
(Age, number, sex, nationality….)
What sources belong to static demography?
Census, poll, civil registration, population surveys.
What is dynamic demography?
The branch that studies population over time, meaning changes due to births, mortality, and migrations.
What is a census?
The fundamental source of data for static demography; according to the UN, a census collects, summarises, analyses and publishes demographic, economic, and social data of all inhabitants of a country or delimited territory at a given time.
What are the aims of a census?
Counting the population, knowing the structure of the population, knowing the evolution of the population, enabling demographic analysis.
What data does a census collect?
Number of individuals, age, date of birth, sex, marital status, place of birth, nationality, spoken language, level of education, occupation, economic characteristics, children per woman, nuptiality, residence status.
What is the “in fact” population?
The sum of residents and transients (passersby).
What is the “population with rights”?
The sum of residents present + residents absent (with habitual residence, registered).
What is the resident population?
Term equivalent to “population with rights.”
What is the linked or related population?
People resident in Spain who have habitual links with the municipality (live, work, study, or habitually spend time there).
What are the characteristics and conditions of a true census?
Universal (includes all inhabitants)
Information collected individually
Obligatory
Secret; results published only in grouped form
Carried out simultaneously at a defined census time
What is a drawback of census data?
The amount of data is huge; complete results are not available quickly.
What is a simple census?
A census that gathers only a small number of data, possibly only one, while remaining universal.
What is a partial census?
A census carried out on a representative part of the population using sampling (multistage sampling by age, sex, etc.)
What are approximate methods in demography?
Estimations used when no census or polls exist; based on indicators or conjectural data (e.g., asking tribal chiefs).
What is the active population survey?
A multi-stage sample survey in strata repeated quarterly, essential for updating intercensal information.
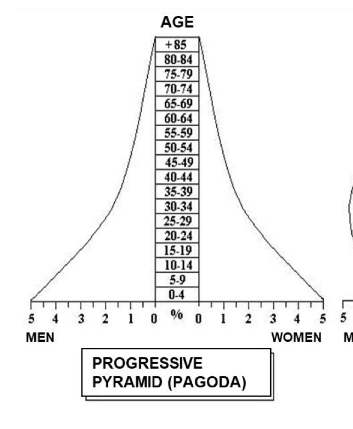
What is a population pyramid?
A histogram showing age and sex distribution, using horizontal bars proportional to the number of people.
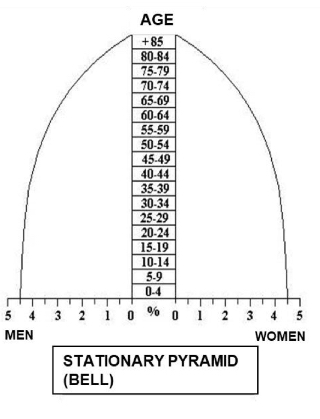
What are the three basic shapes of population pyramids?
Progressive (Pagoda)
Bell (Stationary)
Money-box (Regressive)

What characterizes a progressive pyramid?
Broad base, narrowing upper groups; young population with high natality.
-younger people with high natality
-underdeveloped counties due to high mortality rates
and a high and uncontrolled birth rate.

What characterizes a bell pyramid?
Stabilized population with balanced age groups.
-stationary - balance between all groups
-developed countries
-intermediate step
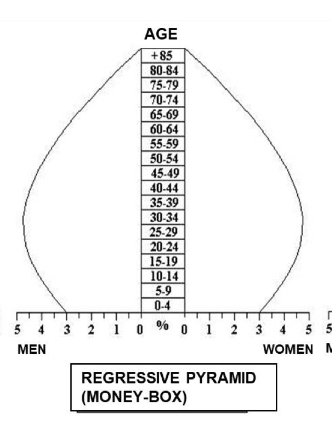
What characterizes a money-box pyramid?
Narrow base, broad middle, ageing population; regressive population.
-developed countries.
-Higher degree of ageing

What does the Burgdöfer index compare
The 5–14 age group with the 45–64 age group.
Burgdörfer index

Interpretation burgdörfer index
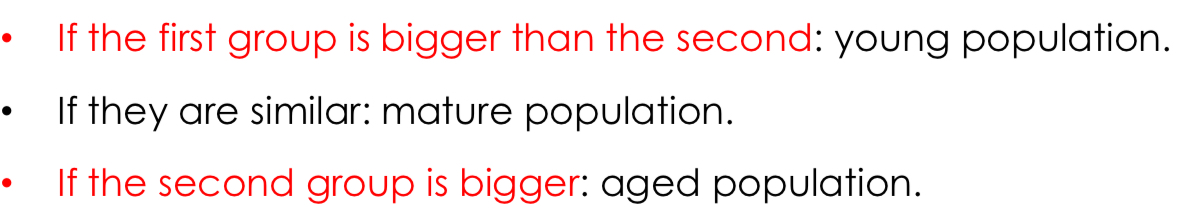
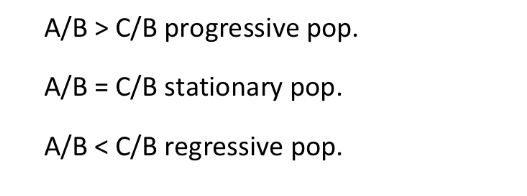
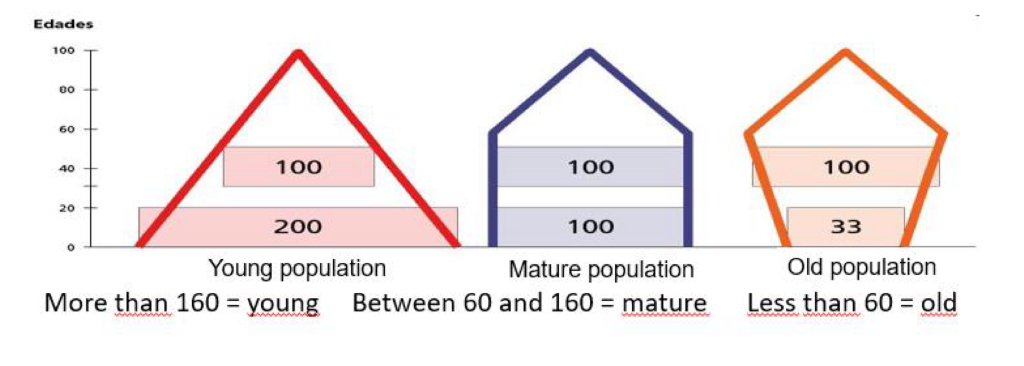
What does the Sundbarg index classify?
Age groups A (0–15), B (15–50), C (50+)
Sundbarg index bells
What does the Sauvy index compare?
Population aged 60+ with population under 20.
Sauvy index

Calculation of age of population

What does the FRIZ index compare?
The 30–49 age group with the number of people under 20.
Fritz index calculation
What is the dependence relation?
(A + C) / B for global dependence; A/B for youth dependence; C/B for senile dependence
What is the masculinity index?
The ratio of males to females, typically >1 at young ages and decreasing after age 45.
Natural ratio of male births for every 100 female births
About 105 male births per 100 female births for every year
Dependence relation

Third age dependence relation

Youth dependence relation

Ageing index