11 - How Nutrient Cycles Power Ecosystem Services
1/63
There's no tags or description
Looks like no tags are added yet.
Name | Mastery | Learn | Test | Matching | Spaced | Call with Kai |
|---|
No analytics yet
Send a link to your students to track their progress
64 Terms
how are Ecosystems are Inclusive
An ecosystem is a community of living organisms interacting with each other and with their non-living environment, forming a single, interdependent system.
Being inclusive means every component—biotic and abiotic—plays a vital role in maintaining balance and sustainability.
Interconnectedness
• Energy flows through food chains and food webs.
• Nutrient cycles continuously (C, N, P and H2O cycles).
• Changes in one part of the system (e.g., pollution, species loss) affect the entire system.
• Humans are also integral participants, not separate from nature.
Why “Inclusive” Matters
▪ Recognizes that no organism exists in isolation.
▪ Encourages holistic conservation — protecting species and their habitats.
▪ Reminds us that biodiversity, climate, and human well-being are linked.
An inclusive ecosystem embraces
diversity, interdependence, and balance,showing that the survival of one depends on the health of all.
Ecological Budget:
Balance of inputs, outputs, and storage of energy or nutrients in an ecosystem.
Ecological Pools (stocks or reservoirs):
Storage compartments (e.g., soil, plant biomass, atmosphere).
Ecological Flows (fluxes):
Movement of energy/nutrients between pools (e.g., photosynthesis, feeding).
Ecological Loops:
Recycling pathways forming cycles (carbon, nitrogen, water cycles).
Carbon exists in
organic (living) and inorganic (nonliving) forms.
Carbon fixation
converts CO₂ into organic matter.
Carbon cycle:
Carbon moves through ecosystems via pools (storage) and fluxes (movement).
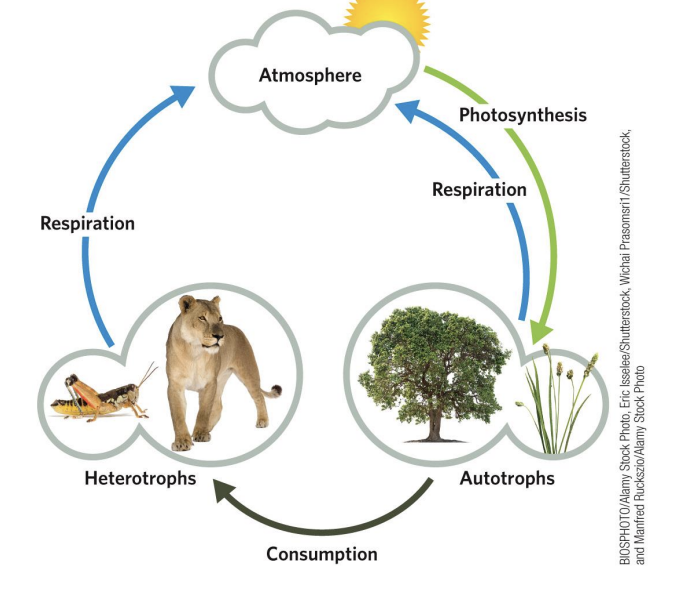
Carbon cycles among autotrophs, heterotrophs, and the atmosphere illustrate an ecosystem budget.
The shapes outlined in gray indicate pools where the focal molecules may accumulate or be stored, and arrows indicate the flow of material between pools.
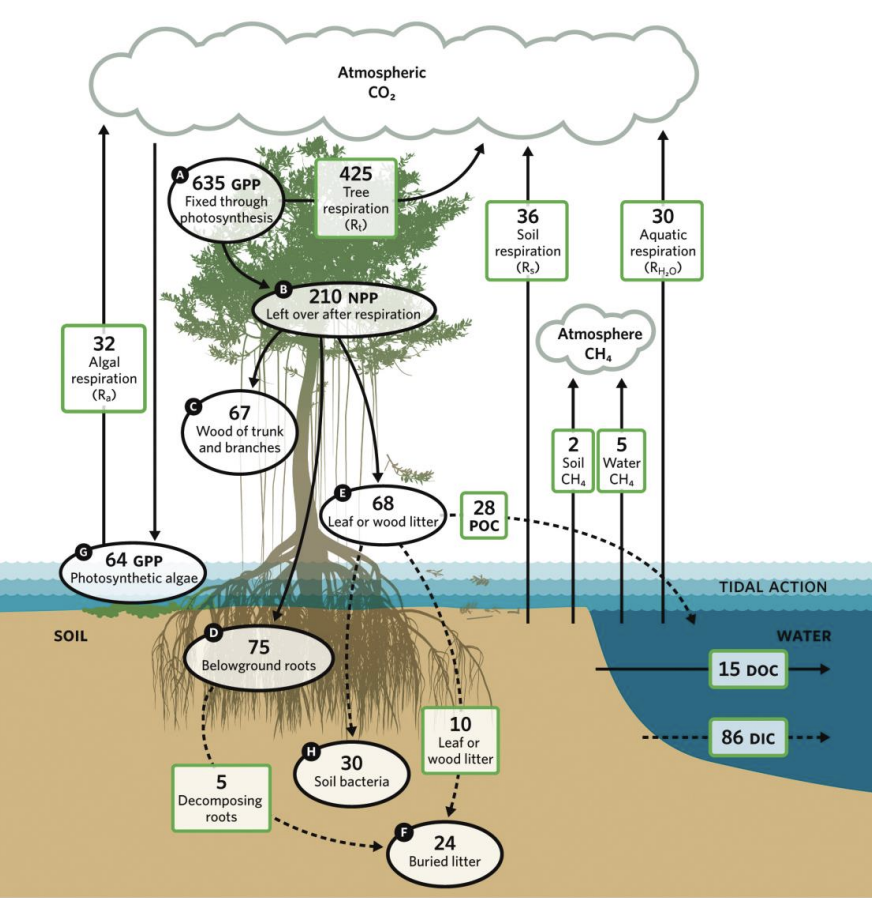
Daniel Alongi (2014) developed this carbon budget for the major pathways of carbon flow through a mangrove forest.
Arrows indicate carbon flows,
➢ solid arrows showing well-established and understood flows and
➢ dashed arrows showing the best estimates based on the literature.
Ovals represent carbon pools
Green boxes indicate the amount of carbon flowing out to the environment.
All numerical values are in teragrams (1012 g) of carbon stored/ year (Tg C y−1).
DIC =
dissolved inorganic carbon
DOC =
dissolved organic carbon
GPP =
gross primary production
NPP =
net primary production
POC =
particulate organic carbon.
The Mangrove Forest Carbon Budget
The roots of a mangrove forest along the coast of Mali experience inundation and exposure with tidal fluctuations. '
Beneath the water’s surface, the tangled mangrove roots serve to slow down wave action and allow silt to settle. They also trap carbon and many plant nutrients.
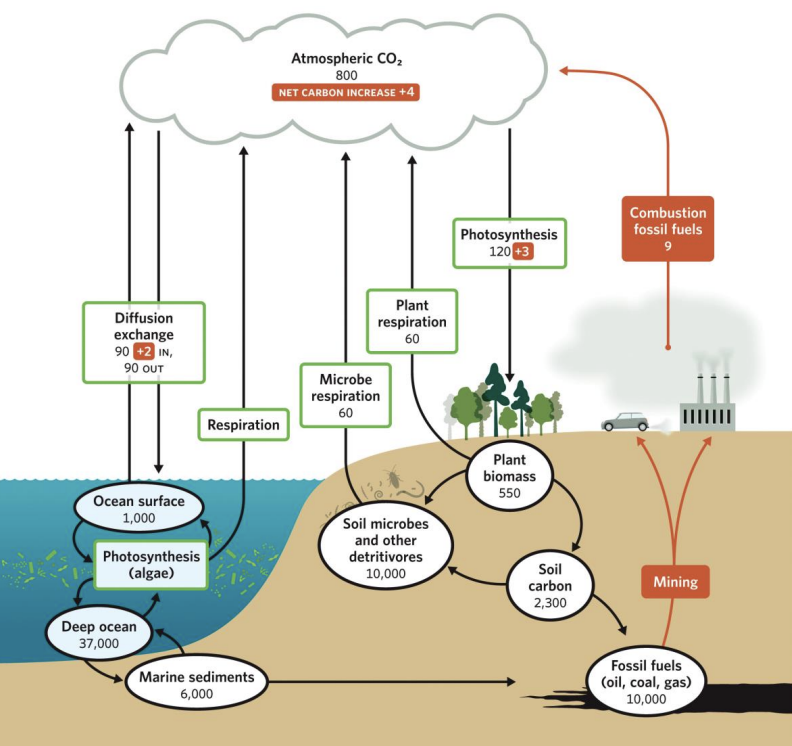
The Earth’s carbon cycle in gigatons (Gt) of carbon
➢ Green boxes represent natural flows
➢ black ovals indicate stored carbon.
➢ The red arrows with red boxes indicate the major extraction-and-release pathways for anthropogenic carbon.
The numbers for long-term, belowground carbon storage are approximate and do not necessarily add up.
Slow Carbon Cycle:
Operates over thousands to millions of years.
Dominated by geological processes.
components of Slow Carbon Cycle:
▪ Weathering of rocks removes CO₂ from the atmosphere.
▪ Transport of carbon by rivers into oceans.
▪ Formation of carbonates (e.g., limestone).
▪ Plate tectonics and volcanism release CO₂ back into the atmosphere.
Ecological importance of of Slow Carbon Cycle
• Controls long-term climate stability.
• Regulates atmospheric CO₂ over evolutionary timescales.
Atmospheric Carbon
➢ Forms of Carbon in the Atmosphere
➢ Carbon dioxide (CO₂)
➢ Methane (CH₄)
➢ Carbon monoxide (CO) (minor but important)
➢ Aerosols & particulate organic carbon
Sources of Atmospheric Carbon
• Respiration of organisms
• Volcanic emissions
• Combustion (biomass and fossil fuels)
• Ocean outgassing
Sinks of Atmospheric Carbon
• Photosynthesis
• Ocean uptake
• Soil sequestration
significance of Atmospheric Carbon
❑ Primary driver of the greenhouse effect.
❑ Directly influences temperature, climate patterns, and ecosystem processes
Oceanic Carbon
Carbon Pools in the Ocean
▪ Surface ocean: quickly exchanges CO₂ with the atmosphere.
▪ Deep ocean: stores carbon for centuries to millennia.
▪ Marine biota: phytoplankton, zooplankton, fish.
▪ Sediments: long-term carbon burial.
Key Processes part of the Ocean Carbon Cycle
Biological pump
Solubility pump
Carbonate pump
Biological pump
Phytoplankton fix CO₂ → organic matter sinks → deep-sea storage.
Solubility pump
Cold waters dissolve more CO₂; warm waters release CO₂.
Carbonate pump
Shell-forming organisms create CaCO₃.
Importance of Oceanic Carbon
➢ Oceans absorb 25–30% of human CO₂ emissions annually.
➢ Largest active carbon reservoir on Earth
Change in the sea-surface pH from the 1700s to the 1990s. Warmer colours indicate a ____
greater shift toward acidity
Oceanic storage of anthropogenic carbon varies with latitude, and there is a large area of very_____
high carbon storage in the North Atlantic
Major Terrestrial Carbon Pools
• Vegetation (forests, grasslands, tundra)
• Soils (organic matter, microbial biomass)
• Peatlands and wetlands
Terrestrial Carbon - Carbon Inputs
➢ Photosynthesis
➢ Carbon fixation by soil microbes
Terrestrial Carbon - Carbon Outputs
▪ Plant and soil respiration
▪ Fires
▪ Decomposition
▪ Leaching into waterways
Terrestrial Carbon - Why It Matters
▪ Forests store ~45% of land-based carbon.
▪ Soil organic carbon is one of the largest carbon pools on the planet.
▪ Sensitive to disturbances: logging, agriculture, wildfire, and permafrostthaw
Human Activities Altering Carbon Flows
➢ Fossil fuel combustion (the largest anthropogenic CO₂ source).
➢ Deforestation and land-use change (reduce carbon sinks).
➢ Industrial agriculture (soil carbon loss, methane from livestock).
➢ Cement production (releases CO₂)
Human Influences on the Global Carbon Cycle - Consequences
▪ Increased atmospheric CO₂ → global warming.
▪ Ocean acidification (CO₂ → carbonic acid) → harm to coral reefs & shell-formers.
▪ Altered terrestrial carbon storage due to land degradation.
Human Influences on the Global Carbon Cycle - Mitigation Strategies
❖ Reforestation & afforestation
❖ Renewable energy
❖ Carbon capture & storage (CCS)
❖ Restoration of wetlands & peatlands
❖ Soil carbon sequestration practices (no-till agriculture, cover crops)
Steps in the Nitrogen Cycle
1.Nitrogen Fixation
2.Nitrification
3.Assimilation
4.Ammonification (Mineralization)
5.Denitrification
1.Nitrogen Fixation
1. N₂ → NH₃/NH₄⁺
2. Done by nitrogen-fixing bacteria (Rhizobium, cyanobacteria),
3. lightning, or industrial processes.
2.Nitrification
1. NH₄⁺ → NO₂⁻ → NO₃⁻
2. Performed by chemoautotrophic bacteria (Nitrosomonas,
Nitrobacter).
3.Assimilation
1. Plants take up NH₄⁺ and NO₃⁻
2. Incorporate N into proteins and nucleic acids.
4.Ammonification (Mineralization)
1. Organic N → NH₄⁺
2. Carried out by decomposers.
5.Denitrification
1. NO₃⁻ → N₂
2. Anaerobic bacteria return N₂ to the atmosphere
Role of Microbes in Cycling Nitrogen
✓ Nitrogen continuously cycles between inorganic → organic → inorganic forms due to microbial activity.
✓ Nitrogen must be converted into usable forms by bacteria before plants and animals can use it.
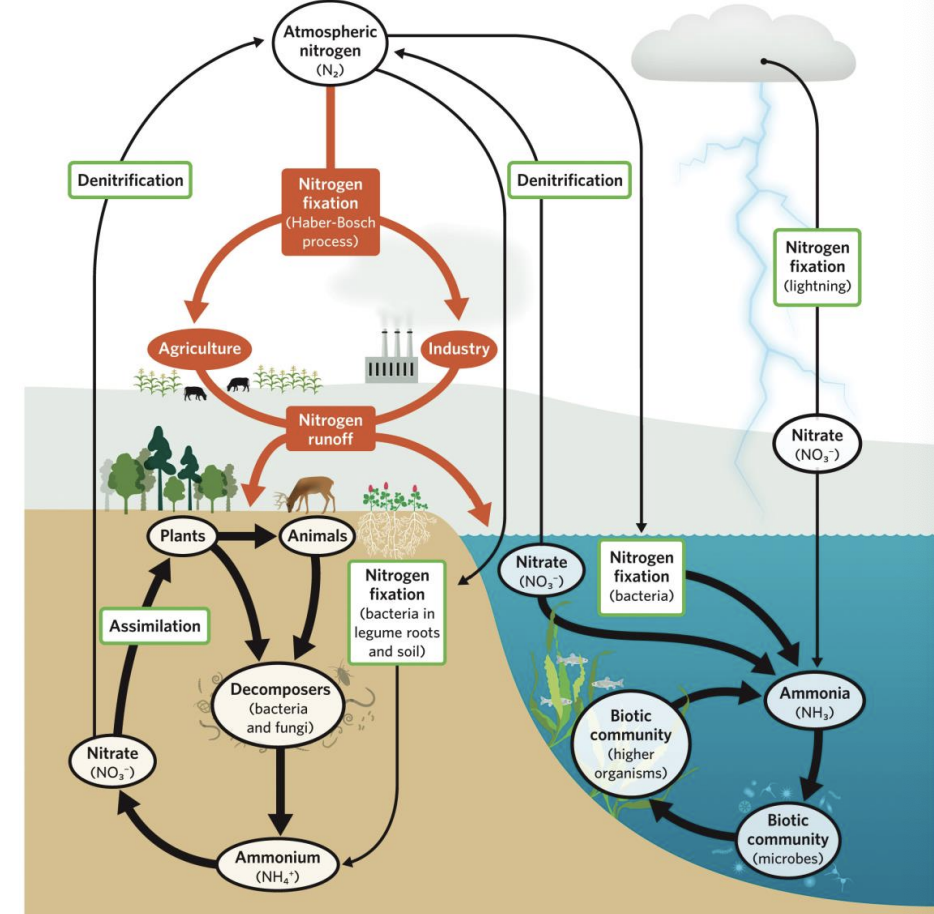
Simple diagram of the nitrogen cycle; the thickness of the arrows corresponds to the relative amount of nitrogen moved, with thicker arrows indicating greater movement. Red arrows indicate movement of anthropogenic nitrogen.
How Nitrogen Enters Food Webs
Plants assimilate ammonium & nitrate.
Nitrogen enters animals when they consume plants or other animals.
Nitrogen moves through trophic levels as:
• Amino acids
• Proteins
• DNA/RNA
Key Processes in nitrogen cycle
• Decomposition returns nitrogen to soil as ammonium.
• Detritivores & microbes are major nitrogen recyclers.
• Nitrogen availability affects:
• Primary productivity
• Herbivore growth & reproduction
• Predator biomass
• Decomposition rates
Human Sources of Nitrogen
❑ Haber-Bosch fertilizer production (synthetic NH₃)
❑ Agricultural runoff (nitrate leaching into waterways)
❑ Fossil fuel combustion (NOₓ emissions)
❑ Livestock waste (ammonia volatilization)
❑ Sewage & wastewater discharge
❑ Deforestation (alters soil N retention)
How Humans Disrupt the Nitrogen Cycle
➢ Increase reactive nitrogen far beyond natural levels.
➢ Double the amount of biologically available N globally.
Anthropogenic nitrogen is both a resource (food production) and a pollutant (ecosystem stress).
Major Ecological Consequences of Anthropogenic Nitrogen
1.Eutrophication
2.Loss of Biodiversity
3.Soil Acidification
4.Greenhouse Gas Emissions
5.Altered Plant Chemistry
Human nitrogen inputs strongly alter ecosystem productivity, species interactions, climate, and water quality.
1.Eutrophication
1. Excess nitrogen → algal blooms → hypoxia → dead zones.
2.Loss of Biodiversity
1. Nitrogen-favoured species outcompete low-N specialists.
3.Soil Acidification
1. Nitrification & nitrate leaching acidify soils.
4.Greenhouse Gas Emissions
1. N₂O released from agricultural soils → climate warming.
5.Altered Plant Chemistry
1. Leaves may have higher N, lower defensive compounds → herbivores eat more
Nitrogen Deposition & Grassland Species Richness study summary
▪ 68 semi-natural grasslands across Great Britain.
▪ Sites experienced different levels of atmospheric nitrogen from
agriculture, vehicles, and industry.
▪ Plant species richness was measured and compared across the
deposition gradient.
Nitrogen Deposition & Grassland Species Richness main findings
➢ Higher nitrogen deposition → lower species richness.
➢ Even small increases in N caused measurable declines.
➢ Nitrogen-loving fast-growing species outcompete slow-growing
specialists.
Why Richness Declines?
▪ Competitive exclusion: tall, fast-growing species shade out others.
▪ Soil acidification harms sensitive plants.
▪ Altered microbial communities change nutrient cycling
Nitrogen pollution is a widespread driver of biodiversity loss—grasslands receiving more nitrogen consistently support fewer plant species.