8 Lesson 2: Expected Value, Variance, Standard Deviation, Covariances, and Correlations of Portfolio Returns
0.0(0)
Studied by 0 peopleCard Sorting
1/17
Earn XP
Description and Tags
Last updated 1:40 AM on 9/1/23
Name | Mastery | Learn | Test | Matching | Spaced | Call with Kai |
|---|
No analytics yet
Send a link to your students to track their progress
18 Terms
1
New cards
Why does the portfolio relate to individual assets?
The expected return and the variance of the portfolio is based on properties of the individual assets.
2
New cards
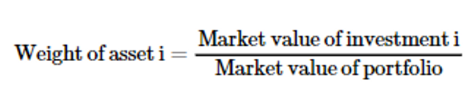
What is the first step in calculating the portfolio expected return and variance?
We need to calculate the weight of each individual asset comprising the portfolio.
3
New cards
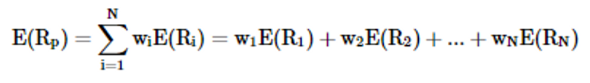
How do we calculate the expected value of returns on a portfolio?
4
New cards
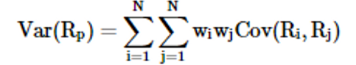
How do we calculate the variance of the portfolio
Remember: Cov(a,a)=Var(a)
5
New cards
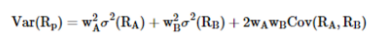
State the calculation of the variance of a portfolio of 2 assets
6
New cards
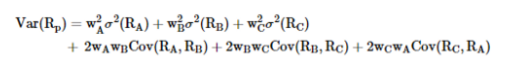
State the calculation of the variance of a portfolio of 3 assets
7
New cards
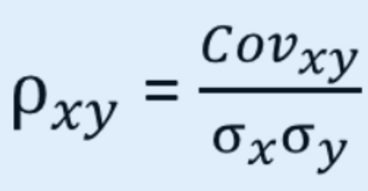
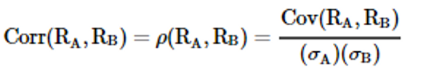
State the formula of the correlation
8
New cards
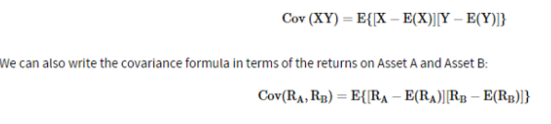
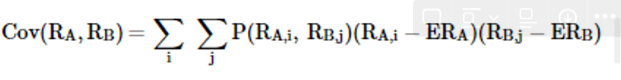
How can we calculate the covariance with expected values?
This is the population covariance.
9
New cards
Why is the population covariance “forward-looking”?
* Population covariance gives you an idea of how two variables will move together on average in the future.
* It's forward-looking because it considers how deviations from the means are likely to interact over time.
* It's forward-looking because it considers how deviations from the means are likely to interact over time.
10
New cards
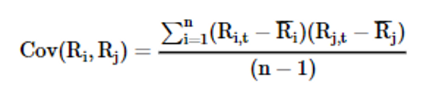
State the formula of the sample covariance
This is also forward-looking.
11
New cards
What are the properties of the covariance?
* Covariance is a similar concept to variance. The difference lies in the fact that variance measures how a random variable varies with itself, while covariance measures how a random variable varies with another random variable.
* Covariance is symmetric, i.e. Cov(X,Y) = Cov(Y, X).
* Covariance can range from positive infinity to negative infinity. Variance, on the other hand, is always positive.
* The covariance of X with itself, Cov(X,X), is equal to variance of X, Var(X).
* When the covariance of returns of two assets is *negative*, there is an *inverse* relationship between the two variables.
* When the covariance of returns of two assets is *positive*, there is an *direct* relationship between the two variables.
* Covariance of returns is zero if the returns are unrelated.
12
New cards
What are the limitations of covariance?
* Because the unit that covariance is expressed in depends on the unit that the data is presented in, it is difficult to compare covariance across data sets that have different scales.
* In practice, it is difficult to interpret covariance as it can take on extreme large values.
* Covariance does not tell us anything about the strength of the relationship between the two variables.
* In practice, it is difficult to interpret covariance as it can take on extreme large values.
* Covariance does not tell us anything about the strength of the relationship between the two variables.
13
New cards
How can we calculate covariance using probabilistic data?
14
New cards
What is the correlation coefficient?
The correlation coefficient measures the strength and direction of the linear relationship between two random variables.
15
New cards
State the formula of the correlation
It is obtained by dividing (standardizing) the covariance of the two random variables by the product of their standard deviations.
16
New cards
What is a shortcoming of the correlation coefficient?
Like covariance, the correlation coefficient is a measure of linear association.
17
New cards
Explain the range of the correlation coefficient
The correlation coefficient can have a maximum value of +1 and a minimum value of −1.
* A correlation coefficient greater than 0 means that when one variable increases (decreases) the other tends to increase (decrease) as well.
* A correlation coefficient less than 0 means that when one variable increases (decreases) the other tends to decrease (increase).
* A correlation coefficient of 0 indicates that no linear relation exists between the two variables.
18
New cards
State the difference between covariance and correlation
**1. Nature of Measurement:**
* **Covariance:** Covariance measures the direction of the linear relationship between two variables (whether they tend to increase or decrease together) but does not provide a standardized measure.
* **Correlation:** Correlation also measures the direction and strength of the linear relationship between two variables, but it standardizes the measure between -1 and 1, making it easier to interpret and compare.
**2. Scale:**
* **Covariance:** The covariance can take any value, positive or negative, depending on the relationship between the variables.
* **Correlation:** The correlation coefficient always ranges between -1 and 1, where -1 indicates a perfect negative linear relationship, 1 indicates a perfect positive linear relationship, and 0 indicates no linear relationship.
**3. Interpretability:**
* **Covariance:** The magnitude of the covariance value is difficult to interpret directly, as it depends on the scales of the variables.
* **Correlation:** The correlation coefficient is standardized and provides a clear and intuitive measure of the strength and direction of the relationship between the variables.
**4. Units:**
* **Covariance:** The units of covariance are the product of the units of the two variables. This can make it hard to compare covariances between different pairs of variables.
* **Correlation:** The correlation coefficient is unitless, which makes it easy to compare and interpret across different pairs of variables.
**5. Interpretation of Strength:**
* **Covariance:** A positive covariance indicates a positive relationship, while a negative covariance indicates a negative relationship. However, the magnitude of the covariance doesn't directly indicate the strength of the relationship.
* **Correlation:** The magnitude of the correlation coefficient indicates the strength of the linear relationship. A correlation coefficient closer to -1 or 1 signifies a stronger linear relationship.
Explore top notes
Chapter 1: Development of Practical Skills in Chemistry + Foundations in Chemistry
Updated 1230d ago0.0(0)
Chapter 1: Development of Practical Skills in Chemistry + Foundations in Chemistry
Updated 1230d ago0.0(0)