environmental science unit 3.3
1/14
There's no tags or description
Looks like no tags are added yet.
Name | Mastery | Learn | Test | Matching | Spaced |
|---|
No study sessions yet.
15 Terms
natality
birth rate
fecundity
ability to reproduce
fertility
number of offspring produced
mortality
death rate
life expectancy
predicted length of survival
survivor-ship curve
shows the probability of survival for a given group/species
survivor ship curve is based on these rates
natality and mortality rate of indivduals
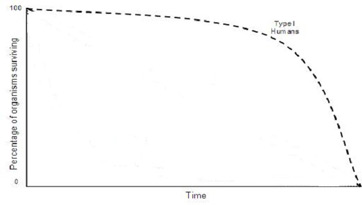
type 1
low fertility
high parental care
ex. humans, large mammals
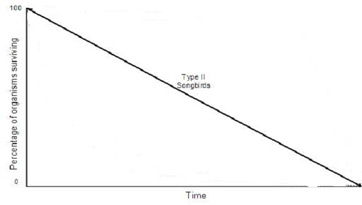
type 2
constant mortality throughout life
ex. birds
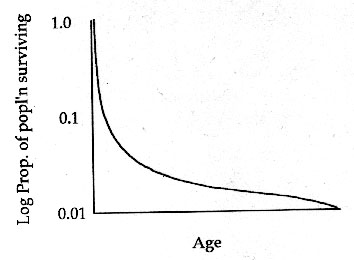
type 3
high fertility
low parental care
high mortality
K strategists
live in stable environments
reproduce slowly - fewer offspring
long-life expectancy
strong + large
type 1 or 2 survivorship curve
high energy + high levels of parental care
ex. humans, whales
R strategists
live in unstable environments
reproduce quickly - ensures some offspring survive
short-life expectancy - weak/subject to predation
type 3 survivorship curve
low energy + low levels of parental care
ex. bacteria, insects
what type are K strategists?
type 1 or type 2 survivorship curve
what type are R strategists?
type 3 survivorship curve
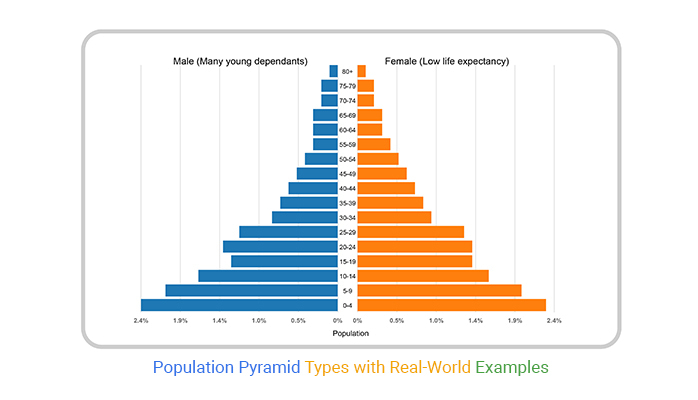
population pyramid
shows a snapshot of the current population, including age + gender
shows an expanding population b/c many young individuals