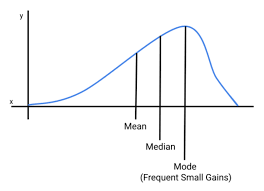
how mean and mode switch depending on skew
Norm scores
– What is considered the norm? – Based on norm group: a previously tested group of individuals
Frequency Distributions interpreting data
Sort the scores from lowest to highest
Count how frequently a score appears
Report this frequency (and most often percentage)
Histogram:
a bar graph used to represent frequency data in statistics
– Most common visualization of frequency information
– Shows the observed distribution of scores
Class Intervals
a way to group raw scores so as to display them
– Groups, or range, of scores
– Sometimes referred to as “bins”
■ Simplifies the information to make it interpretable
Frequency distributions
an orderly arrangement of a group of numbers (or test scores)
– Class Intervals: a way to group raw scores so as to display them
-Histogram: a bar graph used to represent frequency data in statistics
norm group
a previously tested group of individuals
Raw scores
– Provide little information on their own
– “Score of 168 on an IQ test”
– What do these scores mean in context?
Questions and items should
include appropriate categorical alternatives.
■ Example: – I believe my therapist understands how I feel when I explain my relationships.
ask one and only one question
– Questions should not be “double-barreled”
■ Example: – My therapist makes me feel happy and comforted.
not require reverse-coding (this is debated!)
■ Example: – My therapist makes me feel unhappy.
Ordinal Scale
Same properties as the nominal scale, adds order
■ Example – Rank order of job candidates (1st preference, 2nd, etc.) – Doesn’t tell us distance between the candidates
Interval Scale Analysis
■ Frequency – Example: How many people strongly disagree to being a dog lover? ■ Mode – Example: What is the most common level of sports fandom? ■ Median
-Example: What is the median level of being a sports fan?
■ Mean
– Example: How much does the average student like dogs?
■ Standard deviation
- Example: How much do students generally vary in their love of video games?
■ Correlation (Pearson)
-Example: What is the relationship between being a sports fan and loving dogs?
■ T test (compares means)
-Example: Do juniors or seniors generally have more love for books?
■F test (compares variances)
-Example: Do males or females vary more in their love of video games?
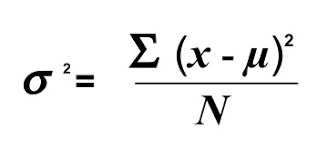
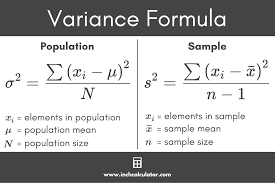
Variance
–Basically, do scores tend to be similar to or different from the mean?
–x = raw scores
–μ = mean
–Σ = sum
–N = sample size
Denominator
–N when calculating variability of a known population
–N-1 for sample
Biased estimator
Expected value of the population parameter
Limitations of the variance
–Variance is interpretable in reference to the range of scores
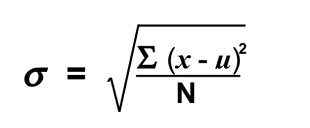
Standard deviation
the most commonly used measure of variability in a distribution of test scores.
–x = raw scores
–μ = mean
–Σ = sum
–N = sample size
Indices of Variability: Variance
■Sample vs. Population
■Biased estimator
–Expected value of the population parameter
■Denominator
–N when calculating variability of a known population
–N-1 for sample
Interval Scale
■ Distance from one point to another is the same ■ However!
– Likert-type scales are debated – are they ordinal or interval scales?
– Researchers tend to treat them as interval scales
■ What’s another example of an interval scale?
Importance of the Levels
■ Defines how much we can say about comparisons
– Friend scores 25 on an extraversion scale, you score 50
– Are you twice as extraverted as your friend?
■ Why or why not?
■ What level of measurement would we need to achieve that?
Ratio Scale Analysis
Frequency
Mean
Mode
Median
Standard deviation
Correlation (Pearson)
T test
F test
Proportions
Example: Did Sally take twice as long as George to complete Project Stage 2?
Ratio Scale
■ All of the properties of the previous scales
■ Adds an absolute zero point, representing the complete absence of the property measured
– E.g., Census question asking about children in household – Can have zero children
■ In psychology, ratio level is often not achieved – Time or distance measurement still applicable – Still debate if most psychological tests achieve even interval levels
Correlation
(Rank-order; association)- Example: How does the rank order of students’ submission time correlate with their grade on Project Stage 1? What do you think?
Ordinal Scale Analysis
Frequency- Example: How many people ranked 5th for completing Project Stage 1?
Mode- Example: What was the most common rank for completing Project Stage 1?
Median (middle number)- Example: Who represents the median for completing Project Stage 1?
Percentage- Example: You completed Project Stage 1 before what percentage of the class?
Correlation (Rank-order; association)- Example: How does the rank order of students’ submission time correlate with their grade on Project Stage 1? What do you think?
Chi-square
(compares frequencies)
- Example: Was Dog Lover selected significantly more frequently than Sports Fan?
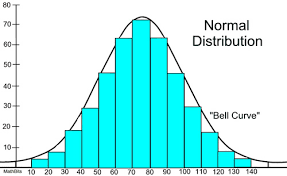
Normal curve
Theoretical distribution of scores
Central Tendency
Where the distributions are centered
Where’s the distribution located?
■Three main indicators
–Mean
–Median
–Mode
Range
–Simply, the highest score minus the lowest score
■Quiz 01
–Range: 90 (100 – 10
■Quiz 02
–Range: 50 (80 – 30)
■Limitations of the Range
–Outlying scores can skew this index
–County A range = 4 (5-1)
–County B range = 8 (9-1)
Mode
The most frequently occurring score
Bimodal-two modes
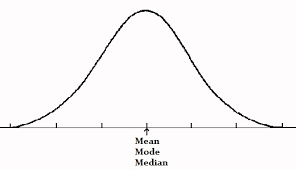
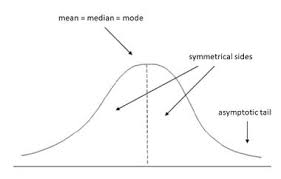
In normal distributions,
the mean, median, and mode are all in the same location.
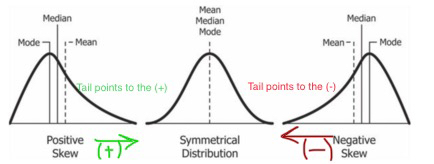
Positively Skewed Distributions
Tail points to the positive
Mean is more affected by outliers, thus it is closer
Median is less affected by outliers, hence it is farther
Mode- Most frequently occurring score represented by the peak in the distribution
In Skewed Distributions
■Mean is most affected by outliers
■, the median is a more appropriate index of central tendency
■The mode is unchanged
Variability
■How spread out (distributed) are groups of scores?
Skewed Distributions Examples
–Positively skewed distribution: income
■A few people with very high incomes (outliers) pull the average income up
–Negatively skewed distribution: college grades
■Most are As and Bs, but a few Fs (outliers) pull the class average down
Skewed Distributions Considerations
–Outliers have a considerable effect on the mean
–The median is less influenced by outliers than the mean
–Report median when distribution is skewed
Median
–The middlemost score; separates the top 50% of scores from the bottom 50%
■If there are an odd number of scores in the distribution, the median is the middle score
■If even number of scores, use the average of two middle scores
Mean
–The arithmetic average (μ)
–*Sum (*∑) of the scores (X) divided by the number of scores (n)
Negatively Skewed
Tail points to negative
The Normal Curve
■Assumption of nearly all statistical tests
■Most scores fall in the middle (central tendency)
■~34% of scores fall between 0-1 SD from the middle
■~14% of scores fall between 1-2 SD from the middle
■~2% of scores are greater than 2 SD from the middle
Nominal Scale Analysis
Frequency
Example: How many people selected each topic?
Mode
Example: What was the most commonly selected topic?
Chi-square (compares frequencies)
Example: Was Dog Lover selected significantly more frequently than Sports Fan?
Nominal Scale
■ Most basic level of measurement
■ Data “in name only”
■ Numbers assigned to categories to give them labels
– E.g., 0 = Male, 1 = Female
– Project: ■ Dog Lover (1) ■ Sports Fan (2) ■ Book Worm (3) ■ Video Gamer (4)
The four levels of measurement
– Nominal
– Ordinal
– Interval
– Ratio
■ Acronym: NOIR
Survey questions and items should have
appropriate rating scales and response options
■ Example: – I believe my therapist always understands how I feel.
Objective tests
■ Some structured response format
■ E.g., multiple choice, T/F, etc.
Testing process
– Determines need for psychological testing
– Selects the test to use
– Administers the test to the test taker
– Scores the tests
– Interprets the test for the test taker
Test user:
a person who participates in purchasing, administering, interpreting, or using the results of a psychological test.
Test taker:
person who responds to test questions or whose behavior is measured
Test Taker Rights
Be informed of your rights and responsibilities
Treated with respect
Be tested using measures that meet professional standards
Receive explanation prior to testing about the purpose
Know in advance when the test will be administered, scored, and if any fees are required
Have your test administered and results interpreted by qualified personnel
Know if the test is optional and the consequences of not taking the test
Receive written or oral explanation of the results within a reasonable amount of time
Have your results kept confidential (unless law requires disclosure
Present concerns about the process or results and receive information on procedures used to address concerns
Individual decisions:
test-takers use their test scores to make decisions about themselves
Institutional decisions:
on the other hand, are those made by another entity about an individual based on his or her test results
Comparative decisions:
made by comparing the test scores of a number of people to see who has the best score
Absolute decisions
made by others (institutions) by looking at who has the minimum score needed to qualify
Psychological testing is everywhere!
■ Inferences
■ Decisions
■ Settings
■ Controversies
Step 5: Writing Survey Questions/Items
■ Different types of survey questions:
– Open ended
– Closed ended
– Yes/no questions
– Fill in the blank
– Multiple choice
– Ranking
– Likert and other intensity scale
■ Questions and items should be purposeful and straightforward
■ Draft 1: I believe my therapist does things that make me feel like they understand me, I feel less stressed, and more like they know exactly what I’m going through.
■ Draft 2: I believe my therapist understands how I feel.
Step 4: Selecting the Type of Survey
■Self-administered survey
– Mail or online survey
– Individually administered survey
■ Personal interview survey
– Face-to-face survey
– Telephone survey
Step 3: Constructing a Plan
identify the necessary steps, costs, and timeline ■ Example
– Steps: Write survey items, refine survey items, administer survey items to clients in the clinic, run analyses, refine survey items, administer new items, run analyses.
– Costs: Pay clients to fill out questionnaires (gift cards) – Timeline: 1 year
Step 2: Define the Objectives Operationally
specific behaviors that represent the purpose
■ Example
– How often do clients feel a bond towards their therapist? – How often do clients feel that they are working towards similar goals with their therapist?
– How often do clients feel they and their therapist agree on what to do to work towards their goals?
Step 1: Identify the Objectives
– the purpose of the survey and what the survey will measure
■ Objectives often come from a practical need, literature review, and/or experts
■ Example – One thing that I study is the therapeutic relationship. Through literature reviews, I realize there is not a lot of research on specific factors of the therapeutic relationship.
– Objective: To gain a better understanding of how much clients feel supported by their therapist.
How many steps are in developing a psychological survey?
Step 1- Identify the Objectives
Step 2- Define operations objectively
Step 3- Constructing a Plan
Step 4- Selecting the Type of Survey
Step 5- Writng survey items/questions
What is the difference between a psychological test and a psychological survey?
■Psychological test: – Individual outcomes
■ Psychological survey: – Group outcomes
Psychological Test Settings
■ Educational - Administrators, teachers, school psychologists, career counselors, and colleges/universities
■ Clinical – Clinicians and consultants
■ Organizational – Human resources professionals and Industrial and Organizational psychologists
Types of Decisions Made Using Psychological Test Results
■ Individual decisions
■ Institutional decisions
■ Comparative decisions
■ Absolute decisions
Test Taker Responsibilities
■ Be prepared
■ Understand and accept consequences of not taking a test
■ Carefully attend to instructions
■ Respectfully inform the appropriate individuals if they believe the testing conditions may have affected their results or they have other concerns about the testing process or results
■ Protect test security
■ Represent themselves honestly
■ Request testing accommodations if needed
■ Ask questions if they are uncertain about why they are taking a test, how the test will be administered, what they will be asked to do, how others will use the results, or the confidentiality of test results
■ Treat others with courtesy and respect by not interfering with the performance of other test takers in group settings
Test User Responsibilities
■ Test user: a person who participates in purchasing, administering, interpreting, or using the results of a psychological test.
■ Testing process
– Determines the need for psychological testing
– Selects the test to use
– Administers the test to the test taker
– Scores the tests
– Interprets the test for the test taker
■ Understand and abide by professional practice standards
Ensure psychological tests have an accompanying test manual containing psychometric information based on research
– Psychometric characteristics
– Proper administration and scoring procedures – How to use norms
Considerations for test security
Market psychological tests properly and truthfully
Test Publisher Responsibilities
■ Sell psychological tests to those appropriately trained
– Test User Qualifications
■ Market psychological tests properly and truthfully
– Considerations for test security
■ Ensure psychological tests have an accompanying test manual containing psychometric information based on research
– Psychometric characteristics
– Proper administration and scoring procedures
– How to use norms
Interest inventories
■ What do you like to do?
■ Are your interests aligned with people currently in that job?
■ Will you be satisfied in this role?
Intelligence tests
more generalized, still future-oriented
Aptitude tests
potential for future learning
Achievement tests
previous academic learning
Personality tests
■ Some for diagnosis of disorder (15% of U.S. pop.; Grant et al., 2004)
■ More commonly, normal personality for org. decision making
Subject tests
■ GRE Psychology subject test
Dimension Measured
– Achievement tests – Aptitude tests – Intelligence tests – Interest inventories – Personality tests – Subject tests
Projective tests
■ Asked to respond to ambiguous stimuli
■ Less common, very unreliable, lack of validity
Nonstandardized tests
Don’t have standardization samples and are more common than standardized tests.
-Usually constructed by a teacher or trainer in a less formal matter for single administration.
-Ex: Tests college students take
Standardized tests
Are designed to assess a specific construct
– After development, administered to a large group of individuals who are similar to those for whom the test has been designed
■ This is called the standardization sample
■ Used to obtain norms
Self-report
test takers report on their feelings, beliefs, opinions, etc.
■ Many personality inventories and other SONA surveys use self-report
Behavioral observation:
observing people’s behavior in a particular context
■ Often, people do not know they are being observed or what specific task they must complete
Maximal performance:
test takers must perform a well-defined task where they are trying to do their best
Classifying Tests: Testing conditions
– Maximal performance
– Behavioral observation
– Self-report
Assumptions of Psychological Tests
1. Psychological tests measure what they purport to measure or predict what they are intended to predict
2. An individual’s behavior, and therefore test scores, will typically remain stable over time
3. Individuals understand test items the same way
4. Individuals will report accurately about themselves
5 • Individuals will report honestly about their thoughts and feelings
6 • The test score an individual receives is equal to his or her true score plus some error
Scores relative to norms
E.g. percentile score on SAT compared to the distribution of scores nationwide
Dichotomous threshold scoring:
assigning group membership based on a certain score
■ E.g. maximum score on PTSD scale = 100
■ Score >= 64, likely diagnosis for PTSD
■ Score < 64, unlikely diagnosis for PTSD
Scoring rules
-Number correct over number possible
– Dichotomous threshold scoring: assigning group membership based on a certain score
■ E.g. maximum score on PTSD scale = 100
■ Score >= 64, likely diagnosis for PTSD
■ Score < 64, unlikely diagnosis for PTSD
– Scores relative to norms
■ E.g. percentile score on SAT compared to the distribution of scores nationwide
Standardized testing conditions
– Test should be administered the same way, every time, to the same person
Representative sample of behaviors
Test of physical ability
• Two options
• 1. Evaluate performance in every sport you have ever played
• 2. Have you run the 50-meter dash
A good psychological test has
■ Representative sample of behaviors
■ Standardized testing conditions
■ Scoring rules
MBTI personality assessment
– Based on theory that has now been debunked
– Very unreliable; different result across occasions
– Does not predict outcomes
TAPAS personality assessment
– Uses the most advanced psychometric techniques
– Very reliable scoring across occasions
– Validated in diverse populations
Psychometric quality
TAPAS personality assessment
– Uses the most advanced psychometric techniques
– Very reliable scoring across occasions
– Validated in diverse populations
MBTI personality assessment
– Based on theory that has now been debunked
– Very unreliable; different result across occasions
– Does not predict outcomes
Interpretation
-Some can be interpreted by the user directly
■ Percentile SAT ranks
– Some need to be interpreted by a professional WAIS scores
Scoring
– Scantron test
– Online quiz
– Essay with rubric
Administration and format
How the test is administered can be very different
■ Example: TAPAS
– Self-report personality (Forced-choice format)
Content
■ Two tests can measure the same construct but ask the testee to perform different behaviors
– Example: ICAR & SAT
■ Both measure cognitive ability
– ICAR includes problem-solving
– SAT includes reading comprehension, arithmetic, geometry, writing
Attribute measured and outcome predicted
Attribute measured
– Cognitive ability
– Personality
– Vocational interest
– Job experience
– Driving skill
– Psychopathology diagnosis
■ Outcome predicted
– Job task performance
– Helping behaviors at work
– Job satisfaction
– Job knowledge
– Driving safety
– Type of treatment required
Modern testing started with intelligence testing
– Alfred Binet – late 1800s – Lewis Terman – 1916 – David Wechsler – 1930s WBIS/WAIS ■ Definition of intelligence has changed over time, which has caused a change in measurement
History of Testing
WWI: US Army Alpha and Beta; group tests for classifying recruits ■ WWII: US AAF; cognitive ability, personality, and interest measures predict performance in combat ■ 1964: Civil Rights Act & protected classes ■ 1968: Armed Services Vocational Aptitude Battery (ASVAB) ■ 1978: EEOC Uniform Guidelines ■ 1991: Quotas and score adjustments banned ■ 2002: New APA testing standards ■ 2015: Automatic personality prediction with IBM Watson
Future of testing
You will take testing for employment – Cognitive ability – Personality – Vocational interest ■ Your social media may be used to supplement testing
Psychological assessment:
– Gathering information from measurement. – Ascribing meaning to the measurement by interpreting the results and providing context.