econ midterm 2
1/128
There's no tags or description
Looks like no tags are added yet.
Name | Mastery | Learn | Test | Matching | Spaced | Call with Kai |
|---|
No analytics yet
Send a link to your students to track their progress
129 Terms
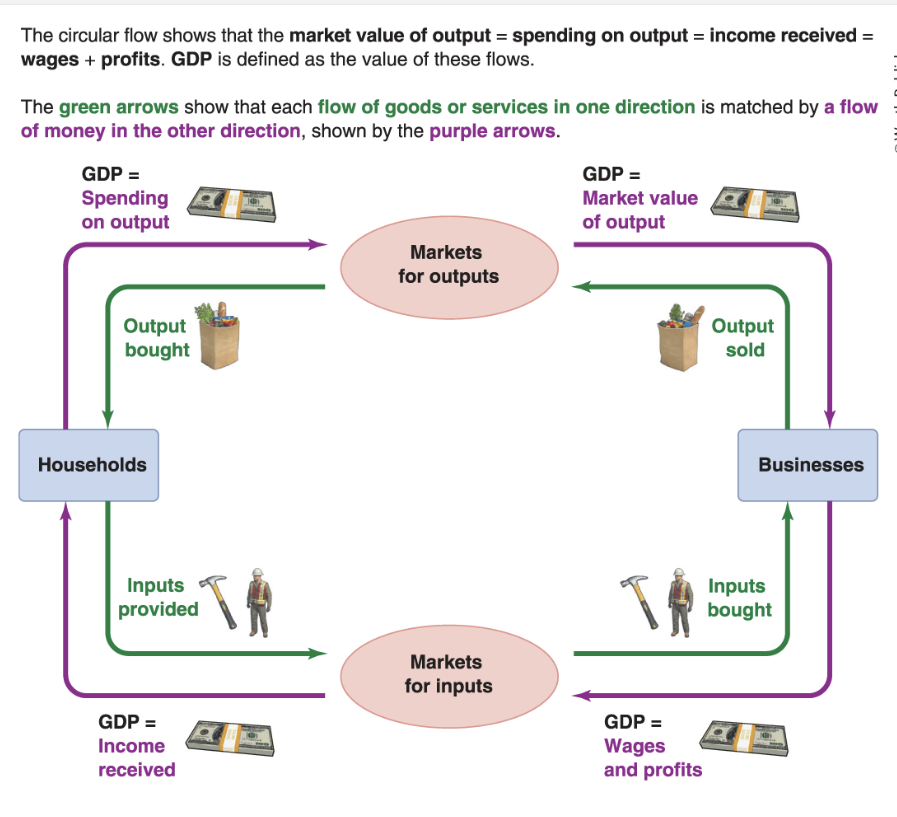
circular flow diagram
simple model showing how the households and businesses in an economy are linked
What is GDP trying to capture?
GDP is the market values of all final goods and services produced within a country in a given year
the GDP of a country tallies up the value of all the goods and services they produce
What kind of spending is included in GDP?
sales of all final goods, the ones we buy and bought for us by the government
ex: vaccines, national defense, schools
OMITS intermediate goods and services: that we buy to make other goods and services
What are the categories of spending that make up GDP?
Y= C + I + G + NX
C- Consumption: household spending; food, gas, services like Netflix, cars, TV, the rent you pay
I-Investment: spending to improve the economy like, buying a new home, building office buildings, spending money on research & development
Government purchases- spend schools, paying teachers
Net exports= Exports - Imports
Value Added
subtract the cost of intermediate inputs from a company’s total sales
think about GDP as all the stuff we make using value added
Profits
share of the money we spend going to businesses
Wages
share of the money we spend going to workers
Why are total spending, total output, and total income all equal?
Because of the circular flow diagram
Limitations of GDP
markets can fail; we know that if externalities are present, the markets prices we see aren’t equal to the marginal benefits to society
shadow economy is missing: economic activity involving illicit goods, banned services, or under- the- table transactions like babysitting
Real GDP
GDP measured in constant prices
tries to measure how much real stuff we have, so that we can focus on whether our economy has grown in value over time
Calculate Real GDP- compare output this year to output from last year
for everything produced in these 2 years, find average price level
compute GDP for both years using these average prices
Nominal GDP
total value of all good & services produced in a country during a specific period of time using current market prices
To calculate: multiply the quantities of all final goods & services produced in an economy by their current market prices in the same year, & sum up these values
How to measure GDP growth between 2 adjacent years
GDP this year- GDP last year/ GDP last year times 100
How to calculate growth rates
final value- initial value/ initial value times 100
Aggregate production function
how much of everything a country can produce
constant returns to scale, capital has diminishing returns; poor countries can catch up
Constant returns to scale
double all 3 of our inputs, we’ll get twice as much output
Diminishing marginal returns of capital
If we add more and more capital to the economy, holding population constraint, the growth in output will get smaller & smaller
What does the Solow model tell us about economic growth?
capital stock can only grow up to a certain point
physical capita per worker can’t grow forever
key insight: capital accumulation can’t sustain long-term growth
Depreciation- Solow Model
the decline in capital due to wear & tear, damage, and obsolescence
if we want capital stock to grow, we need to replace what is lost, then add even more
Technological progress
can generate continual growth
tech innovation shifts the production function up, more capital accumulation
Property rights- help create growth; but why?
control over a tangible or intangible resource
right to own a company
right to use or extract a natural resource
right to profit off of your own ideas
provide people a incentive to invest in capital, maintain a resource, or develop new technology
Efficient regulation- helps create growth, but why?
make it no harder than necessary for people to start businesses and invest in new enterprises - helps us limit negative externalities
Government stability- helps us create growth, but why?
the incentive to invest in society is higher with a more stable government
How do we measure the labor market?
working age population: 16 and older who aren’t in the military/institutionalized
employed: working people
unemployed: working-age people without jobs who are trying to get a job
Labor force and labor force participation rate
Labor force- unemployed and the employed together
100 times Employed + Unemployed/ working-age population
Unemployment rate
doesn’t figure it all out——- never 0%
100 times unemployed/labor force
Frictional Unemployment
Unemployment due to the time it takes for employers to search for the right workers, and for workers to search for the right job
want to find the right job
Structural unemployment
Unemployment that occurs because wages do not or can not fall to bring labor supply and demand into equilibrium
skills less valuable
What causes structural unemployment? 1st reason
Efficiency wages: higher wage paid to encourage higher productivity, or to attract more- desirable workers
based on the idea that paying workers more might make them more productive
What causes structural unemployment? 2nd reason
Minimum wage: price floor setting a minimum price of selling labor
binding price floors lead to persistent surpluses which means persistent unemployment
Cyclical unemployment
Unemployment due to a temporary down turn in the economy
happens when the macroeconomy shrinks and workers bear the brunt of the economic damage
What is inflation?
generalized rise in the overall level of price
happens when there is a widespread change in prices (upward)
higher prices are the result of inflation
How do we measure inflation?
100 times price level this year- last year/ price level last year
Consumer Price Index (CPI)
a index that tracks the average price consumers pay over time for a representative “basket” of goods & services
Basic steps to calculating CPI
contract the basket; groceries, rent, medical expenses, durables, services
find the prices
tally up the cost of the basket
index- pick a base year and for each year, just divide by the basket cost in the base year, and multiply by 100
What does CPI miss? How is it imperfect?
CPI can only measure price changes for existing goods
quality improvements hide price increases
people change their basket when prices rise
How do we calculate real GDP over time when we are thinking about using the GDP deflator?
pick a base year
use prices from the base year to calculate real GDP in another year
take nominal GDP in that other year, divide by the real GDP from step 2
Multiply by 100
GDP deflator gives us another way to calculate real GDP
What is the money illusion?
mistaken tendency to focus on nominal dollar amounts instead of inflation-adjusted amounts
if the price of everything goes up equally (including wages), inflation doesn’t (necessarily) hurt anyone
Medium of exchange
money is a medium of exchange: we use money to make transactions simple
Unit of account
we use money to measure value
money tells us the relative value of different products
Store of value
we use money to turn production today into savings for the future
How does inflation erode the usefulness of money?
creates menu costs for businesses- the marginal cost of adjusting prices
create shoe-leather costs for buyers: the costs incurred to avoid holding cash—— when inflation is high, people are discouraged from holding money
Hyperinflation
extremely high rates of inflation
Consequences of hyperinflation
erodes all of the functions of money
— society loses trust in money for transactions, for saving for the future, for everything
Costs of unexpected inflation
confuses price signals
redistributes between lenders and borrowers
What functions do banks have for society?
cornerstones of the financial sector
in the business of taking deposits….. and turning them into loans
pool savings to enable investment
spread risk across many investments and savers
Bank run
when many people try to withdraw their savings at the same time
Consequences of a bank run for society
can be contagious, and threaten the stability of the financial system
Bonds
Debt; an IOU, promising to pay back a loan or debt with interest over time to whoever holds the bond
Functions of bonds and the bond market for society
creates liquidity
moves funds from savers to borrowers
spreads risk
funds government debt
Stock
partial ownership of a business, entitling the owner to a share of the company’s future profits, as well as a say in how the company is run
Dividends
share of company profits paid directly to shareholders
What functions does the stock market have for society?
channel money from savers to investors
create a mechanism to reallocate control of a company
What is a business cycle?
short-term fluctuations in economic activity
business cycle fluctuations cause the economy to operate above or below potential output
Parts of a business cycle
Peak- high point in economic activity
Recession- a period of falling economic activity
Trough- low point in economic activity
Expansion- period of rising economic activity
new business cycle starts when the expansion ends, economy peaks, and a new recession begins
Potential output
the level of output that occurs when all resources are fully employed
the economy is operating at its healthy limit
economic growth in the long-run reflects the fact that potential output rises over time
Output gap
difference between actual and potential output, measured as a % of potential output
100 times actual output- potential output/ potential output
What does a positive/negative output gap mean?
Negative means the economy is producing less than its potential
resources are being under-used
Positive means the economy is producing more than its potential
resources are being over-used
Boom
economy operating above its sustainable potential ex: workers pulling overtime
recessions happen when a boom turns into a bust
Bust
the economy operating below sustainable potential ex: excess unemployment, unused factories of machinery
recessions happen when a boom turns into a bust
Characteristics of the business cycle
recessions are short, sharp: expansions are long, gradual
persistent: economic conditions today are closely tied to economic conditions in the near future
impact of the business cycle is widespread
Leading vs. Lagging indicators
Leading: variables that tend to predict the future path of the economy
Lagging: variables that tend to follow the business cycle with a delay
What are the pieces that make up macro-economic equilibrium?
Quantity: total quantity of output produced in the economy as a whole
measured by real GDP
Price: average price level of all the output produced in the economy
measured by the GDP deflator
Aggregate demand curve
shows the relationship between the price level and to total quantity of output that buyers collectively plan to purchase
slopes down due to decisions about spending today vs. tomorrow
Why do interest rates influence aggregate demand?
if price levels rise, you need more money to buy the same thing
Interest rate effects: the change in the quantity of AD through investment due to the impact of price level changes on interest rates
price levels rise, and interest rates rise. Investment becomes more costly
price levels fall, and interest rates fall. Investment becomes less costly
Aggregate demand shifters
anything that changes the components of GDP
consumption and investment change when business or consumer confidence changes
government spending rises whenever policy makers decide to spend more
Federal reserve can change interest rates to make spending today more/less attractive
exports change whenever global forces change the competitiveness
Aggregate supply
shows the relationship between the price level and the total quantity of output that suppliers collectively plan to produce
slopes upward because a higher average price level leads sellers to produce a larger quantity of output and because of sticky prices
Sticky wages
wages (and other input costs) tend to adjust sporadically and with a delay
Menu costs
reflect the cost to change the price a business sells products for
when price levels rise, some businesses can’t afford to raise their own prices instantly
Recessions are ??? and expansions are???
recessions are short and sharp
expansions are long and gradual
zero lower bound
the nominal interest rate can’t go below zero
long-term unemployed
people who have been unemployed for 6 consecutive months or longer
marginally attached
someone who wants a job and who has looked for a job within the past year, but who isn’t counted as unemployed because they aren’t currently searching for work
underemployed
someone who has some but wants more hours, or whose job isn’t adequately using their skills
Human capital
the knowledge and skills that make a worker more productive (denoted H)
Physical capital
describes the tools, machinery, and structures we work with (denoted K)
Monetary policy
setting interest rates in an effort to influence economic conditions, usually done by central banks
Fiscal Policy
the government’s use of spending and tax policies to influence government decisions
Expansionary monetary policy
by lowering interest rates, the Fed can induce consumers and businesses to spend more now
Contractionary Monetary policy
raises interest rates, AD shifts left
dampens inflation but at the costs of lower output
Fiscal Multiplier
a measure of how much GDP changes as a result of both direct and indirect effects flowing from an extra dollar of spending
fiscal policy
involves the government using spending and taxation to influence the economy, aiming to manage economic conditions like employment, inflation, and growth through tools like tax cuts, increased spending, or reduced spending
monetary policy
actions taken by a central bank, like the Federal Reserve in the US, to influence the money supply and credit conditions to achieve macroeconomic goals like price stability, full employment, and stable economic growth
efficient markets hypothesis
an investment theory which suggests that the prices of financial instruments reflect all available market information
fundamental value
the perceived value of a security (which may differ from its market value), generally calculated using DCF techniques. Also known as intrinsic value.
Inflation target
publicly stated goal for the inflation rate. The Federal Reserve has stated that the is 2% on average
What is the Fed’s dual mandate?
stable prices - maintain inflation at a low and stable level, so that inflation doesn’t overly influence or distort people’s economic decision-making
Maximum sustainable employment: maintain employment in the economy at the level that allows the economy to operate at its potential output
Why does the Fed target 2% inflation instead of 0%?
to provide a buffer against deflation and allow for greater flexibility in using monetary policy to stimulate the economy during downturns
zero inflation rate could lead to “zero lower bound”
Key features of the Fed- regionally diverse
there are 12 district banks in the Federal Reserve
spread across the country, to keep an eye on the economy
local business leaders and community reps run the district banks
Key features of the fed- Independent
The government gave the Fed it’s job, but the gov can’t dictate policy of the Fed
Independent central banks have been shown to lead to more stable inflation
Key features of the Fed: Subject to oversight
Federal government still has big-picture control of the Fed
All of the powers the Fed has were given to it by the Congress
Federal Funds Rate
The nominal interest rate that banks charge other banks to lend overnight
Real Interest Rate= Nominal Interest Rate- Inflation
The Taylor Rule
A recipe that describes how the Fed often sets the interest rate in order to manage its dual mandate
How the Fed controls interest rates
By influencing banks and their reserves
Bank Reserves
The cash that banks need to keep on hand to make payments
Interest Rate on reserves: The Floor Approach
The interest rate the Fed pays banks to keep reserves
Discount Rate: The Ceiling Approach
The interest rate on loans that the Fed offers to banks through the discount window
Serves as a safeguard, banks will almost never charge each other a higher interest rate
Overnight Reverse Repurchase Agreements: The Floor Approach
The Fed sells government bonds overnight and buys them at a higher price the next day
Why does the Fed need alternative tools other than the interest rate?
Makes it more or less valuable for banks to make loans
Forward Guidance
Providing Information about the future course of monetary policy in order to influence expectations about interest rates
— only works if people believe the Fed
Quantitative Easing
Purchasing large quantities of longer-term bonds, in order to lower long-term interest rates
By doing this, the Fed makes it easier for people to make long-term investment