Titration curves and indicators
1/19
There's no tags or description
Looks like no tags are added yet.
Name | Mastery | Learn | Test | Matching | Spaced | Call with Kai |
|---|
No analytics yet
Send a link to your students to track their progress
20 Terms
What is the end point
The pH when the indicator changes colour
What is the equivalence point
the pH when the acid and alkali have reacted together in the exact quantities as per the balance equivalence
What needs to be the case for an indicator to be used in a titration
The end point needs to coincide with equivalence point
Sketch and explain the titration curve of strong acid/strong base
initial pH change is small, proportion of H+ ions removed by reaction is small compared to the overall amount of H+ ions
pH rises faster as more base is added, rate of change increases as more OH- is added. Start of curve, 1 drop makes big difference as very few H+ ions left in solution
Equivalence point → moles of [OH-]= moles of [H+], at pH 7
Any further alkaline added as small impact on pH as amount is small compared to total volume of solution
![<ul><li><p>initial pH change is small, proportion of H+ ions removed by reaction is small compared to the overall amount of H+ ions</p></li><li><p>pH rises faster as more base is added, rate of change increases as more OH- is added. Start of curve, 1 drop makes big difference as very few H+ ions left in solution</p></li><li><p>Equivalence point → moles of [OH-]= moles of [H+], at pH 7</p></li><li><p>Any further alkaline added as small impact on pH as amount is small compared to total volume of solution</p></li></ul><p></p>](https://knowt-user-attachments.s3.amazonaws.com/f07ef1ab-d8a8-4156-90f4-43dc8a5ee1b7.jpg)
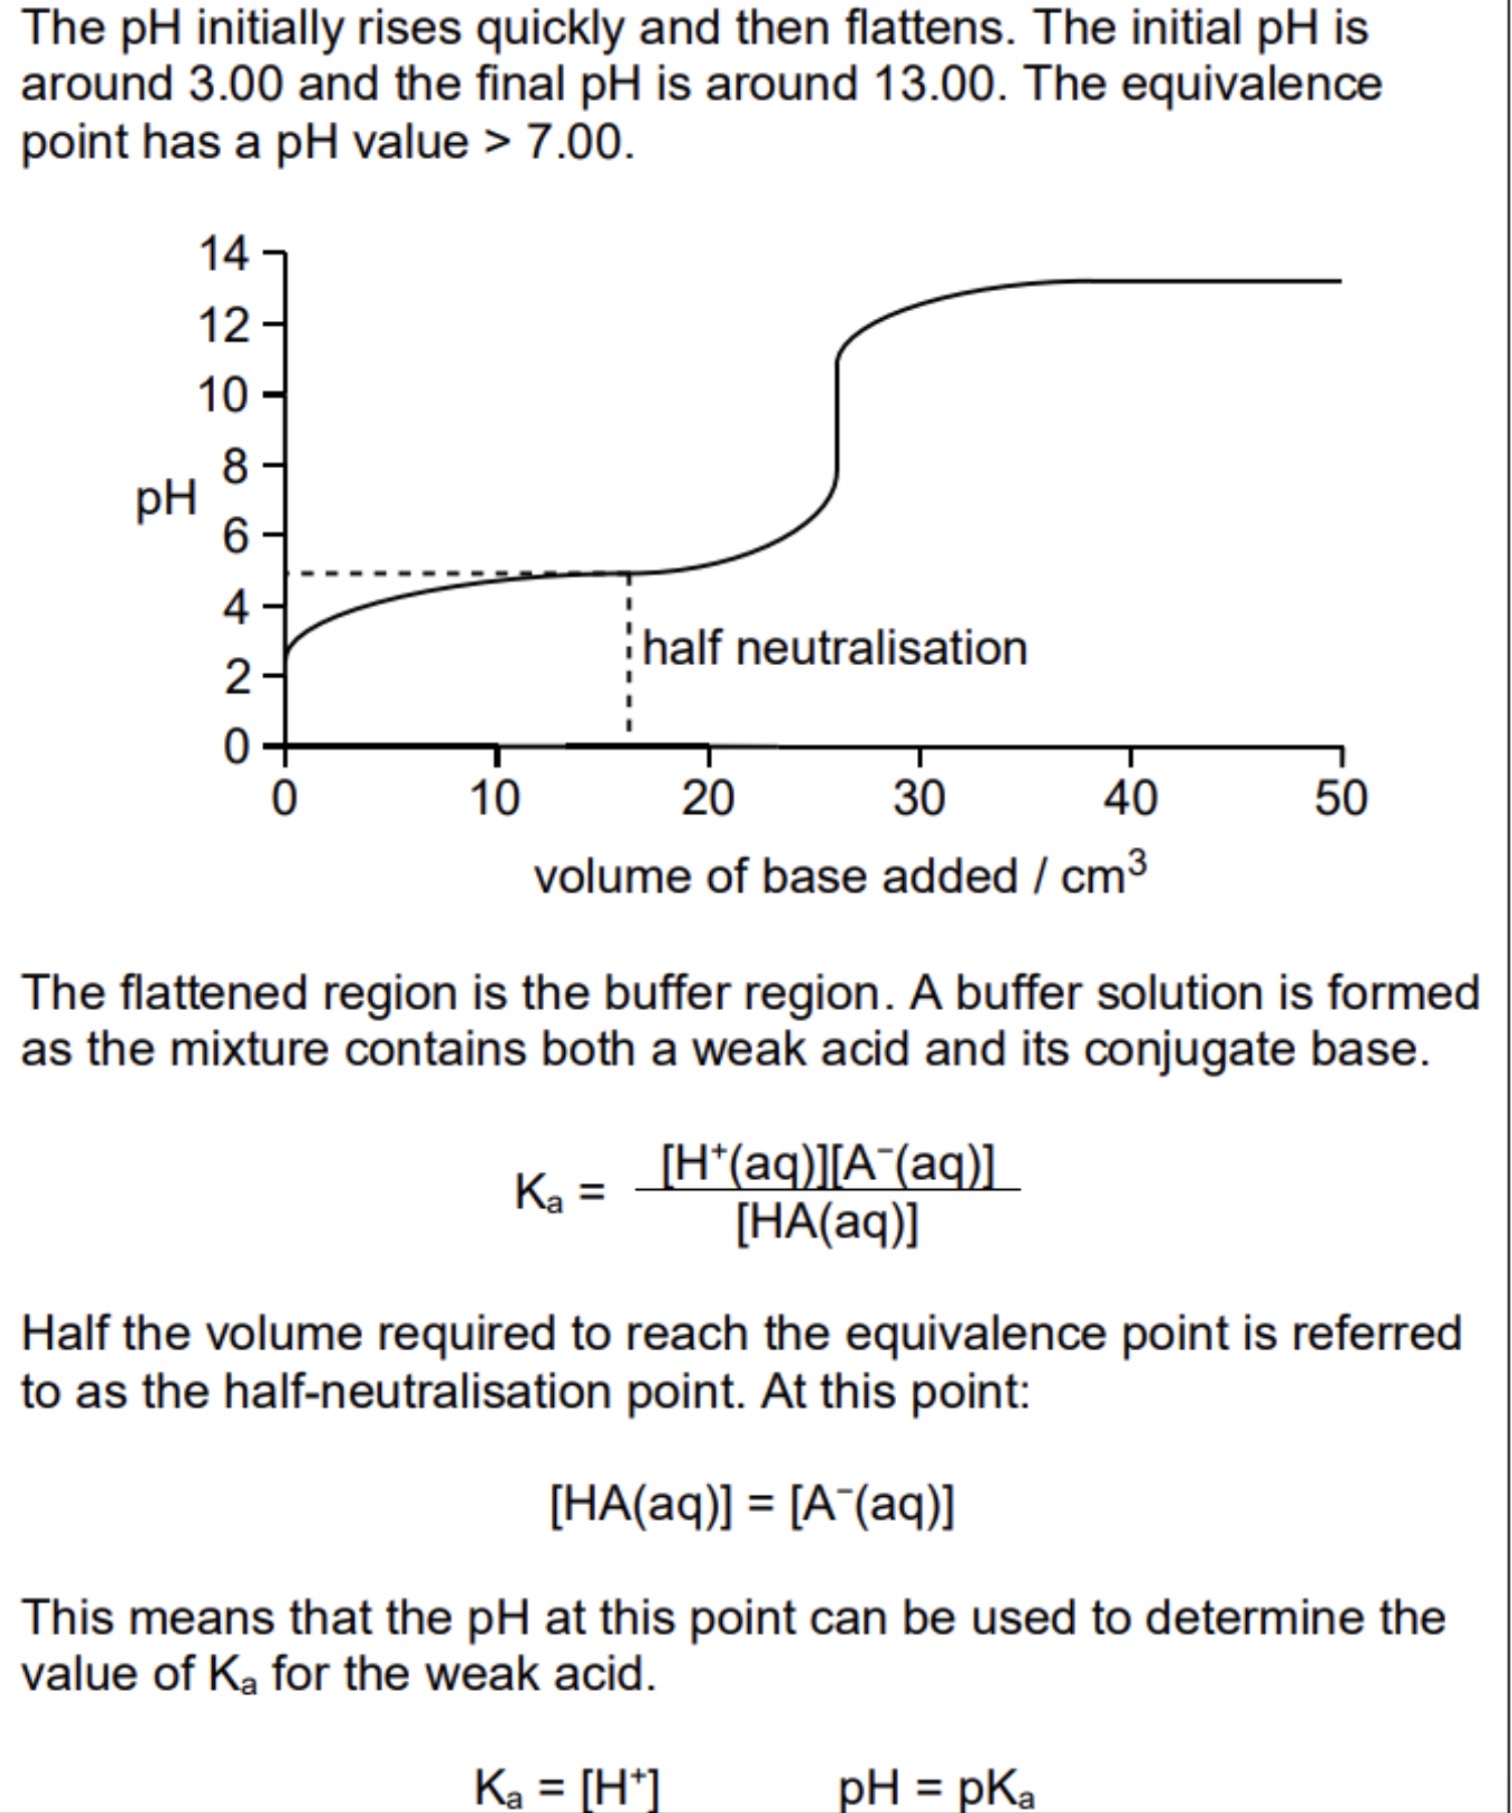
Sketch and explain the titration curve of weak acid/strong base
Initially pH rises fast as rapid change in pH with added OH- rise becomes less steep as buffer made which resists change with further OH-
Steep rise during neutralisation
Equivalence point above pH 7
No more buffer after neutralisation after neutralisation as weak acid used up
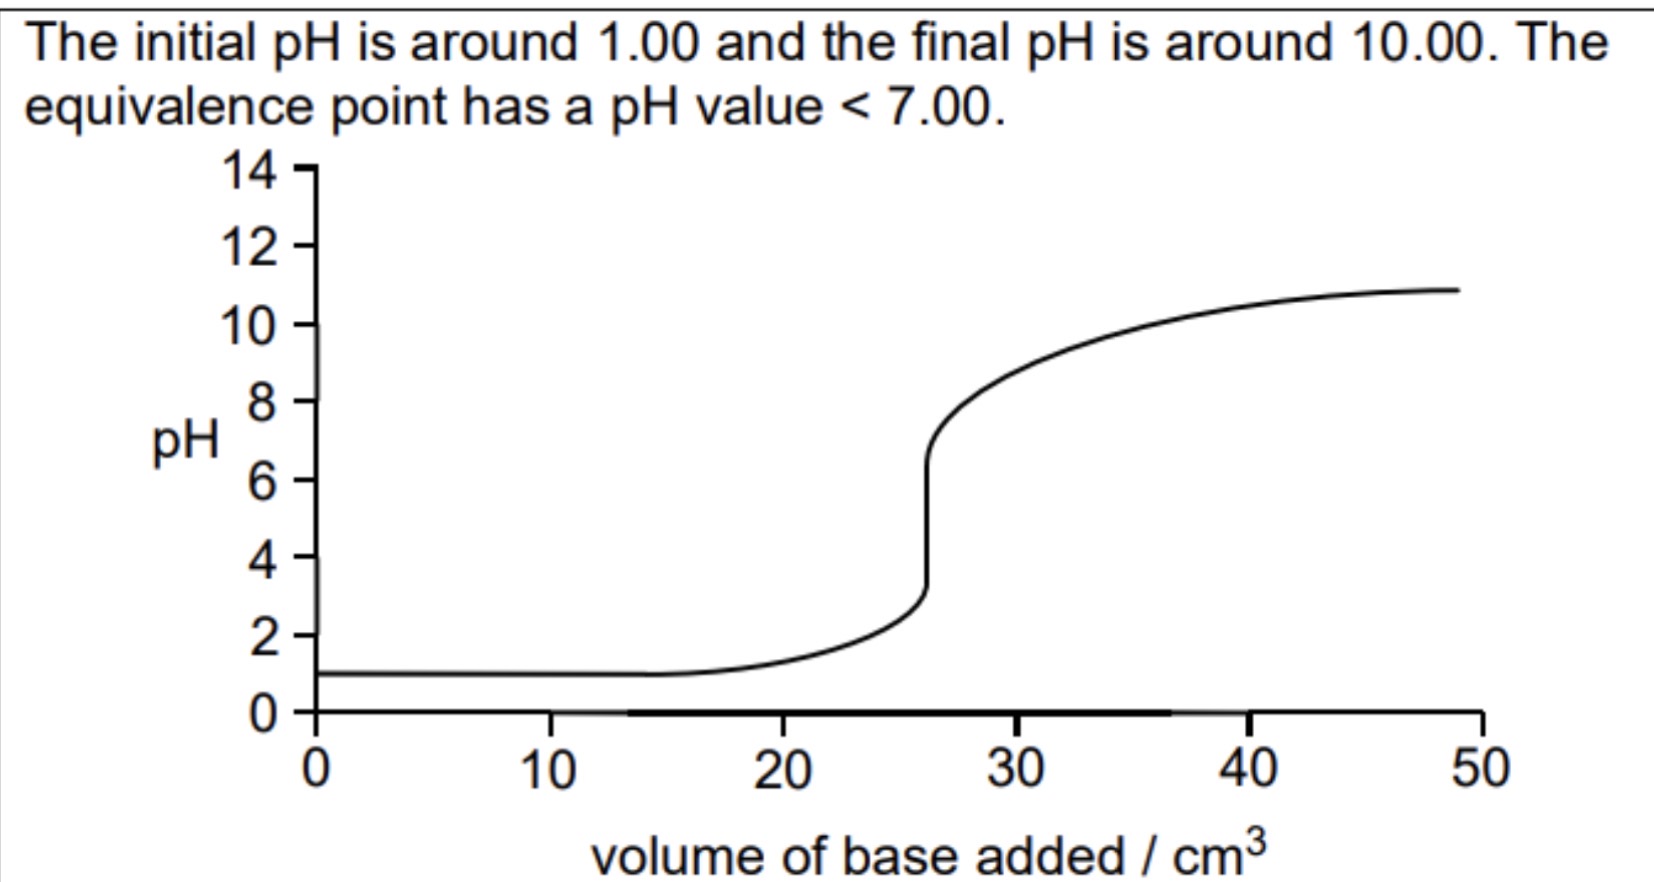
Sketch and explain the titration curve of strong acid/weak base
initial rise is small
Steep rise during neutralisation during neutralisation
Equivalence point below 7
Rate of pH change is low after neutralisation as buffer solution formed from weak base added to salt of conjugate acid
Steep rise at end as amount of base continues to increase, buffer no longer effective
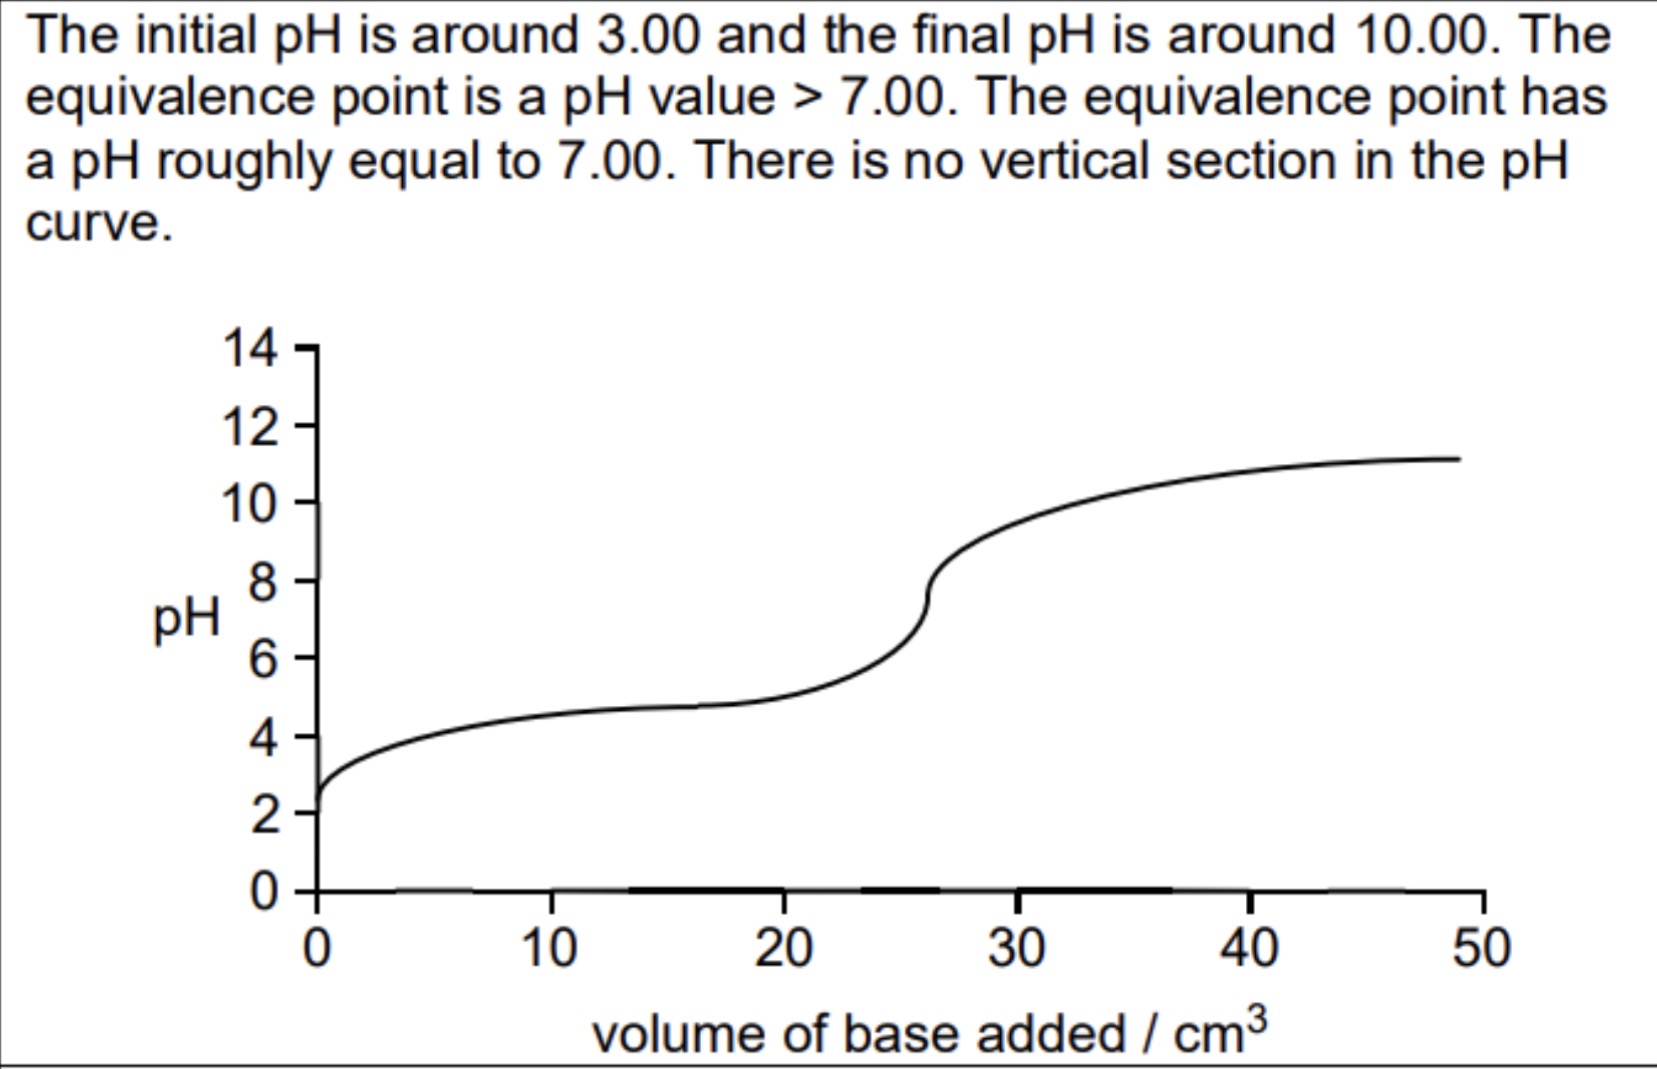
Sketch and explain the titration curve of weak acid/weak base
No vertical as buffered both before and after the equivalence point
Explain the graph when a strong base is added to a weak acid
initial sharp rise to buffer region then vertical section at Xcm³
(Or gradual rise to vertical section at Xcm³)
Vertical within pH range X-X
End pH value in range X-X
Give the overall equation for the reaction between sodium carbonate and hydrochloric acid
Na2CO3 + 2HCl → 2NaCl + CO2 + H2O
(If two solutions of the same concentrations, double the volume is needed of HCl to reach equivalence point
Explain what is happening in this graph (HCl being added to sodium carbonate solution)
Carbonate doesn’t produce CO2 at first
Na2CO3 + HCl → NaCl + NaHCO3
As soon as halfway point is reached, lots of carbon dioxide is suddenly released as the sodium hydrogen carbonate produced goes on to react with more of the HCl
NaHCO3 + HCl → NaCl + CO2 + H2O
Graph therefore shows two end points, at about pH 8.3 and 3.7
How does the reaction between sodium hydroxide and dilute ethandioic acid take place
takes place in two stages as one of the hydrogens is easier to remove than the other
HCOOCOOH + NaOH → HCOOCOONa + H2O
HCOOCOONa + NaOH → NaCOOCOONa + H2O
Therefore curve shows end points for both reactions
Why is the pH at the equivalence point for a solution of sodium propanoate greater than pH7? [3]
Propanoate ions/potassium propanoate present
Propanoate ions react/are hydrolysed with water/ the H+ from water
Forming hydroxide ions/leaves excess hydroxide ions
CH3CH2COO- + H2O → OH- + CH3CH2COOH
What makes a good indicator? [3]
needs to have 2 distinct colours in acid and base forms
Needs to be soluble
Needs to be an intense colour so only a few drops are needed
What is a indicator and how do they work
weak acids that partially dissociate in aqueous solution
HIn ←→ H+ + In-
The unionised form of HIn is different colour to the anionic form In-
Protonated form = with H+ therefore in acidic conditions
When does an indicator change colour / reach the end point
when [HIn] = [In-]
Using HIn ←→ H+ + In-, Kind = [H+][In-]/[HIn]
Therefore when [HIn] = [In-], Kind = [H+]
This means that the indicator will change colour when pKind=pH
Justify the use of X indicator
pH at equivalence point is very close to pKin
PH range is (completely) within the (first) vertical jump in the titration curve/between the range of (pH)
What is used to check the pH of a titration between weak base and weak acid
pH probe
Outline the method to find the Ka value of a weak acid titrated against a strong base
Method 1
titrate weak acids against strong base
Measure the pH at regular intervals
Plot pH against volume
Use graph to find the pH at half equivalence point, i.e. when half the acid has been neutralised
pH = pKa, so Ka= 10^-pH
Method 2
titrate weak acids against strong base
Use phenolphthalein indicator to find end point
Then add same volume of acid as was started with to the mixture at end point
Measure the pH of the resultant mixture using a pH probe
Ka=10^-pH
Why can you use the half equivalence point to find the Ka of a weak acid
At the half equivalence point, Ka=[CH3COO-][H+]/[CH3COOH], the salt and acid concentration is equal, meaning pKa=pH
What is the relative concentration of salt and weak acid at the half equivalence point of a titration curve of strong base added to weak acid
At the equivalence point, all the acid has reacted so only salt is present