ED. 19 allometry and scaling laws
1/18
There's no tags or description
Looks like no tags are added yet.
Name | Mastery | Learn | Test | Matching | Spaced | Call with Kai |
|---|
No analytics yet
Send a link to your students to track their progress
19 Terms
How did different sized organisms evolve
rules of geometric similarity, and what it means for living organisms
Greek philosophers (300-200 BCE), Euclid Archimedes codified the geometric ‘laws’ of increasing size - surface area increases by the square of linear dimension, volume increases by the cube of linear dimension
Galileo discussed growth in size - maximum size limits vs changes in relative proportions and strength of materials
Allometry
the study of the relationship between size and shape, how biological processes scale with body size and with each other and the impact of this relationship on ecology and evolution
allometry is best understood as a result of differential growth (explained by developmental biology)
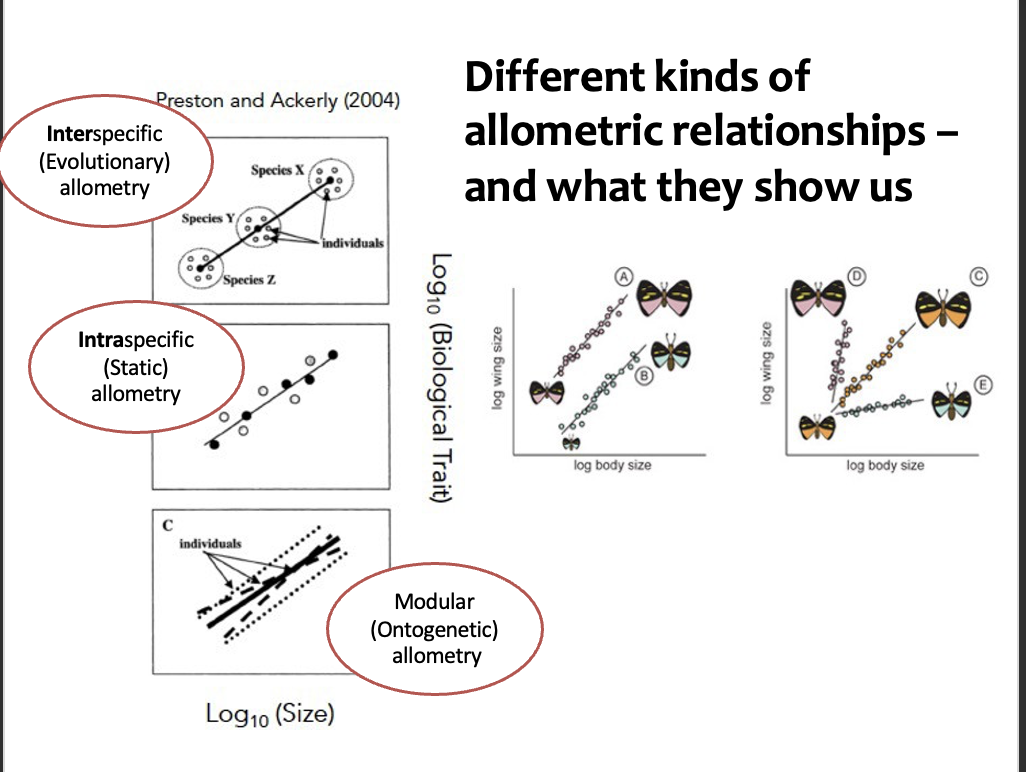
Can be studied at three levels:
static - size relationship of traits among individuals of the same age - typically adults
evolutionary (infraspecific) - size relationship among species
ontogenetic (intraspecific) - growth relationships during development between two traits or between one trait and the whole organism
Allometric Equation
Y = aXb (power function)
Y = body part being measured in relationship to the size of the organism
X = measure of size used for basis of comparison (usually a measure of body size e.g. mass or length)
a = initial growth index (size of Y when X = 1)
b = allometric or scaling exponent (proportional change in Y per unit X)
Scaling exponent → if b=1
defines the type of scaling relationship
if b=1, there is no differential growth:
the relative size of Y to X is the same at all values of X
isometry (maintenance of geometric similarity)
Scaling exponent → if b<1
if b<1, Y increases at a slower rate than X:
as X increases, Y becomes relatively smaller
negative allometry
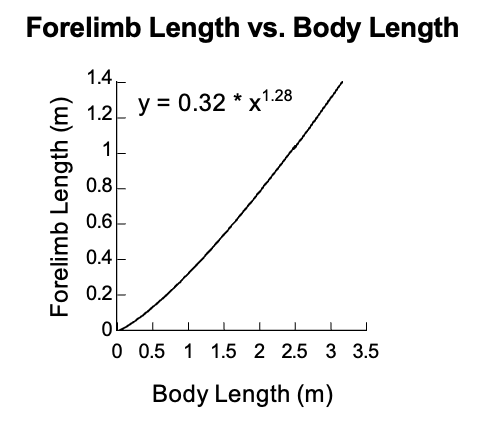
Scaling exponent → if b>1
if b>1, Y increases at a faster rate than X
as X increases, Y becomes relatively larger
positive allometry
Allometric data expressed as linear functions of log-transformed data
Y=aXb
to
log Y = log a + b log X
the slope of the line (b) indicates the type of scaling relationship
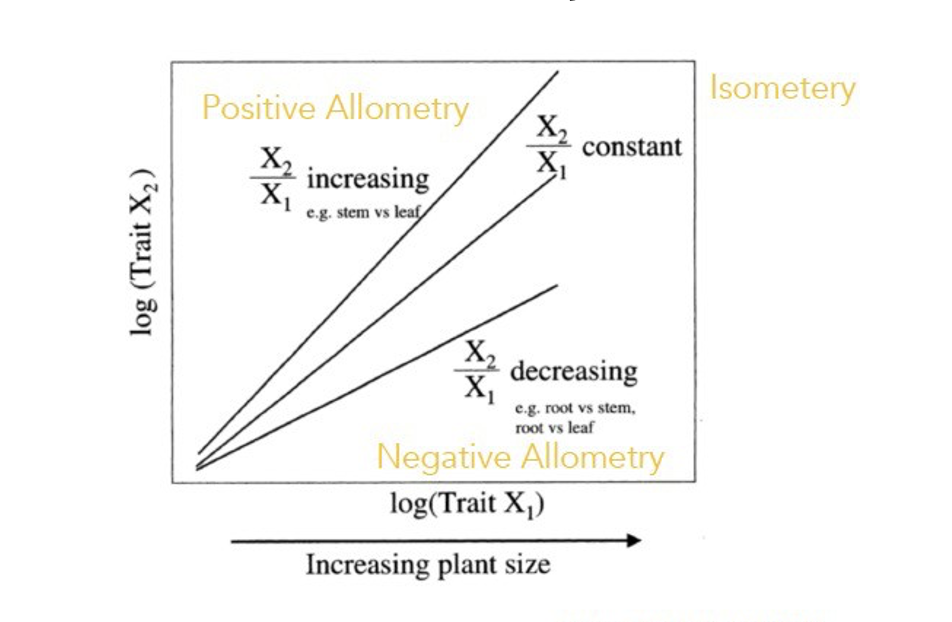
Types of scaling relationships
if b = 1, isometry (geometric similarity)
if b<1, negative allometry
if b>1, positive allometry
but the above is only true when we compare like dimensions such as length vs. length, mass to mass
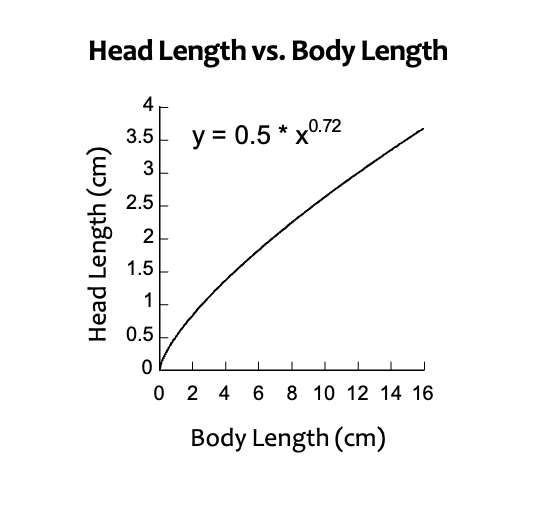
Isometry for different dimensions
e.g. head length to body length
linear dimension (m1) vs. linear dimension (m2)
e.g. head length vs. body mass
linear dimension (m1) vs. cubic dimension (m3)
isometry: m1/m3, b=1/3 =0.333
e.g. surface area vs. body mass
square dimension (m2) vs. cubic dimension (m3)
isometry: m2/m3, b = 2/3=0.667
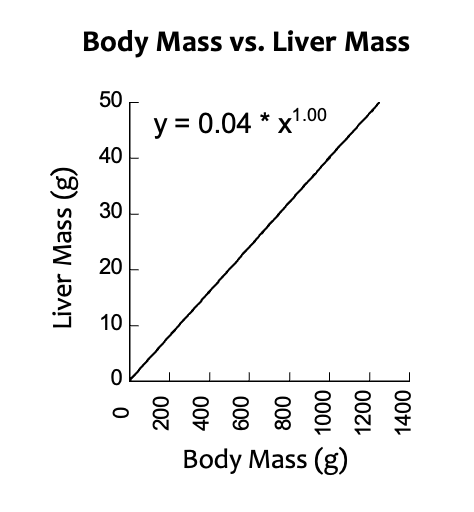
Scaling of skeleton to body
we expect b=1 for skeleton mass/body mass isometry
however, because of the increased weight loading, may expect b>1:
→ skeleton becomes relatively more massive with increased body size
remember that skeleton (dense bone material) itself disproportionately adds to body weight
considering the properties of the skeleton, we observe the scaling of 1.33 for isometry for skeletal weight loading
Implications of scaling and importance of body size and mass
a male African elephant weighs 11,000 kg, whereas the piebald shrew weighs 11g
these animals differ in body mass by 3 orders of magnitude
Why is size and scaling important
living organisms vary hugely in body mass and size
the magnitude of many biological/physiological processes depends on the body size and mass e.g.:
→ it determines the surface/volume ratio of an organism
→ it affects the metabolic rate, respiration, digestion, water balance, thermoregulation etc.
Geometrically similar objects have predictable properties
in geometrically similar objects:
the ratio of two linear dimensions is equal and independent of the size of the objects
if L = length (or a linear dimension) then:
area is proportional to L2 - areas increase with the square (L2) of linear dimensions
mass and volume are proportional to L3 - volumes (and hence masses) increase with the cubic (L3) of linear dimension
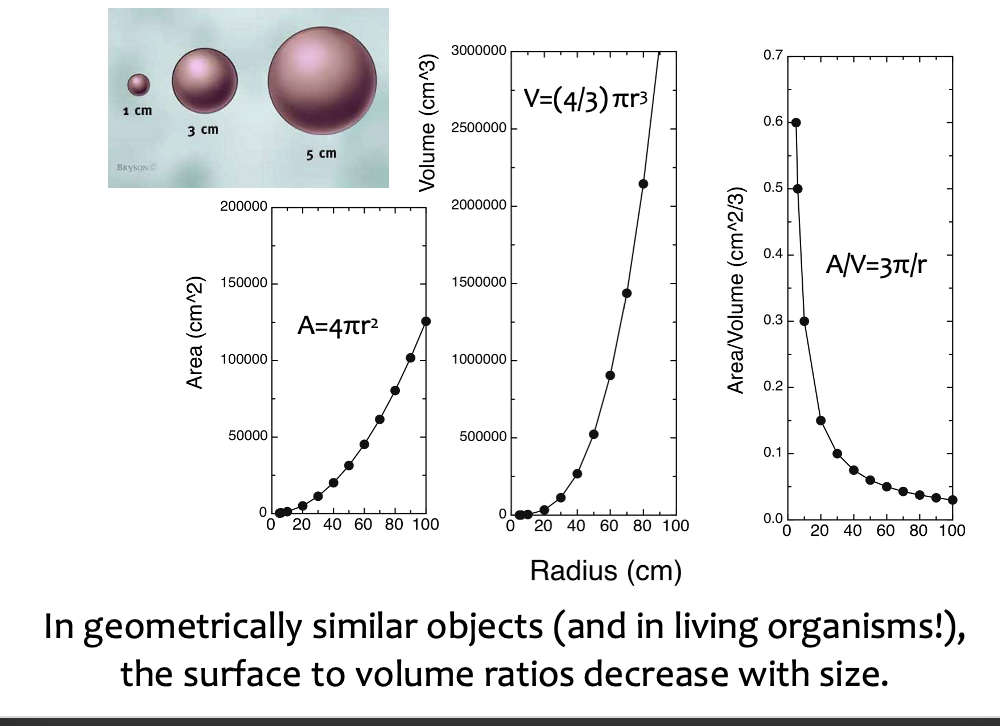
SA: vol decreases with an organisms size
the exchange surfaces (epithelia) tend to increase their areas of contact by folding, flattening, and branching
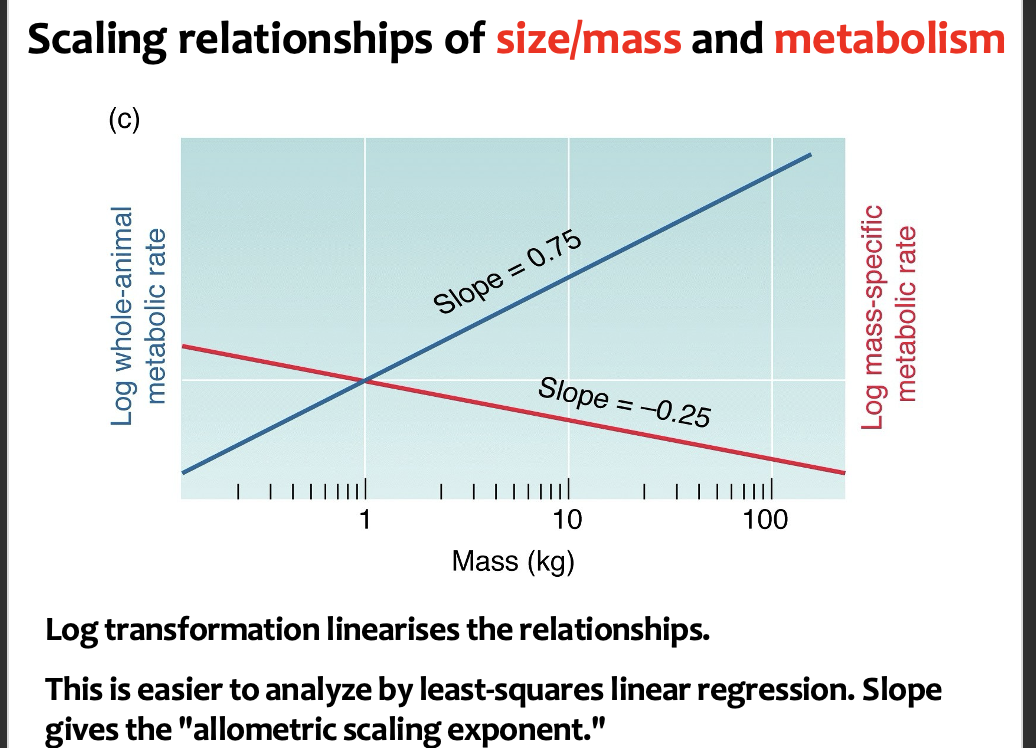
Scaling relationships of size/mass and metabolism
the amount of energy used by animals per unit mass decreases with body size - per gram, a shrew uses a lot more energy than an elephant
How does differential scaling arise
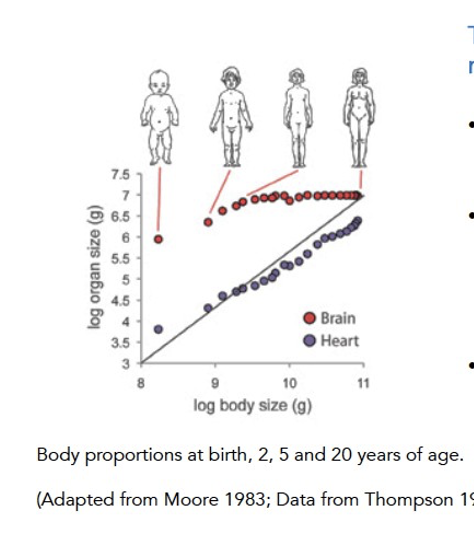
ontogenetic growth - growth during development
allometric growth in humans - juveniles are not isometrically scaled models of adults (the brain and heart grow at different rates relative to the body
growth of the heart is more or less isometric to body size
in contrast, growth of the brain is initially hypoallometric to body size, before growth stops once the body reaches a certain size, at about age 6
consequently, head size becomes proportionally smaller as individuals grow to their final body size
Using allometry in biology
quantify similarities and differences between taxa (populations, individuals etc.) - differences in the intercept of the allometry between species indicate differences in the proportionate size of the wing, irrespective of body size
points to operation of similar or differing processes - in contrast, differences in the slope of the allometry between species indicate differences in how the relative size of the wing changes with body size within a species
can use propose and test theory - the slope and the intercept for morphological static allometries captures the relationship between size and form within and between species
How we use allometry in biology
organismal growth occurs in a way to preserve correct size relations between all traits results - so there must be general mechanisms of development that govern trait value and these mechanisms must be remarkably robust
one of the great challenges, then, is to discover how these size relations are generated
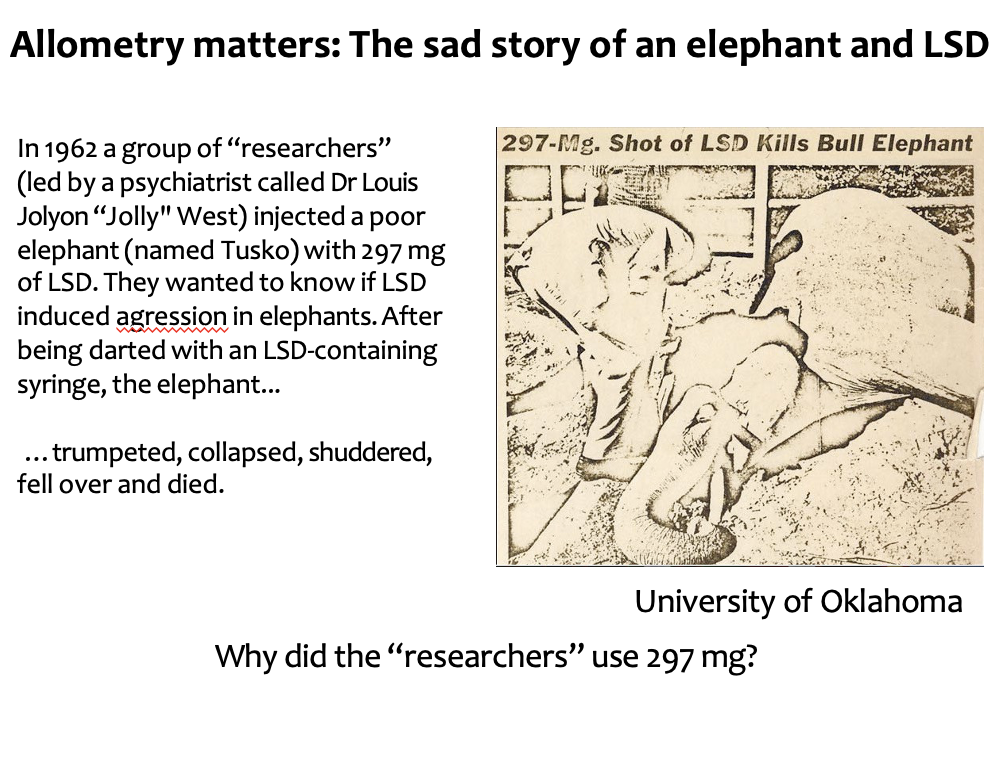
Allometry matters - the sad story of an elephant and LSD
a previous study found that a dose of 0.1mg was safe for 2.6kg cats but sufficient for a psychotic effect - Tusko weighed 7722 kg, and hence Jolly and co. decided to scale up the dose by 2970
body mass is the determinant of the magnitude of most physiological processes such as metabolic rate, but these processes often do not vary in direct proportion with body mass