1. SRAS and Phillips Curve
1/46
Earn XP
Description and Tags
Mankiw - Ch.15
Name | Mastery | Learn | Test | Matching | Spaced | Call with Kai |
|---|
No analytics yet
Send a link to your students to track their progress
47 Terms
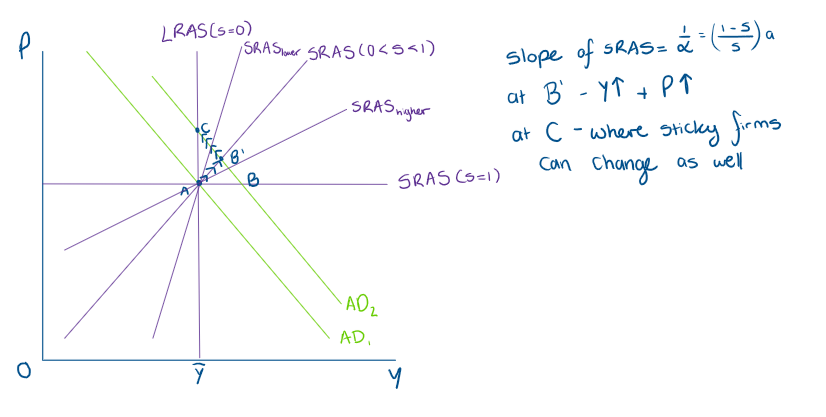
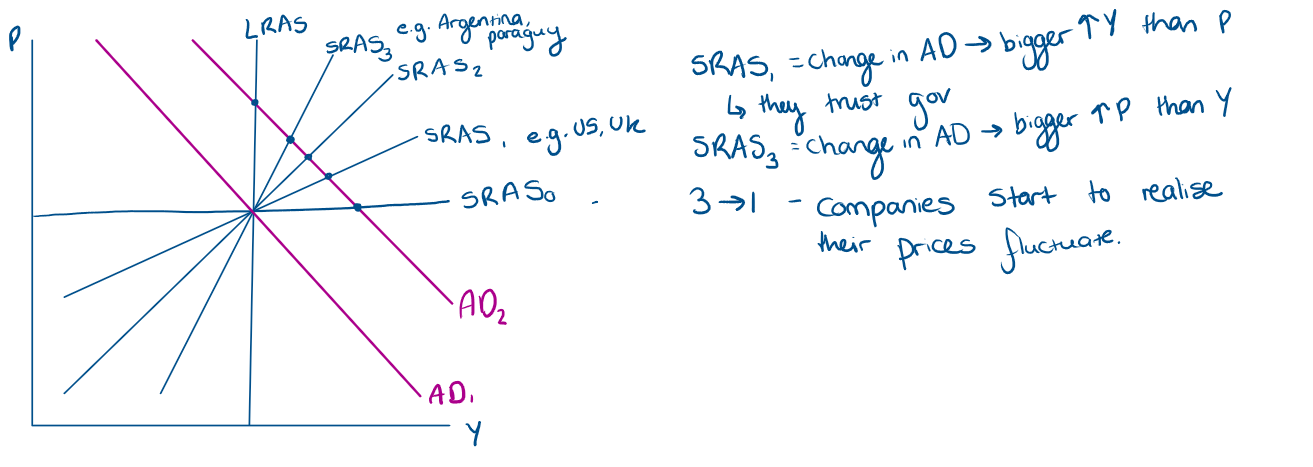
What does an increase in AD have on the SRAS curve?
shifts in AD only affect output in Sr and only effect price in Lr

How us price level, P weighted?
How much is consumed
What are the 2 different types of frictions?
Sticky prices - some fraction of prices are fixed and the remainder are flexible (P can change in SR but not entirely)
Imperfect information - the general price level is not perfectly observed (better to be able to explain where something comes from)
When is sticky prices not realistic?
The possible exception of a deep recession/depression.
What is the equation for SRAS?

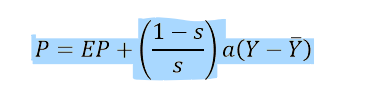
What is the equation for Price level?

What does the line for SRAS look like?
Upward sloping?
What is the key friction that leads to the Sticky-Price Model?
Firms don’t immediately adjust their prices following a change in demand for their g/s
Why does the key friction for the Sticky-Price Model arise?
long term agreements with customers -e.g. contracts
menu costs - costly for firms to change prices - time + effect + money cost → don’t change
sticky wages - labour is an important F.o.P - firms cant decrease wages → don’t decrease prices
What is an individuals Firm’s ‘desired’ price (p)?
What they would like to set if they could
firms would set the price p if they were able to adjust continuously

What are the 2 groups of firms?
Firms with flexible prices - always set desired price:
p = P +a(Y-Y¬)
Firms with sticky prices - set price in advance
p = EP + a(EY -EY¬)
based on expectations
assume EY = EY¬, then p = EP f
Why are there 2 groups of firms
Not all able to change prices at the same time
What is the equation for the General price level? When you have sticky vs flexible firms?
weighted average of the prices set by the 2 groups of firms

What happens when you rearrange the General Price level and what does it imply
1/alpha = (1-s/s)a >0, therefore AS has to be upward sloping, and (1-s/s) needs to be positive
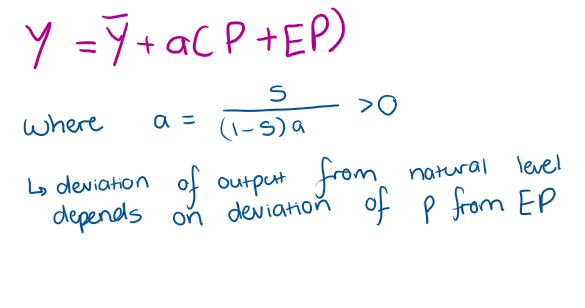
What does the equation for General price level imply and what model does it show?
What is the equation for Y?
What is Model 2 and what are its assumptions?
Imperfect-Information Model
generates upward sloping SRAS curve but bc of information friction
Assumptions:
Prices are fully flexible - no sticky prices
Each supplier produces a single good but also consumes goods produced by other suppliers
Key friction: there are many good - suppliers are unable to perfectly observe all prices at all times
they know the price of the good they produce but it is too costly to monitor the prices of all other goods
What is the suppliers problem?
Suppliers choose how much to produce based on relative prices
Pi - price of good i produced by supplier i:
supplier i sells its product for the price Pi and uses this income to buy goods from other suppliers
if Pi/P is high then supplier i is motivated to work harder and supply more goods to the market
information problem (the key friction): supplier i knows Pi but observes P imperfectly
What is the function for supplyi?
Supplyi = f(Pi/P)
What happens to Supplyi if all prices rise by x%?
P must also increase by x% but supplier i cannot perfectly observe P
Supplier i simply observes an increase in Pi by x%
Should supplier i increase output?
no its relative price has not changed. however, with imperfect information supplier i could misinterpret the rise in Pi as an increase in Pi/P
All commodities increase by P so relatively not better off incentive to work harder has changed
What is the role of expectations in imperfect information
Supplyi = f(Pi/EP)
in previous example - supplier i doesn’t increase if the price was expected,
if price was unexpected then supplier i will increase output
Why do all suppliers have the same problem?
If P increase unexpectedly, ceteris paribus, Y increase in respond.
If P >PEP suppliers mistakenly interpret a rise in ‘own price’ as a rise in relative prices and increases production
the extent to which they responds depends on α
if α is larger then SRAS will be flatter
What happens in countries were AD fluctuates a lot using imperfect information model relate to 1/α
P will also fluctuate a lot
Suppliers should realise/learn that unexpected changes in own price (Pi) are unlikely to signal a change in relative price (Pi/P)
they should not alter their output level upon observing an unexpected change in Pi
Y should not respond to P ≠EP, α should be small, SRAS curve should be steep
If countries have more stable AD then SRAS should be flatter
What does the SRAS look like for different α?
How does Y = Y¬ + α(P-EP) apply in the model?
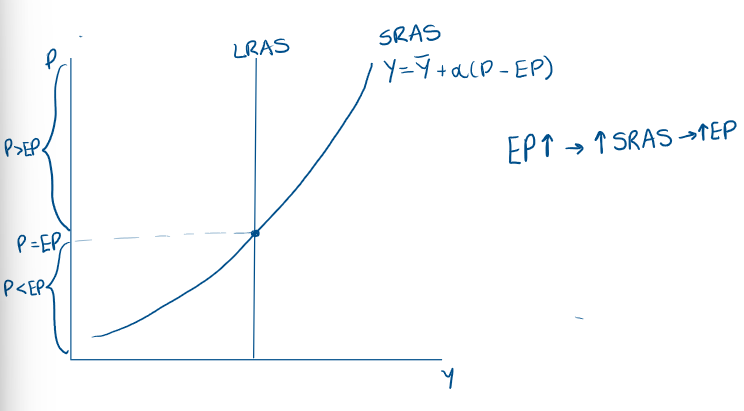
What does an ADAS curve look like if P>EP?

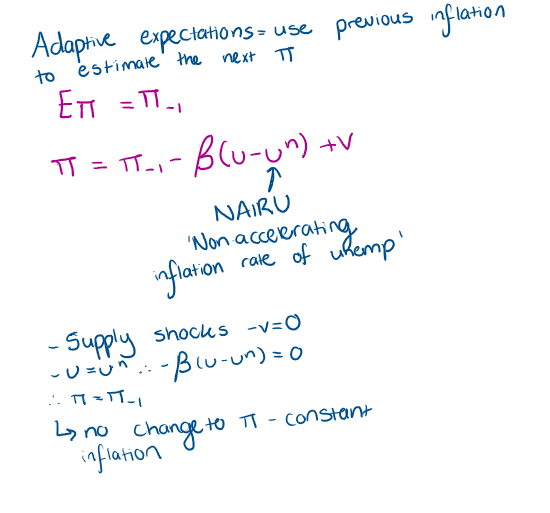
What does inflation depend on?
expected inflation
cyclical unemployment
Supply shocks(e.g. oil prices)
What is the modern form of the Philips curve? or the unemployment version?
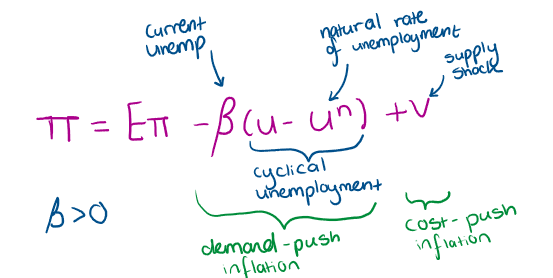
What happens to inflation if unemployment increases?

What happens to inflation if there is a supply shock?

How do you derive the Phillips curve?
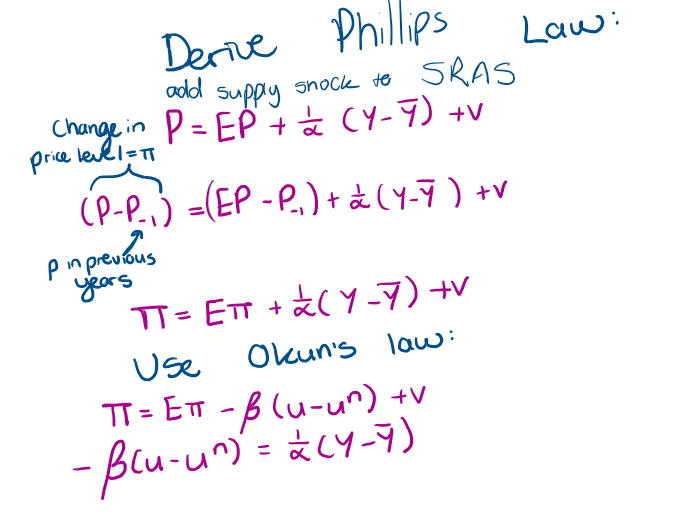
What is the relationship between output and unemployment?
negative and statsitical
can rewrite (1-α)(Y-Y¬) = B(u-un)
What is the difference between the modern and old phillips curve
Now uses price inflation instead of wage inflation 0 fairly closely correlated - conceptually different but statistically not
now features expectations (based on Friedman (1968) and Phelps (1967)
now inc supply shocks - influenced by shocks of 1970s
What are the 2 types of inflation and what are they
‘Demand-pull’ inflation
a decline in cyclical unemployment (u-un) places upward pressure on the rate of inflation
strong econ → decrease unemp → increase inflation
‘Cost-push’ inflation
v> 0 for an adverse shock
What is the theoretical implication of the philips curve?
classical dichotomy breaks down in SR
classical dichotomy - nominal and real variables don’t depend on each other
real variables do depend upon nominal variables
Upward sloping SRAS - output depends upon unexpected changes in the price level
Phillips curve: unemployment depends upon unexpected change sin the rate of inflation
What is the policy implication of the Phillips curve? show a diagram
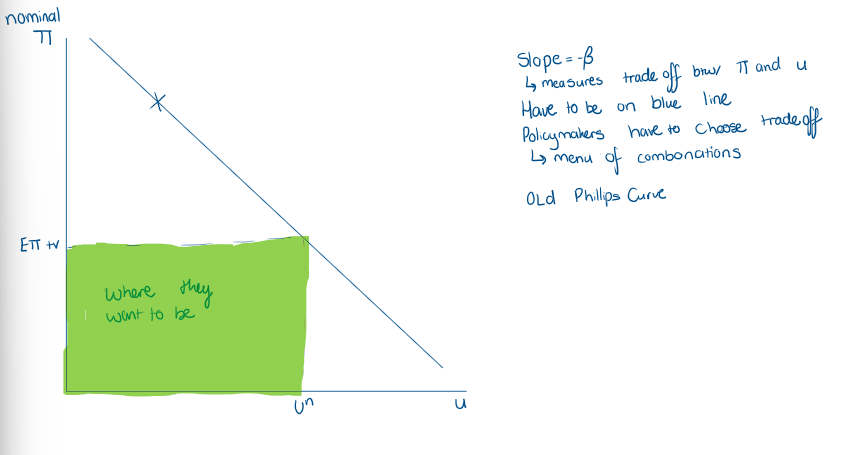
Why is the Phillips Curve important?
If gov wants to bring down inflation
According to the Phillips curve, this requires higher unemployment for a time
useful for policymakers when deciding whether or not to embark upon disinflationary policy
how much output to sacrifice to bring down inflation
role to quantify the sacrifice
quantify the trade off - related to trade off from Phillips curve
What is the sacrifice ratio
% of annual GDP required to bring inflation down by 1 percentage point
What happens if you include inflation expectations onto the Phillips curve? - Modern Phillips curve

How do you prove that unemployment reaches the natural level of unemployment
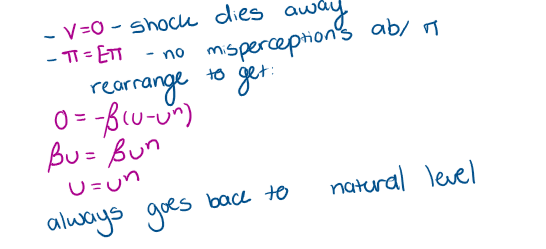
What happens in the Long run?
output and unemployment are at their ‘natural level’ bc the LRAS is vertical
‘classical dichotomy’ is restored
What does un depend on
‘supply-side factors’
eg. pop growth or quality of the workforce
tend to be longer term
What can be shown from the empirical application. US Datat 1960-2019?
There is no produced phillips curve
there is an approx line of best fit, somewhat downward sloping, looks curved not linear but shows negative relationship btw inflation and unemployment in 60s
70s - increase in expected inflation due to inability to react to shocks
80s - conscious decision → decrease inflation → phillips curve starts to shift down
What is the natural rate hypothesis?
the rate of unemployment may depart from un in the short run but returns to un in the LR
should come back how it started
Why do some economists disagree with the natural rate hypothesis?
they believe un can increase with the rate of unemployment - permanent ‘scars’ - but there is no consensus on this
stretched too for it doesnt come back
bad recession → unemployment duration increase
Example: hysteresis
ppl who have been out of work for an extended period of time become less employable - lost skills
higher SR unemp → higher Lr unemp
we dont have it in our model
What is adaptive expectations and how can we use it?