genomics - rna biology II
1/54
There's no tags or description
Looks like no tags are added yet.
Name | Mastery | Learn | Test | Matching | Spaced | Call with Kai |
|---|
No analytics yet
Send a link to your students to track their progress
55 Terms
RNA seq
genomic technique that uses next gen sequencing to analyze the quantity and presence of rna molecules in a biological sample
how to remove highly abundant rRNA
-rRNA is >90% of total RNA
-enrich for mRNA using polyA selection, which requires higher amount of starting material and minimal degradation
-Or deplete rRNA when quantity is low or RIN is low (prokaryotes can only use rrna depletion)
polyA selection
-can be done during illumina rna seq library prep
-RNA degradation produces 3’ bias
-non-polyA RNAs are not recovered
ribosomal rna subtraction
-species-specific probes
-allow enrichment of non-poly(a) transcripts
increase in biological replication
significantly inc power and number of differentially expressed genes identified
easier outlier detection and removal
how many replicates do i need
-minimum 3-6 biological replicates
-statistical power increases w effect size, sequencing depth, and number of replicates per group
how many reads do we need
>10 reads per gene per sample is standard cutoff
reads for mrna genes
5-30 million reads per sample
reads for mrna transcripts
for measuring alternative splicing
30-60 million reads per sample
reads for transcript discovery
100-200 million short reads
long read data better
reads for mi-rna seq or small-rna
-varies significantly depending on the tissue type being sequenced
-most applications require 1-5 million reads per sample
read length
-affects the ability to determine where each read in the transcriptome came from
-longer reads do not add much value in quantification-based analysis but valuable to isoform analysis
gene expression/rna profiling read length
50-75 bp
read length for novel transcriptome assembly and annotation
longer, paired-end reads (2 × 75 bp or 2 × 100 bp), or long read sequencing
read length for small rna
a single read(usually a 50 bp read) typically covers the entire sequence
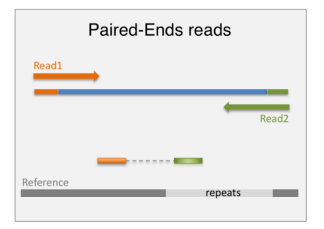
paired end sequencing
-improves read mapping
-preferred for alternative-exon quantification, fusion transcript detection and de novo transcript discovery, particularly when working with poorly annotated transcriptomes
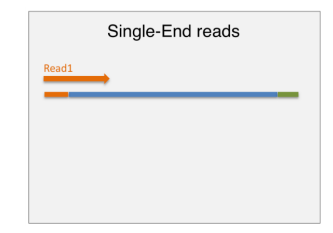
single end sequencing
DNA contamination
-can be mapped back as intergenic or intronic sequence
-cannot distinguish between contamination vs alternative splicing, unannotated or noncoding transcripts, or spurious transcription
-treat w DNase to remove dna contamination
illumina short read sequencing
<200 bp
-the de facto method to detect and quantify transcriptome-wide gene expression
-cheaper
-easier to implement
-comprehensive, high quality data
long read cDNA sequencing
-converting mrna to cdna before sequencing
-pacbio and nanopore
-up to 50 kb
generate full length isoform reads
-isoform detection
-de novo transcriptome analysis
-fusion transcript detection
long read direct rna sequencing (drna-seq)
-no cdna synthesis or pcr amplification during library prep
-nanpore
1-10 kb
-all analysis same as long-read rna seq
-detect base modification
-estimate poly A tail length
long read technologies limitations
-lower throughput
-lower sensitivity, depends on rna integrity, and cdna synthesis can be truncated
-biases inherent to sequencing platforms
-low diffusion of long library molecules onto the surface of the sequencing chip can reduce the coverage of longer transcripts
main sources of variation
batch effects
lane effects
batch effects
any errors that occur after random fragmentation of the rna until it is input to the flow cell
ex: pcr amplification and reverse transcription artifacts
variations in reagents, supplies, instruments and operators may introduce random or systematic errors at any step of rna-seq data generation
lane effects
any errors that occur from the point at which the sample is input to the flow cell until data are output from the sequencing machine
ex: systematically bad sequencing cycles and errors in base calling
randomization
randomize samples across library preparation batches and lanes so as to avoid technical factors becoming confounded with experimental factors
FastQC
assessment of data quality
-num of reads
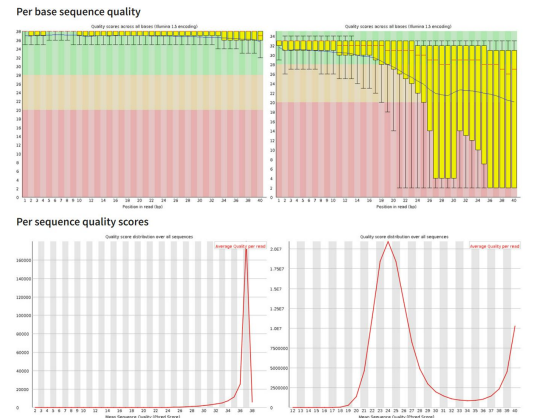
-per base sequence quality
-per sequence quality score
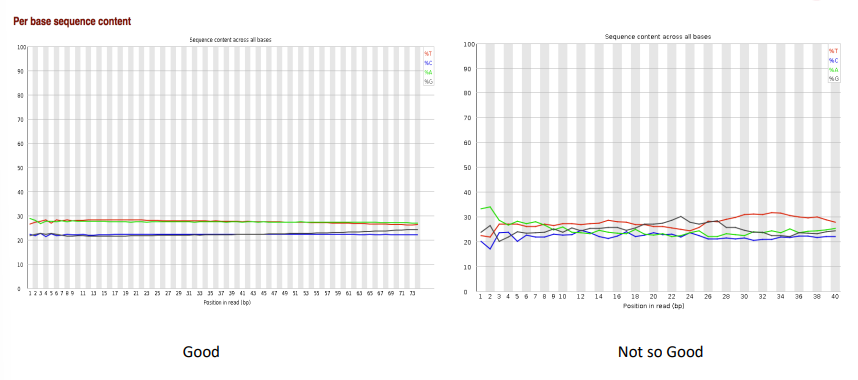
-per base sequence content
-per sequence GC content
-per base N content
-sequence length distribution
-sequence duplication levels
-overrepresented sequences
-adapter content
-kmer content
per base sequence quality
-read quality decreases towards the 3’ end of reads
-to improve read mappability, discard low qual reads, trim adapter sequences, and eliminate poor qual bases
per sequence quality scores
per base sequence content
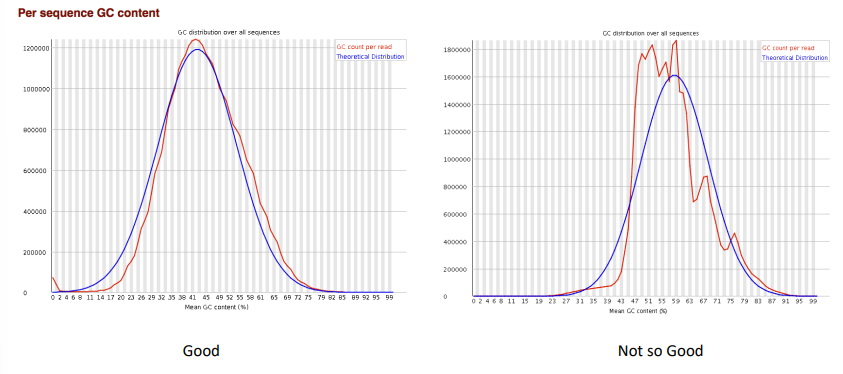
per sequence GC content
duplicate sequences
-some amount of duplication is to be expected in rna seq
-high complexity library: low level of duplication may indicate a high level of coverage of the target sequence
-highly expressed transcripts can be over-sequenced in order to be able to see lowly expressed transcripts
-a badly pcr duplicated library might have levels >90%
Gene annotations
-choice of a gene model has dramatic effect on both gene quantification and differential analysis
-encode
-ensembl
-refseq: oldest db
-ucsc known genes
mapping rna-seq reads
annotated reference is required
-to map junctions the algorithm needs to divide the sequencing reads and map portions independently
-much more complex algorithms are required to identify alternative transcripts
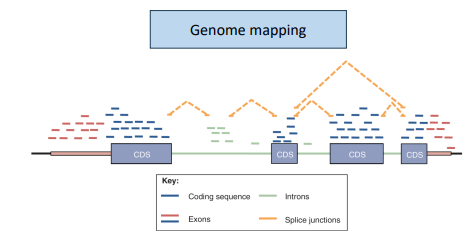
genome mapping
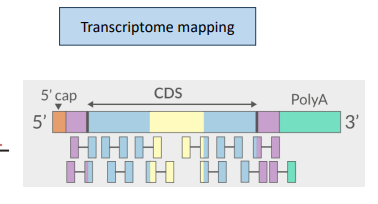
transcriptome mapping
SAM
standard alignment file format generated from all mappers
Sequence Alignment Map format
BAM
binary version of SAM
alignments stored in bam file
indexed to be read by other tools and genome browsers
Alignment QC
-number of reads mapped/unmapped/paired
-uniquely mapped
-insert size distribution
-coverage
-gene body coverage
-biotype counts/chromosome counts
-counts by region (gene/intron/non-genic)
-sequencing saturation
-strand specificity
quantification
read counts = gene expression
quantification at diff levels: exon, transcriptm gene
multi-mapped reads
discard or probabilistic assignment
could have the largest impact on the ultimate results
pcr duplicates
-ignore for rna seq data
-use pcr free library prep kits
-use UMIs during library-prep
normalization
raw read counts cannot be used to compare expression levels among samples
-transcript length
-sequencing depth
-sequencing biases
-difference in rna composition
CPM or RPM
counts per million / reads per million
normalizes only for sequencing depth within-sample
suitable for sequencing protocols that generate reads independent of gene length
FPKM
fragments per kilobase of transcript per million fragments mapped
normalize for feature length and sequencing depth within-sample
RPKM
reads per kilobase per million mapped reads
normalize for feature length and sequencing depth within sample
TPM
transcripts per million
normalize for feature length and sequencing depth within sample
TMM
trimmed mean of M values/edgeR
-accounts for differences in rna composition between samples
-effective in normalization of samples with diverse RNA repertoires
median-of-ratios method
DeSeq2 normalization
-use the median of the ratios of observed counts to pseudo-reference sample as size factor to scale the counts
-normalize sequencing depth
both TMM and median-of-ratios method
-do not consider gene length for normalization as it assumes that the gene length would be constant between the samples
-assume that most of the genes are not differentially expressed
reproducibility
remove lowly expressed genes w <10 reads
-sample-sample clustering heatmap
-PCA
-batch effects
-outlier detection
outliers
true biological differences or technical failures during the process of sample preparation could lead to extreme deviation of a sample from samples of the same treatment group (biological replicates)
fold change
measurement of the changing magnitude (effect size)
typically use log2(FC)
padj
FDR(false discovery rate) adjusted p-value
aka q value
biological interpretation
-gene ontology enrichment analysis
-KEGG oathway analysis
-reactome databases
-gene set enrichment analysis (GSEA)