theme 3 diagrams
1/11
There's no tags or description
Looks like no tags are added yet.
Name | Mastery | Learn | Test | Matching | Spaced | Call with Kai |
|---|
No study sessions yet.
12 Terms
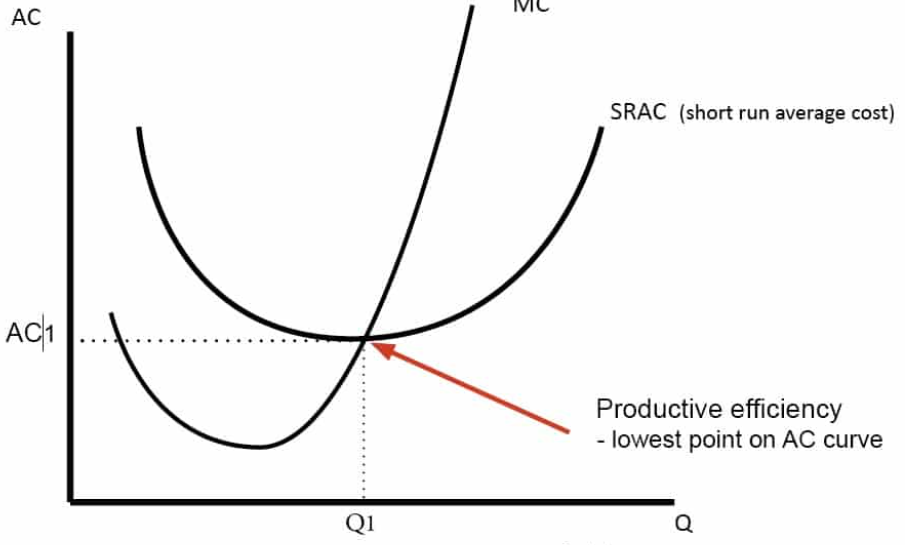
cost curve
draw downward sloping demand curve=AR
marginal revenue curve twice as steep and follow through
draw average cost curve in
marginal cost curve cuts AC at it’s lowest point
cost, rev, price on y, output on x

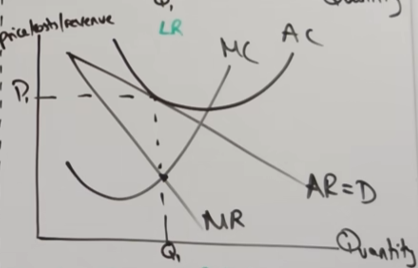
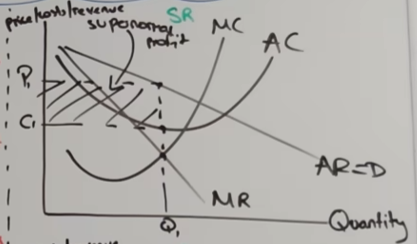
profit maximisation
-point where MC = MR, draw down to x axis
-draw line up to average revenue and across and label as price
-if draw across from AC, forms a box which represents supernormal profits
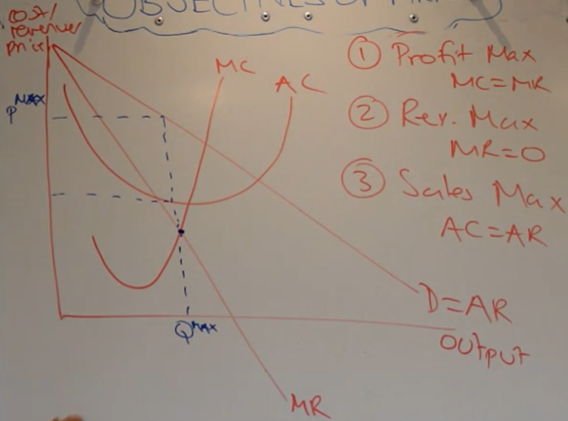
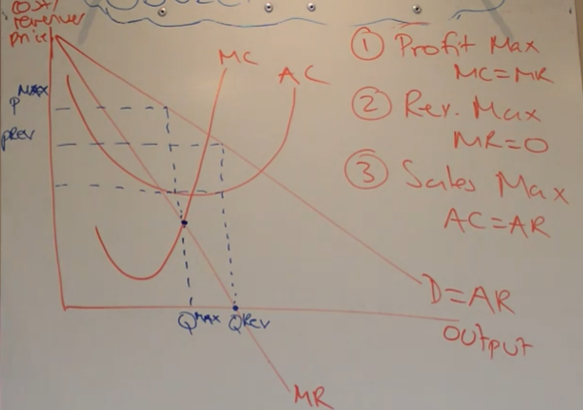
revenue maximisation
-MR = 0
-draw up to AR and across and label price level, shows lower price level than profit maximising
-still making a supernormal profit just less
sales maximisation
-AC = AR
-not really any supernormal profits being made

long run average cost curves
-all factors of prod variable
-increasing these is called scaling, LR is about returns to scale
-1st part is increasing returns to scale
-2nd is constant
-3rd is decreasing
-if experience economies of scale the firm can have increasing returns to scale and vice versa
-the minimum efficient scale is the lowest level of output required to exploit full economies of scale, lowest point where LRAC stops decreasing
-can put in small SRAC curves at points 1,2,3 on with their lowest point on the line (U-shaped AC curves)

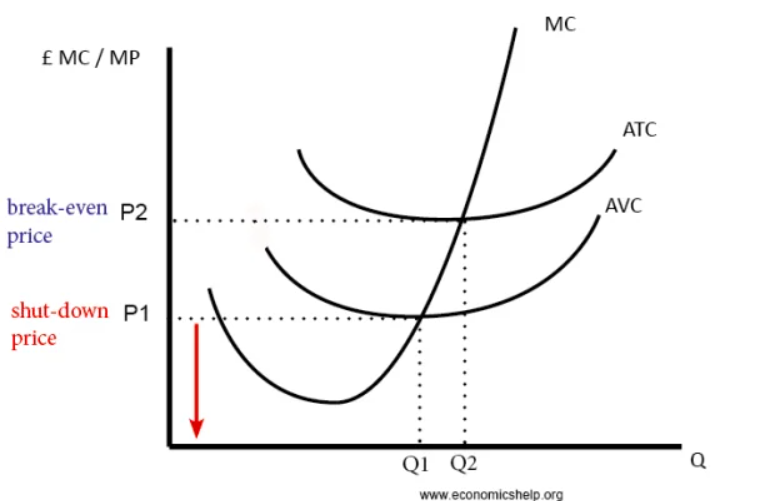
shut down point
productive efficiency
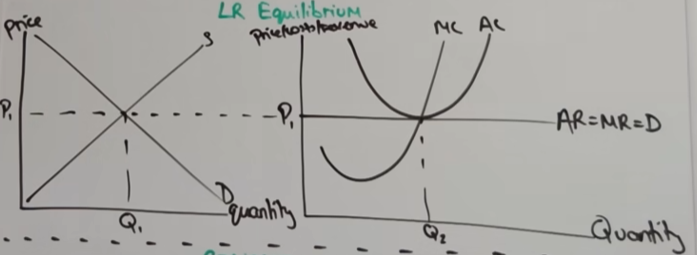
LR equilibrium in perfect comp
-when normal profit is being made
-any profit outside of normal profit is short run
-firm takes market price, makes normal profit with it
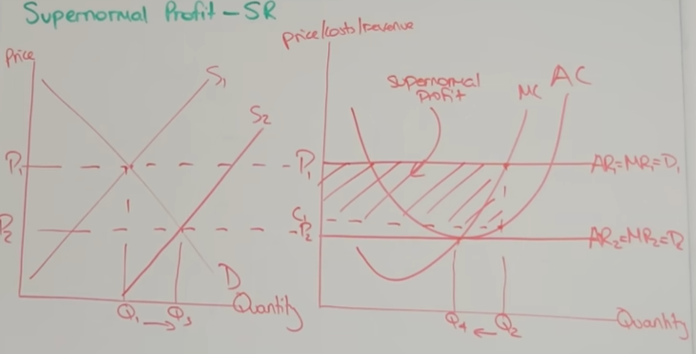
short run supernormal profit in perfect comp
-industry left, firm on the right
-firms take price at p1 from market
-this price is AR, MR and D curve
-supernormal profit will be where AR above AC
-firm is profit max so produce where MC = MR, forms supernormal box
-this profit attracts new firms, shifting supply to the right and price falls until no more supernormal profit
-AR now equal to MC so normal profit (level with new supply shift)
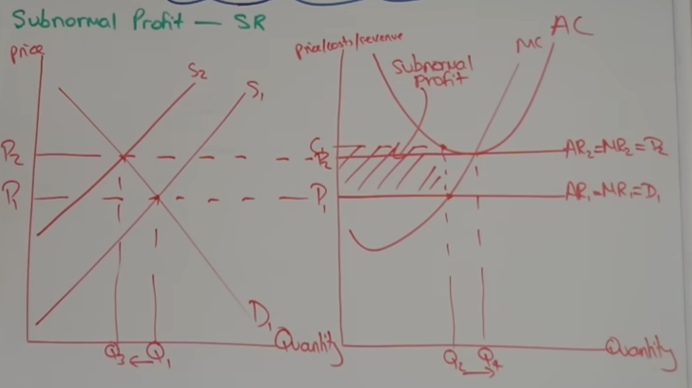
losses/subnormal profit
opposite to supernormal profit, firms leave
d=mr=ar below AC, so costs higher than rev in SR
monopolistic comp in SR
-MR=MC as profit max
-draw up to demand (AR) curve, and across from AC for supernormal profit
monopolistic comp in LR
-new firms attracted by supernormal profit
-due to low barriers and decent info in monopolistic comp
-causes demand for individual firms to shift left until normal profit where AR=AC
-Profit max at MC=MR and up to demand curve
-AC hits this point on demand curve (p1q1)and goes through MC at its lowest point