Methods of masterclass
1/22
There's no tags or description
Looks like no tags are added yet.
Name | Mastery | Learn | Test | Matching | Spaced | Call with Kai |
|---|
No analytics yet
Send a link to your students to track their progress
23 Terms
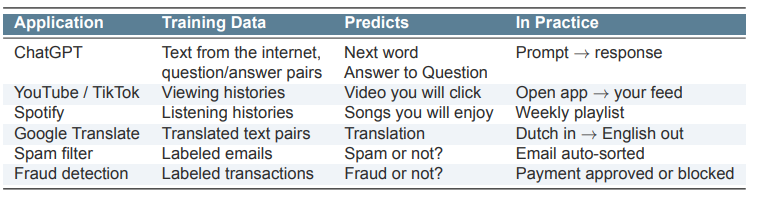
What is machine learning ?
Machine Learning is about prediction: using data to teach algorithms to predict outcomes they have never seen.
We give the computer data and outcomes
The algorithm finds patterns by itself
It uses these patterns to make predictions on new data.
2 phases of machine learning
First: Learn from data
Then: Predict outcomes for new inputs
What is the difference between Statistics and Machine Learning?
Doel
Statistics: begrijpen hoe dingen samenhangen
Machine Learning: zo goed mogelijk voorspellen
Vraag
Statistics: wat is het verband tussen X en Y?
Machine Learning: als ik X weet, wat is dan Y?
Hoe je het beoordeelt
Statistics: kijk naar dingen zoals coëfficiënten en p-waarden
Machine Learning: kijk hoe goed het model voorspelt (fout/accuracy)
Aanpak
Statistics: werkt met modellen en aannames (bijv. lineair verband)
Machine Learning: leert zelf patronen uit data
Stijl
Statistics: duidelijk en goed uitlegbaar, maar minder flexibel
Machine Learning: flexibel en krachtig, maar vaak moeilijker te begrijpen
👉 Kort samengevat:
Statistics = uitleggen waarom iets gebeurt
Machine Learning = voorspellen wat er gaat gebeuren
What are the main types of Machine Learning?
Type | Description | Example |
|---|---|---|
Supervised Learning | The model learns from labeled data (data + outcomes). | Classification, Regression |
Unsupervised Learning | The model learns from unlabeled data and finds hidden patterns. | Clustering |
Classification: predict a category
Regression: predict a number
Clustering: group similar data together
What are features, targets, and training in Machine Learning?
Term | Meaning | Examples |
|---|---|---|
Feature (X) | Independent variable used to make a prediction | Firm size, word counts, pixel values |
Target / Label (Y) | Dependent variable the model tries to predict | Management quality, AI vs human, fraud or not |
Training | The process of estimating a model by minimizing a loss function | e.g. minimize sum of squared errors |
What is the difference between Inference and Prediction?
Doel
Inference: begrijpen of X invloed heeft op Y
Prediction: Y zo goed mogelijk voorspellen
Focus
Inference: kijken wat elke variabele precies doet
Prediction: zo klein mogelijke fout maken
Belangrijk
Inference: let op problemen zoals verborgen factoren en oorzaak-gevolg
Prediction: oorzaak maakt niet uit, zolang de voorspelling goed is
Methodes
Inference: meer “strakke” modellen (zoals fixed effects)
Prediction: flexibele modellen (mogen complex en niet-lineair zijn)
Voorbeeldvraag
Inference: zorgt een grotere firma voor beter management?
Prediction: hoe goed kunnen we managementkwaliteit voorspellen?
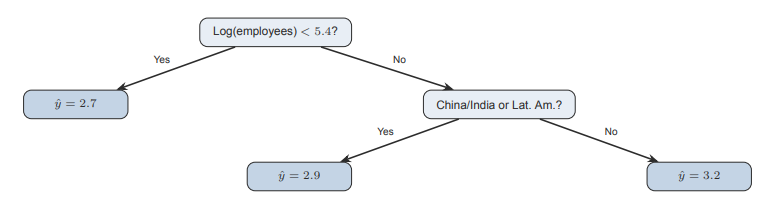
What is a Regression Tree?
Een regressieboom is een soort beslisboom die een getal probeert te voorspellen.
Hij stelt stap voor stap simpele ja/nee-vragen
Met elke vraag wordt de groep data opgesplitst in kleinere groepen
De groepen worden zo gemaakt dat de waarden binnen elke groep zo veel mogelijk op elkaar lijken
Aan het einde (bij de “blaadjes” van de boom) krijg je een voorspelling:
→ dat is gewoon het gemiddelde van die groep
Why do we start learning Machine Learning with Regression Trees?
Makkelijk te begrijpen en te visualiseren
→ Je kunt het zien als een boom met simpele stappenWerkt als een algoritme
→ De computer zoekt zelf de beste splits (in plaats van formules te schatten zoals bij regressie)Laat belangrijke ML-ideeën zien:
Flexibiliteit → kan verschillende patronen leren
Overfitting → kan té goed op de trainingsdata passen
Cross-validation → helpt om te checken of het model ook goed werkt op nieuwe data
What is the anatomy of a Regression Tree?
Node: a yes/no question that splits the data
Leaf: the final point where the tree makes a prediction (average outcome)
The tree automatically finds the best splits. No need to specify the functional form
How does a Regression Tree work?
Bij elke stap probeert de boom veel verschillende splits (bijv. leeftijd < 30?)
Hij kiest de split waarbij de groepen zo veel mogelijk op elkaar lijken
Hij blijft splitsen totdat hij moet stoppen (bijv. groepen worden te klein)
Voordelen
Werkt automatisch met niet-lineaire verbanden (dus geen rechte lijn nodig)
Je hoeft interacties niet zelf te bedenken
Makkelijk te begrijpen en uit te leggen (je kunt het als een boom tekenen)
What is the difference between a Regression Line and a Regression Tree?
Method | How it works |
|---|---|
Linear Regression | Fits one straight line through all the data |
Regression Tree | Splits the data into groups and predicts the average outcome in each group |
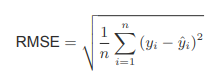
How Good Are Our Predictions?(RMSE (Root Mean Squared Error)
RMSE measures the average prediction error of a model
It compares the actual value (y) with the predicted value (ŷ)
The error is squared, averaged, and then square-rooted
The result is in the same units as the outcome (y)
Key idea:
Lower RMSE = better predictions
What is a baseline model in prediction?
The baseline always predicts the average outcome (ȳ)
It ignores all variables
If your model cannot beat the baseline, it is useless
Always compare models to the baseline as a sanity check
What happens when a Regression Tree becomes more complex (more splits/leaves)?
More splits/leaves → the tree captures more detailed patterns in the data
This increases model complexity
On the training data, RMSE usually keeps decreasing
Problem:
A very complex tree may fit noise instead of real patterns
This is called overfitting
Key idea:
Better performance on training data does not always mean better predictions on new data.
What is the difference between a training set and a test set?
Dataset | Purpose |
|---|---|
Training set (~70%) | Used to train/estimate the model |
Test set (~30%) | Not used during training; used to evaluate prediction performance |
What does a validation curve show?
As model complexity increases, training RMSE keeps decreasing
Test RMSE first decreases, then increases
When test error increases, the model is overfitting (memorizing noise)
Key idea:
The best model is at the “sweet spot” where test RMSE is lowest, meaning it generalizes best to new data.
What is overfitting?
Overfitting happens when a model learns the training data too well, including noise
As a result, it performs worse on new (test) data
Key lessons:
Training error ≠ true performance
Always evaluate models on test data the model has never seen
More complex models are not always better 📊
How do we turn text into numbers for a machine learning model?
Split text into words and remove common words (e.g., “the”, “is”, “and”)
Select informative words that appear differently in AI vs. human texts
Create binary indicators:
1 = word appears in the text
0 = word does not appear
Example:
Select 100 words → 50 AI-signaling + 50 human-signaling.
What is the difference between a Regression Tree and a Classification Tree?
Aspect | Regression Tree | Classification Tree |
|---|---|---|
Prediction | Predicts a number | Predicts a class/category (majority class) |
Split criterion | Minimizes prediction error (RMSE) | Makes groups as pure as possible |
When do we use a logit (logistic regression) model?
When the outcome is binary (0 or 1)
The model predicts the probability that Y = 1
Uses an S-shaped curve so predictions stay between 0 and 1
Often classify as 1 if P > 0.5 📊
What changes when moving from a Regression Tree to a Classification Tree?
Prediction: each leaf predicts a class (majority class) instead of a number
Split criterion: splits aim to make groups as pure as possible (observations mostly in the same class)
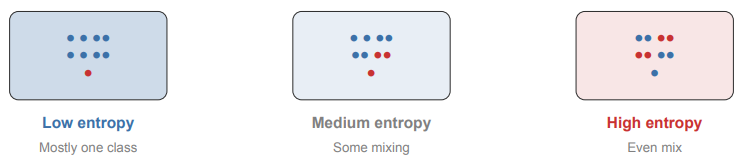
What is entropy in a classification tree?
Entropy measures how mixed a group is
Low entropy: mostly one class (pure group)
High entropy: classes are evenly mixed
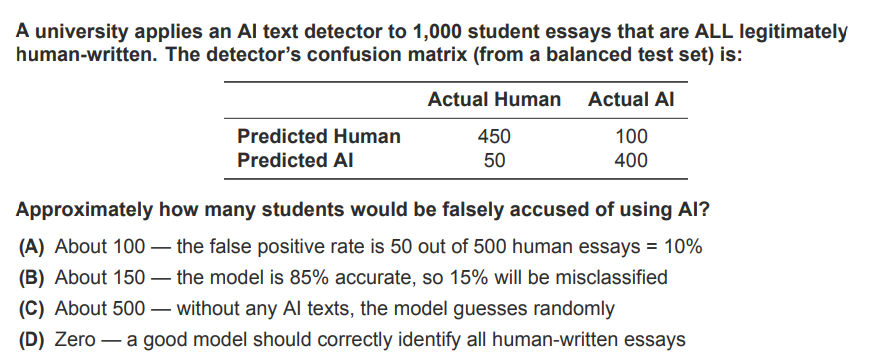
Answer: (A) The FPR (50/500 = 10%) tells us what fraction of truly human texts get flagged. Overall accuracy (85%) is misleading here because it was measured on balanced data.