multivariate stats final | Quizlet
1/77
There's no tags or description
Looks like no tags are added yet.
Name | Mastery | Learn | Test | Matching | Spaced | Call with Kai |
|---|
No analytics yet
Send a link to your students to track their progress
78 Terms
research Qs about relationships
correlation
SLR
MLR
research Qs about differences between groups
independent samples t test
paired samples t test
between subject design
when participants are divided into different groups and each group receievs a diff treatment
AKA indepedent groups design --> the data is compared between the groups
RQs about differences between 2 independent groups
independent samples t test
RQs about differences between more than 2 independent groups
ANOVA = analysis of variance
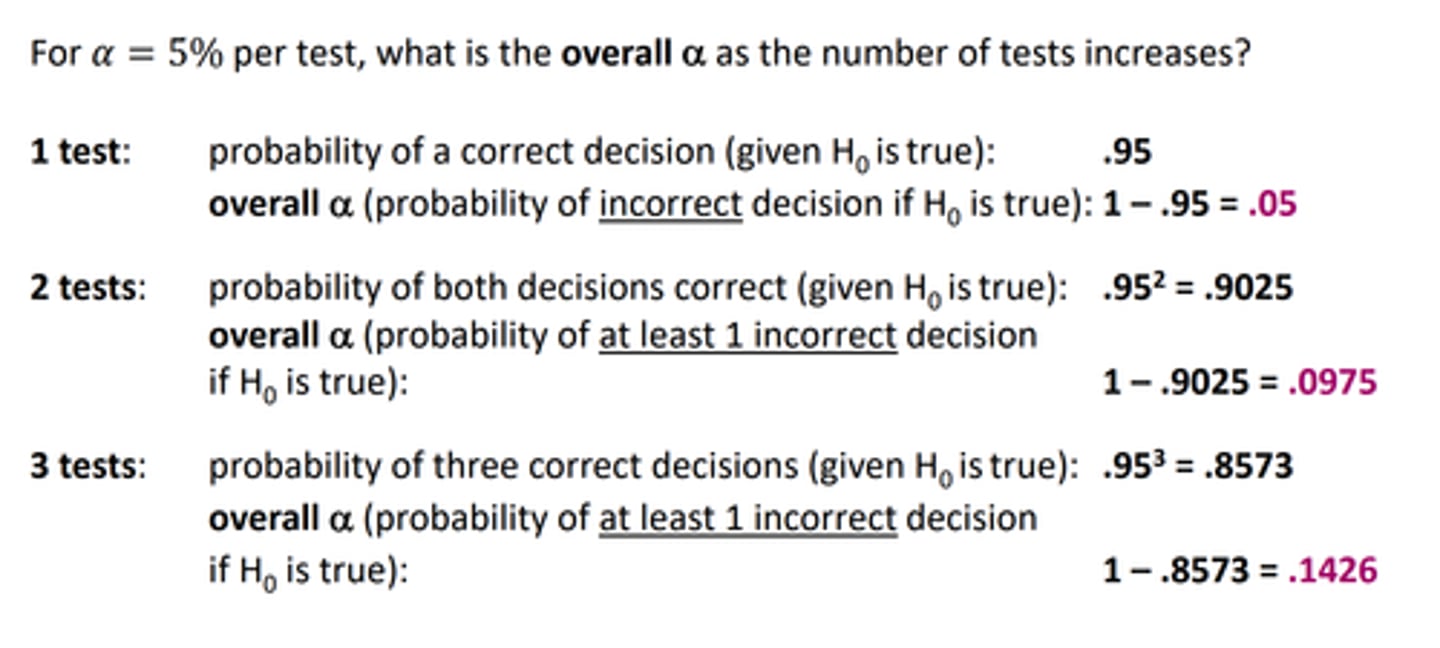
as cannot conduct multiple t tests due to type 1 error inflation
ANOVA
compares 3 or more groups
DV is interval/ratio, and IV is nominal (group AKA factor)
hypotheses for ANOVA
if k = 3
H0: mu 1 = mu 2 = mu 3
-- there is no difference between the 3 groups
HA: not all mu i are equal
-- there is at least one difference
note --> they dont all have to be diff (so not a not equals sign)
why called ANOVA
the analysis compares the between group variation (the variance explained by the group) to the within group variation (unexplained/residual variance)
normal t test formula
t = observed diff in means / expected diff in means (SE)
test statistic ANOVA
F = observed variance in means / expected variance in means
observed variance
variance between the group means
= variance explained by the differences between the groups
= model variance
= between group variance
difference between the group mean and the grand mean
expected variance
variance within the groups
= variance not explained by the differences between the groups
= residual variance
= within group variance
difference between the points and the group mean
how is variance measured
by a mean square so
F = model mean square / residual mean square
F = MSm / MSr
ANOVA assumptions
1. random sample
2. independent observations
3. DV is interval or ratio
4. DV is normally distributed in each group
5. homogeneity of variances (equality of within-group variances)
random sample
check in the methods --> random sample from population
independent observations
randomly assigned a group --> between subject design
DV is interval/ratio
check methods, what scale is being used to measure DV
DV normally distributed within each group
check raincloud plot in JASP
also there should not be any outliers (obviously outside boxplot bounds)
check Q-Q plots of residuals (for each group), should be normally distributed, will look funny along a line vibe
homogeneity of variances
1. create side by side box plots, check if IQR is roughly same in each group
2. check levene's test in output (if NOT significnat, assume homogeneity) USE ALPHA = .01
problems with levenes test
if sample sizes differ a lot between the groups
if samples are all small --> won't indicate problems if in reality variances are different
if samples are all large --> may indicate problems when there arent any
levenes test alternative -- samples are all small
rely on boxplot method
levenes test alternative -- samples not small, and test is significant
1. check if the largest sample is less than 4x the size of the smallest sample
2. check if the largest variance is less than 10x the size of the smallest variance
IF BOTH ARE SATISFIED
--> continue with ANOVA, regardless of significant levenes test
IF NOT BOTH SATISFIED
--> use alternative corrections such as Welch or Brown-Forsythe
(how can we check variance and sample size--> descriptive stats for each group and make sure to square SD to get variance)
steps in ANOVA testing
1. check assumptions (HoV, normality)
2. check significance of the factor (F test, p value)
3. determine effect size for significant factors
4. check post-hoc tests for significant factors with >2 levels
5. report significant results and state conclusions
ANOVA effect size
eta squared = SSm / (SSm + SSr)
tells you about the relevance of the group factor on the DV
interpretation of effect size
.01 small
.09 medium
.25 large
why to do post-hoc testing
we know there is a difference between groups, but we dont know which groups are significantly different, so have to perform these tests
if the F test p value was not significant -- do not bother to perform post hoc tests
what is post hoc testing
AKA pairwise comparisons
they are t tests, but with adjusted p values given that there is multiple testing
type 1 error
probability of rejecting the null hypothesis when it is true (false positive)
type 2 error
probability of accepting the null hypothesis when you shiuld have rejected it (false negative)
what is the problem with multiple testing
type 1 error inflation
which leads to capitalisation on chance
post-hoc corrections
bonferroni
Tukeys HSD
LSD
bonferroni correction
if the number of groups is small
tukeys HSD
if the number of groups is larger
LSD
least significant difference
no correction --> two groups only
problem with post hoc corrections
controlling for type one error through the post hoc corrections REDUCES POWER
summary post hoc tests
pairwise comparisons between the groups (all combos)
correctiosn for multiple testing
allows you to find significant differences between specific groups
reduces the overall power
contrasts
can be used to test specific hypotheses regarding group differences
less comparisons and so often does not need corrections for multiple testing --> so more power than post hoc tests
different types of contrasts possible depending on the RQ
bayesian testing
given the observed data, what is the chance the alternative hypothesis is true?
bayes factor
how much more does the data support the null hypothesis as compared to the alternative hypothesis?
Bayesian ANOVA
RQ the same
hypotheses the same
just interpret the BF rather than p value
bayesian posthoc testing
can see the BF for each comparison in a variable, U means uncorrected
posterior odds, also tells us the chance of H0 and HA being equal, if odds >1 then is the chance of HA being larger than H0
factorial ANOVA
an analysis of variance involving two or more independent variables or predictors
eg 2 factors:
factor A with a levels
factor B with b levels
total number of groups = a*b
called an a*b ANOVA, eg 3x2 ANOVA
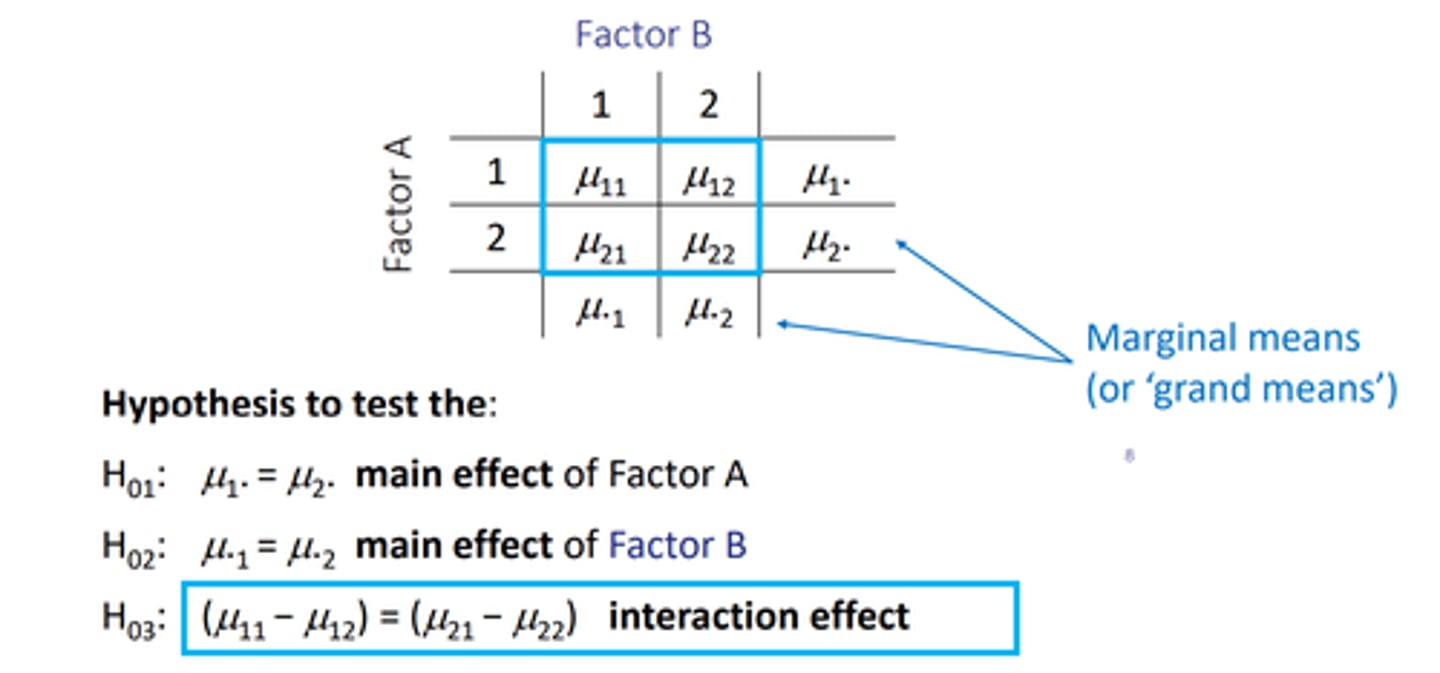
factorial ANOVA means
write in a table with Mu ab, and the . takes the spot of the the one thats not the main effect.
eg Mu.1 and Mu.2 are the main effect of factor B as A has been replaced by the .
these are the grand means/marginal means --> the null hypothesis being that they are equal
factorial ANOVA hypotheses
3 null hypotheses:
H0(1): Mu1. = Mu2.
-- tests main effect of factor A
are the means equal for all levels of A?
H0(2): Mu.1 = Mu.2
-- tests the main effect of factor B
are the means equal for all levels of B?
H0(3): (Mu11 - Mu12) = (Mu21 - Mu22)
-- tests the interaction effect between the 2 factors
is the effect of A the same for all levels of B?
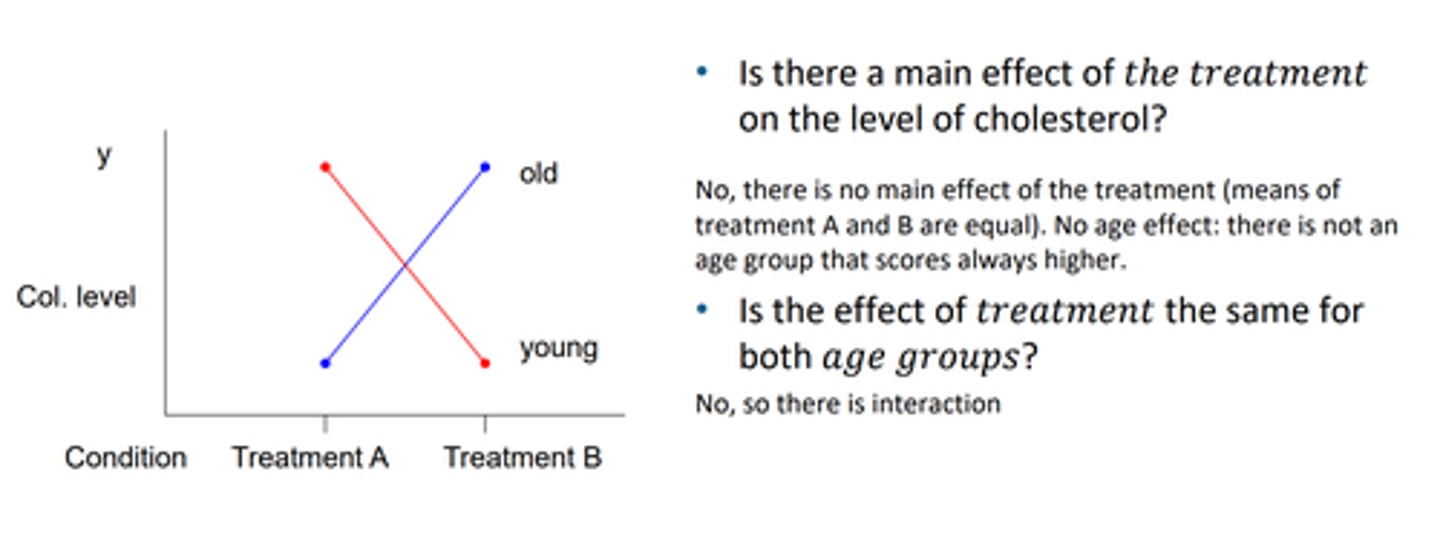
check interaction effects examples
also parallel lines mean no interaction, deosnt change the behaviour of the treatment depending on the group for example
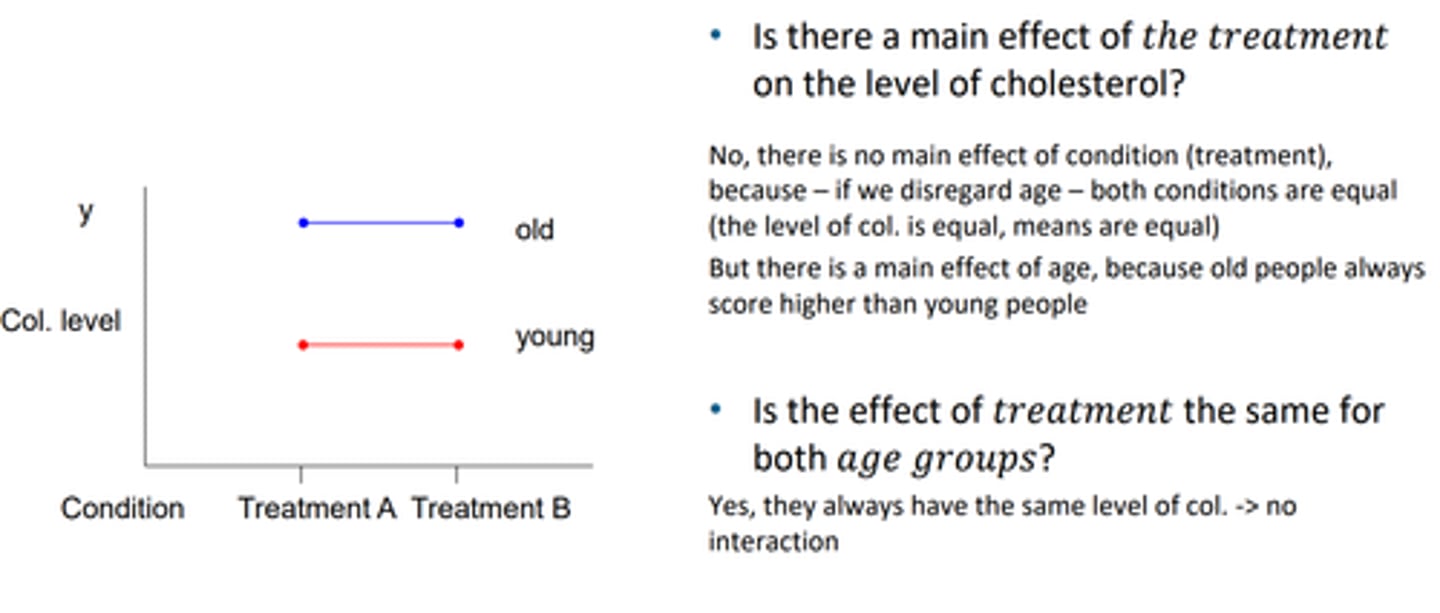
main effects crossing out
when they are different, not always a group that scores higher, nor always a treatment that is higher, regardless of age, sothus there is no main effect and there is an interaction effect
RQs for factorial ANOVA
you get 3 RQs for a 2x2 ANOVA:
1. is DV the same across the k groups in factor 1?
-- main effect factor 1
2. is DV the same across the k groups in factor 2?
-- main effect factor 2
3. are the differences between factor 2 groups the same for the groups of factor 1?
-- interaction effect
steps in a factorial ANOVA
1. check assumptions
2. check significance of main effects and interaction effect (with the F test and p value)
3. if interaction is significant, make an interaction plot. if not, rerun the model with only the main effects
4. determine effect sizes of the significant effects
5. check post-hoc comparisons for significant factors with more than 2 levels
6. report results
assumption checks
same as normal ANOVA, check Levene's test etc
main and interaction effects
in ANOVA of DV table
will contian the 2 factors, and the interaction factor, and the residual
check also significance of main effects
if interaction term not significant take it out!
make a profile plot
on JASP this is the same as interaction plot
estimated means for model with interaction
can look at roughly how parallel it is and whether confidence intervals overlap
effect size of main effects
partial eta squared, same as for normal ANOVA
post hoc testing for factorial anova
found out significant main effects exist (meaning at least one significnat difference), so then for which factors/groups differ signficanlt from one another?
1. pairwaise corrections:
do the same in ANOVA, bonferroni correction
2. simple main effects
another type of post hoc test
simple main effects
test for differences of groups of one factor WITHIN the groups of another factor
in descriptives you can see the means for the factors with each other, and then in simple main effects tab can see if within the groups name they differ significnatly
bayesian factorial ANOVA
always compare to null model
basically the same
all other models are listed in order of support --- no way??
comparing models to each other in bayesian analysis
pick one as a null model (with less terms) and click it on JASP
then include the interaction term in the other one
can see how much more/less support in the data there is fro the one with the interaction effect, and then pick the better one
ANCOVA
analysis of covariance
tests 2 or more groups again, while the DV depends on an interval or ratio IV
(normally DV depends on 1 or 2 nominal IV's, but ANCOVA is when an IV is interval/ratio)
compares levels of a factor while controlling for a covariate
you end up with a normal regression line analysis but for multiple groups --> n=because its a covariate w groups
why do we introduce a covariate in ANCOVA
1. to correct for differences between factor levels on the covariate
2. to increase the power to detect differences between groups
modelling for both a factor and a covariate
can be written as a multiple linear regression, with the covaraite as normal and then the factor coded as a dummy
ANCOVA compared to ANOVA
when you add a covariate to the model it should reduce the difference in means (if it adds to the model)
assumptions of ANCOVA
1. homogeneity of variances
2. homogeneity of regression slopes
-- means regression lines are parallel and there is NO INTERACTION between factor and covariate
how to check homogeneity of regression slopes
fit the model with the interaction and check that it is not significant
as if int term is significant then is a problemo
marginal means
means adjusted for a covariate --> compare to the orignial means in the descriptives
steps in ANCOVA
1. check homogeneity of regression lines 9run model w interaction), then if satisfied (interaction is not significant) proceed with:
BUT TAKE OUT THE REGRESSION TERM
2. check homogeneity of variances (levenes test)
3. check signifcance and effect size of factor and covariates (ONLY REPORT SIGNIF ONES)
4. check post-hoc tests for factors with more than 2 levels (FOR SIGNIF ONES)
5. check direction of effect of covariate (in parameter estimates) (CHECK COEFFICENTS TABLE, COEFFICENT FOR THE COVARIATE, THINK OF AS 1 UNIT PLUS COVARIATE, 1 UNIT CHANGE IN DV)
6. report results
homogeneity of regression lines
run scatter plot (can roughly see)
run model w interaction term, check not significant, and thus assume they are parallel
factorial ANCOVA
adding a covariate to a factorial ANOVA (with multiple factors)
assess normal effects and add "while controlling for covariate"
and then add the main effect of the covariate to analyse --> if this is not significant then dont need to be added to the model
then there is to include multiple interaction effects with all of the factors
-- to check for homogeniety --> if the interaction effects woith the covariate are all not significant then is satisfied!
bayesian ANCOVA
all the same steps, check signiifcance of the interact
ANOVA for repeated measures
within subject measurements of the same DV
measurements between time points are dependent --> so we do analysis of the difference scores
can be any number of IV's
within subjects design
repeated measures
the same group of individuals participates in all treatment conditions
same DV measured at different time points ( changes over time)
or same DV measured under different conditions (to study differences between conditions)
counterbalancing
to avoid a learning effect, different orders of treatment may be used
advantages of RM over between subject design
more power to detect effects
more economical (fewer participants needed)
study develops over time
frequentist RM ANOVA
for example 4 measurements of anxiety over different times
RQ: do the anxiety scores change over time?
anxiety = DV
time = IV
dependent observations
Hypotheses of RM ANOVA
H0: Mu anx1 = Mu anx2 = Mu anx3 = Mu anx4
HA: that they are not the same / improve (readthe Q)
assumptions RM ANOVA
1. random sample
2. DV is normally distributed in each group in the population
3. sphericity
sphericity
a variation on the equal variance assumption, instead of assuming equal variance, we assume the dependence between measurement moments is equal. so we assume equal variance of difference scores
differences between each pair of values
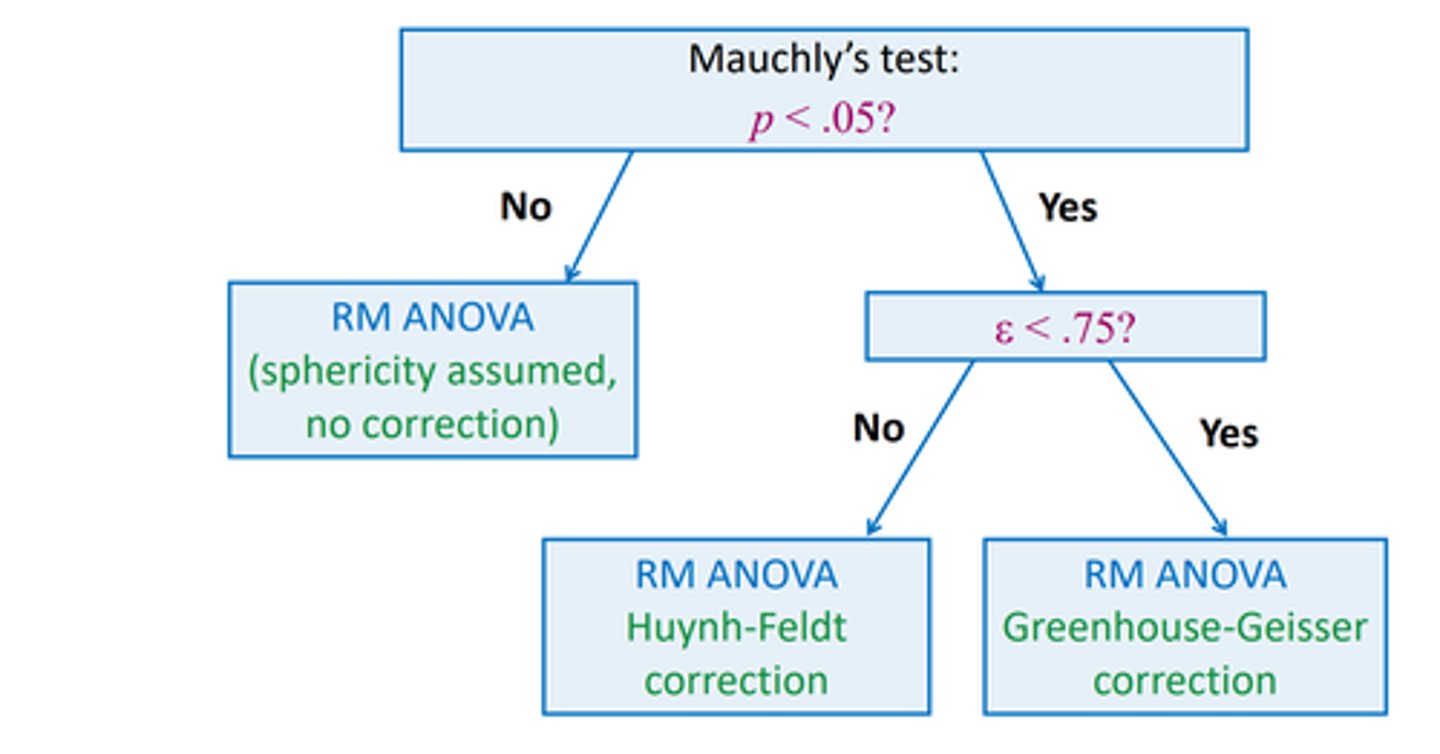
how to check sphericity
mauchly's test with alpha = .05
you want it to NOT be significant to satisfy the assumption (same as sphericity)
effect size for RM ANOVA
eta squared (partial)
correction for sphericity
if mauvhlys test is significant --> then use GG or HF correction, GG if epsilon <.75