Lecture 1 : the main empirical tools
1/12
There's no tags or description
Looks like no tags are added yet.
Name | Mastery | Learn | Test | Matching | Spaced | Call with Kai |
|---|
No analytics yet
Send a link to your students to track their progress
13 Terms
what types of data exist
cross sectional data
time series
panel data
cross sectional data
covers a cross section of observations (eg individuals, firms ext)
information is collected from this cross section for a given time
→ rows are units of observations and columns are variables
time series data
data indexed by time only
panel data
repeated observation of the same unit
the same unit is followed over time
→ the survey takes information about individuals
→ time-invariant information (eg race)
→ time varying information (eg employed last week)
Regression Discontinuity design RD
the treatment assignment rule : we know the rules for the treatment affected by cutoff’s
arounf the discontinuity :
for observations very close to the discontinuity we effectiverly have an experiment
we have a control group and a treatment group, assigned as good as random
Regression Discontinuity design RD : two types
Sharp RD
and Fuzzy RD
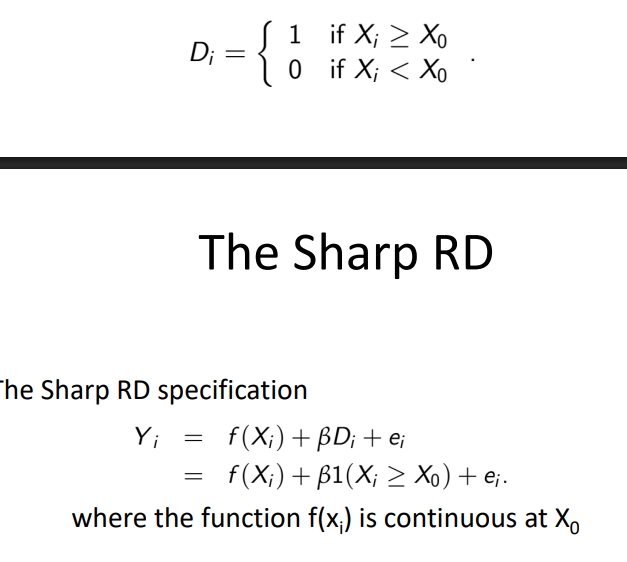
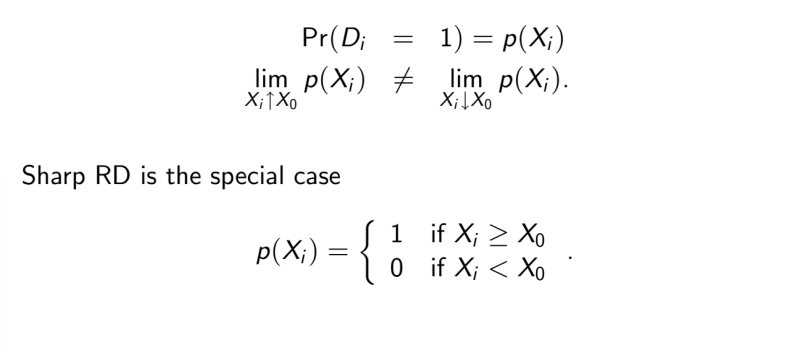
Sharp RD
is used when treatment status is a deterministic and discontinuous function of a covariate Xi, = running variable
Fuzzy RD
instead of a deterministic assignment rule there may only be a change in the probability of treatment at the cutoff
RD : identification assumptions
1) the running variable is not fully manipulable around the threshold
randomness around the cutoff
2) all observable covariates and unobsservables that might be correlated with our outcome variables should show continuity across the RD threshold
Instrumental variable : what makes a valid instrument
a variable Zi is a valid instrument for the endogenous regressor Xi if it satisfied the conditions
relevance : corr (Zi, Xi) ≠ 0
Exogeneity : corr (Zi, ei) = 0, so that Zi is as good as random, and Z only affects the outcome Y through affecting X
The Instrumental Variable (IV) estimation
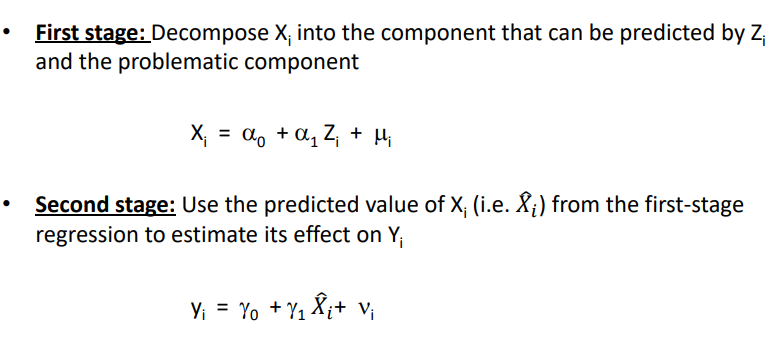
most common estimation method : two stage least squares 2SLS
1) decompose Xi into the component that can e predicted by Zi and the problematic component
2) use the predicted value of Xi form the first stage regression to estimate its effect on Yi
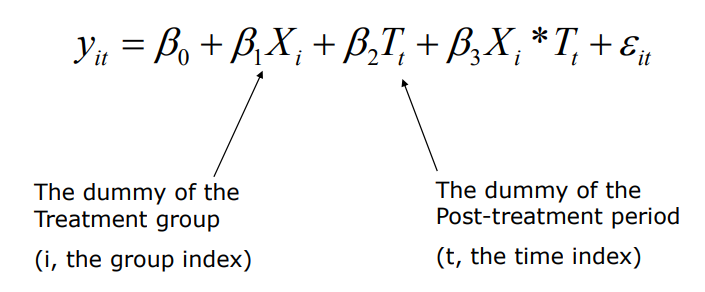
Difference in difference DID
two dimensions
group dimension : two groups (control and treatment)
time dimension : two periods (pre and post treatment period)
→ came from john snow’s investigoation about water
Difference in difference DID validity depends on
the parallel trend assumption : trends would have been the same between the control and the treatment groups, in absence of the treatment
how can we have have some confidence in this assumption ?
given both groups are iwthout treatment during the pre-period, the DID estimate shoud be 0