Economics Chapter 5: Product Market Supply
1/47
There's no tags or description
Looks like no tags are added yet.
Name | Mastery | Learn | Test | Matching | Spaced | Call with Kai |
|---|
No analytics yet
Send a link to your students to track their progress
48 Terms
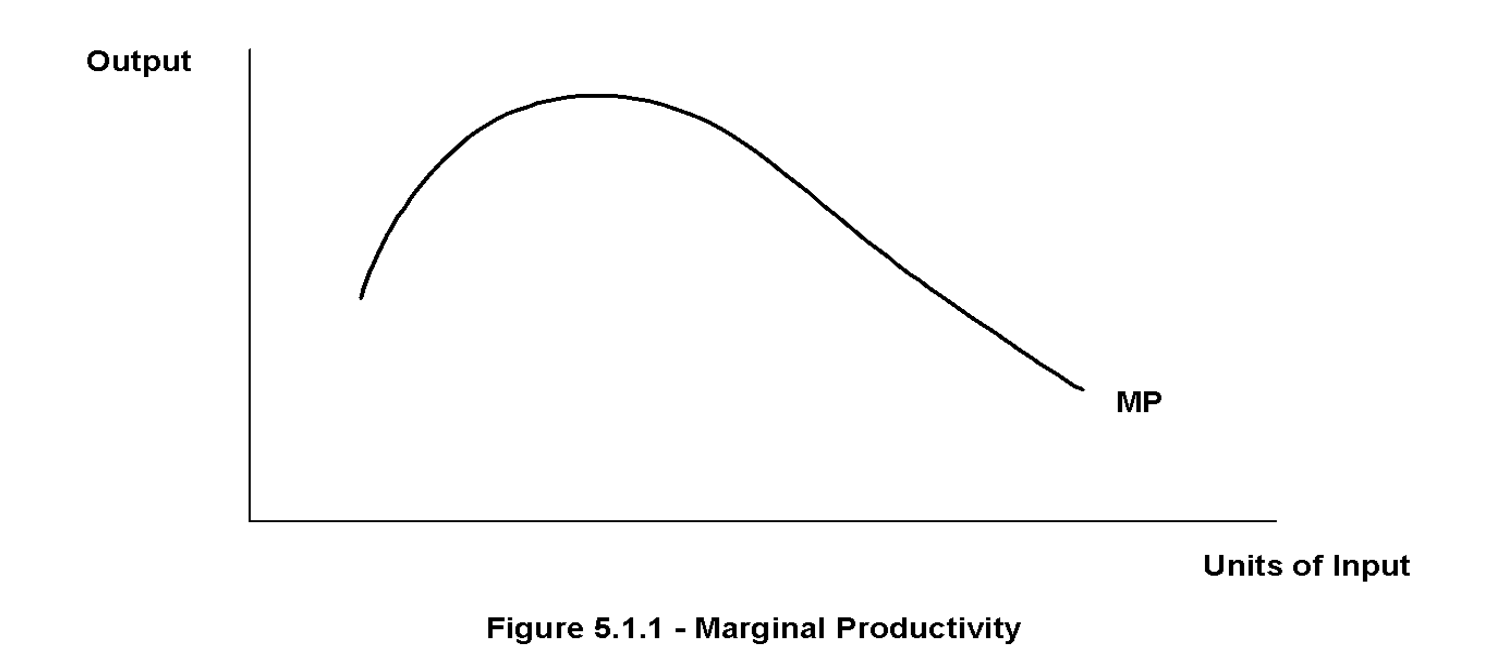
Diminishing marginal productivity
Holding all other factors constant, as you increase one input, you eventually get less output from each successive unit
Example of diminishing marginal productivity
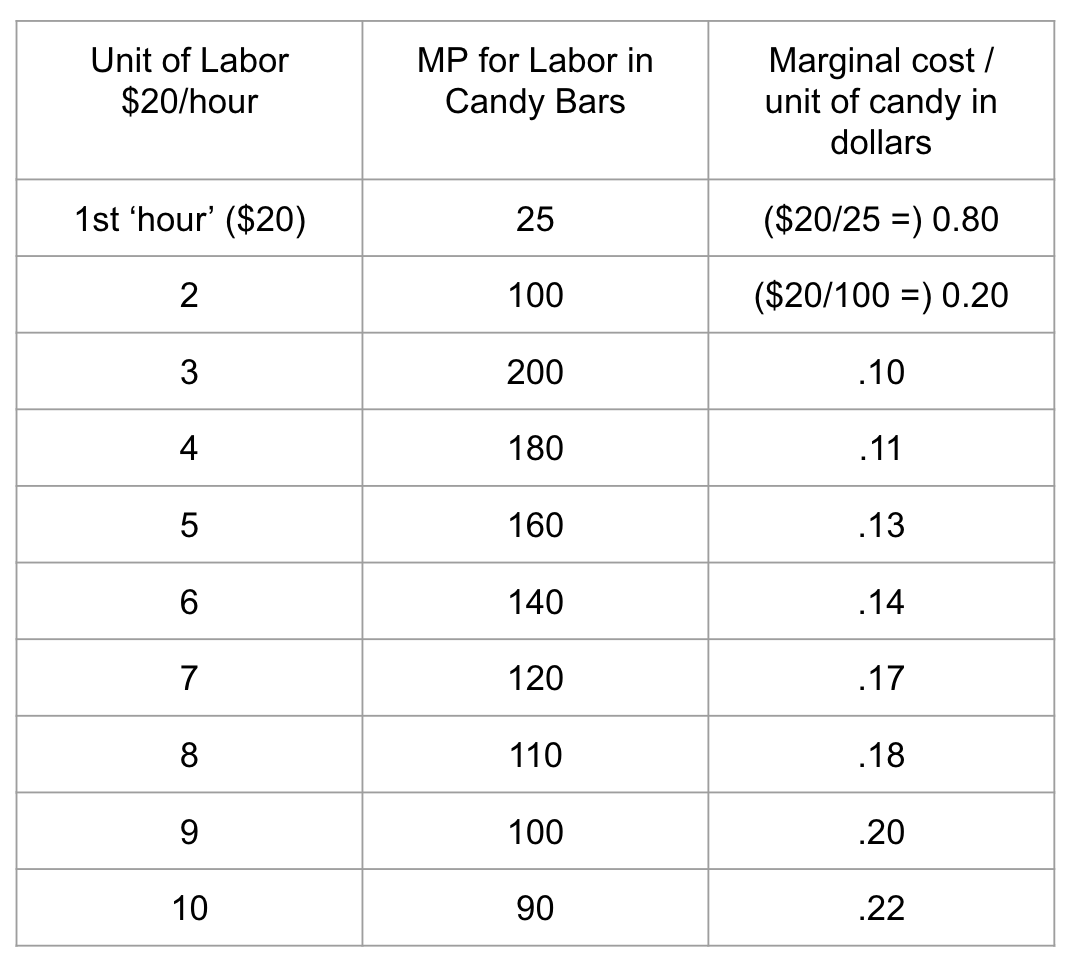
1 person can make 25 candy bars in the 1st hour, they make 100 in the second hour [125 (100+25)]. they make 200 in the 3rd hour (=325 total), etc
![<p>1 person can make 25 candy bars in the 1st hour, they make 100 in the second hour [125 (100+25)]. they make 200 in the 3rd hour (=325 total), etc</p>](https://knowt-user-attachments.s3.amazonaws.com/232e3348-c960-4d53-9a8f-a02698d164fb.png)
Assume a unit of labor cost $20 (calculating marginal cost)
The 200 candy bars produced in the third hour cost 0.10 each to make. (My most efficient hour). The 90 candy bars in the 10th hour, cost 0.22 each to make. Similar to studying. You start slow, get on a roll, then get tired as the night wears on. Late that evening, you aren’t learning as much, and the time is ‘costing you’ more ‘expensive’ sleep. *
Since we pay a constant price for the input, and since output rises then falls, the marginal cost of the output will
fall then rise
When workers are most productive (and efficient), the stuff costs
less per unit
When workers get less productive, the marginal cost
begins to rise
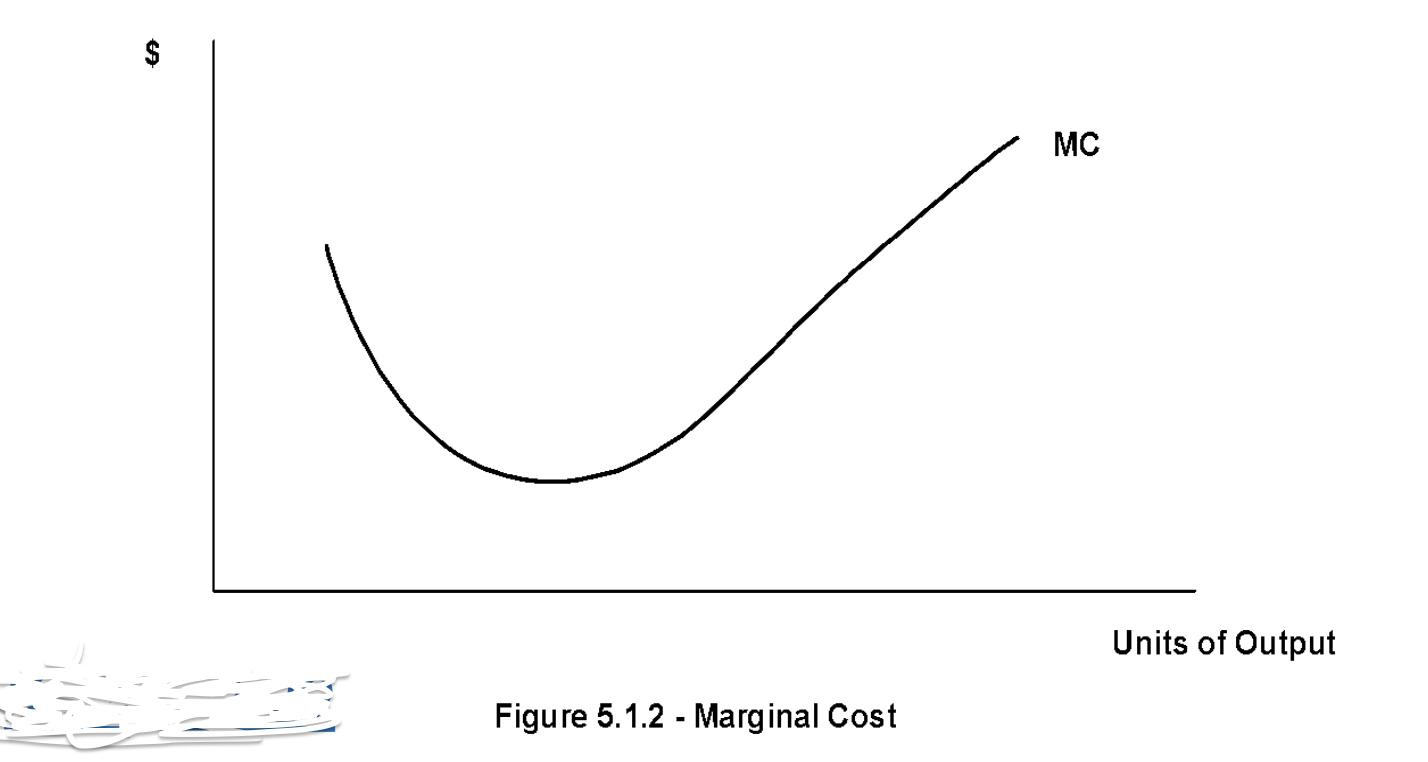
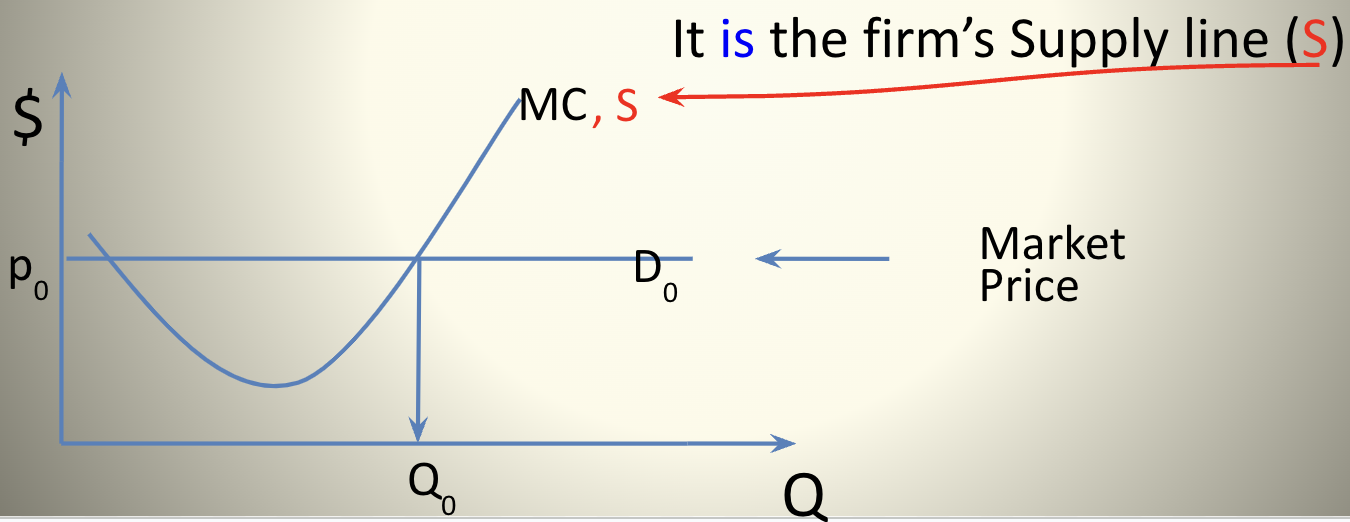
The upward sloping segment of the MC curve is the firm’s
supply line
How far do we expand production as MC keeps rising?
The firm gets the market signal - the price
What does the price say?
It says “we’re willing to pay this much, how many will you produce?”
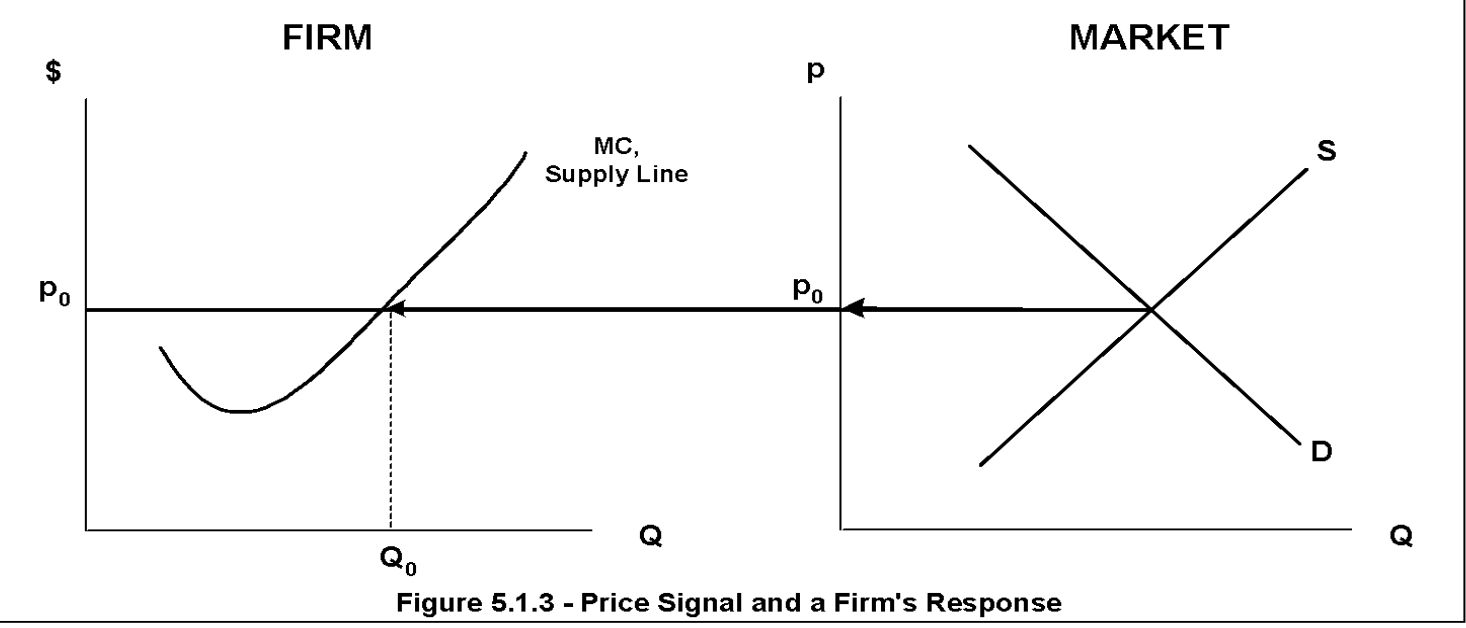
The firm will want to produce
where the price crosses MC
The Firm in the Market
The firm will supply Q at p = MC, not more, not less. Why not? As p changes, MC traces the firm’s Qˢ’s
The firm looks at what?
Market price and marginal cost curve. They can produce up to that point and still cover costs, but to produce more means that rising costs don’t make it worthwhile
If market price adjusts upward, then the firm will
produce more
Firms consider
all costs
Normal return
the amount that covers the opportunity cost of working for someone else and being in business - just enough to stay in business, including paying yourself, pride of ownership etc.
Example of normal return
People who run their own businesses have many skills. They could easily work for someone else. The normal return might be in cash, pride of ownership, satisfaction, or any combination, but it must exceed the opportunity cost of working for another. Minimum level of ‘money’ needed for a company to remain competitive in the market
Normal returns are
an essential part of any firm’s costs
Normal costs are built
into the marginal cost curve
A firm’s cost structure is based upon
The prices of inputs into production, levels of technology, and the enviroment
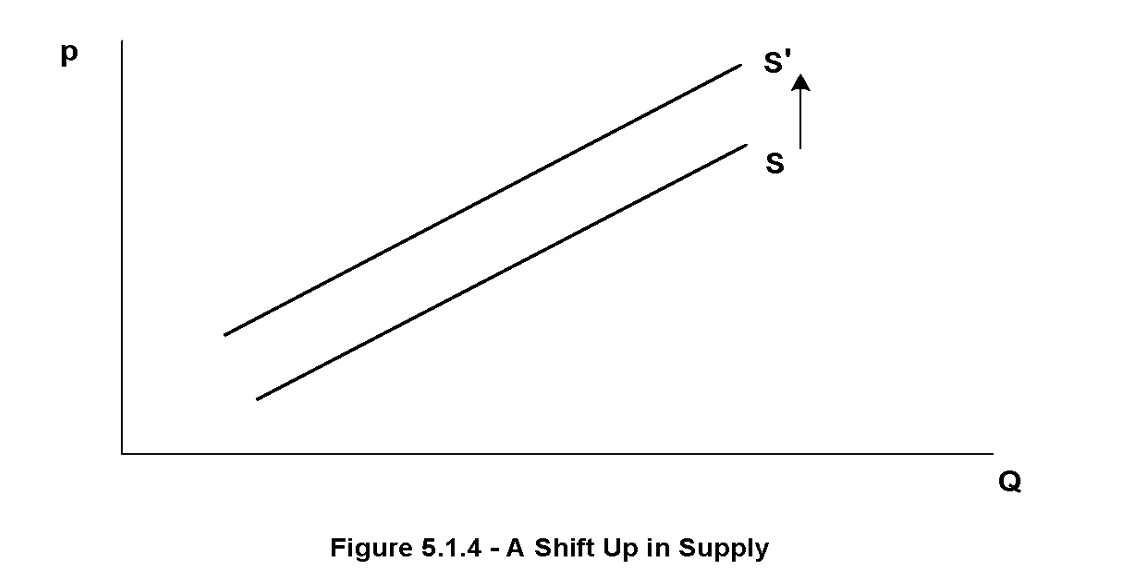
When one of a firm’s cost structure factors changes,
it changes the level of the cost structure, and shifts the whole MC line. Since the MC line is a firm’s supply curve, it is these variables that shift supply
Q₁ˢ = S₁ (p₁ | pᵢ , Tech., Env., #)
Pᵢ is the price of inputs, Tech. is the level of technology, Env. stands for the environment of production, # = number of producers
Supply line shifters (Chapter 3 Reminders)
Change in price of inputs, change in technology (usually goes one way), change in expectations, change in government actions (subsidy, tax), and change in number of producers
If an input price goes up,
the whole cost structure of the firm goes up
It costs more to produce at any quantity
True
Increase in input prices will
shift supply curve up (ex. increase in price of leather shifts supply of gloves up)
If a new technique is developed that allows production at a lower cost, the supply line will
shift down
Change in cost
(change in cost = effect of cost structure, MC, and S)
With the new tech, at any given price, the companies will want to
sell more
If the environment of production deteriorates,
supply will shift up (ex. horrible weather for farmers ruins crops)
In general, if the company likes something, S shifts down to the ____, if they don’t, it shifts up to the ____
right, left
In each of these three cases (three shift variables), what happens to the price and total revenue for the firm depends on the ____ for that product
own price elasticity
If supply shifts up
Total revenue would increase if the demand curve were inelastic. Total revenue would decrease if the demand curve were elastic
If supply shifts down
Total revenue would decrease if the demand curve were inelastic. Total revenue would increase if the demand curve were elastic
The market supply curve
is the sum of the individual firms’ supply curves
Entry and exit of firms
shifts the market supply curve
More firms, more supply at each price level, supply shifts
right
Fewer firms, less supply at each price level, supply shifts
left
Under the nice assumptions that ensure perfect competition, _______ sets the price. Firms and households just have to deal with with, as they have no power
the market
The firm (by itself) faces a
perfectly elastic demand line
The household (by itself) faces a
perfectly elastic supply line
As market supply expands
price falls
As price falls,
intersection of price and MC for the firm falls down to the left. The firm will be at a new position with a lower quantity supplied.
Suppliers and demanders are
constantly responding to the price signal. Under the nice assumptions, all these individual behaviors lead to an incredibly efficient outcome
Describe and show graphically cases of entry and exit on the supply side of the product market
if more firms enter the market to supply a product, ceteris paribus, supply shifts right and price will drop. the opposite is true for firms leaving the market
Describe the elasticity of demand faced by a firm in a perfectly competitive market. Explain why it is as you describe.
the firm will have a perfectly elastic demand. it cannot control the behaviors/tastes of buyers. it cannot say that it's product is better or advertise. it must use price to determine how many items are sold.
A firm’s marginal cost is also its
supply line
If firms LEAVE a particular market, then, ceteris paribus, the market supply line
shifts left
Ceteris paribus, if a firm’s environment of production improves, its cost structure _____, its MC line shifts ______, its Supply line shifts _____
falls, down, down