psychology 2910 - lecture 3 (intro to statistics)
1/22
There's no tags or description
Looks like no tags are added yet.
Name | Mastery | Learn | Test | Matching | Spaced | Call with Kai |
|---|
No study sessions yet.
23 Terms
Why do we use statistics?
1. We don't trust ourselves
- Biases affect our perception of whether data shows strong result
- Need to understand the metric of the data to be able to interpret it
2. We study complex systems and cannot control for every extraneous variable
- Statistics can provide for a different kind of control
3. Some phenomena cannot be studied directly
- Statistics can find patterns in the data that are not obvious to the naked eye
Statistics
A way of understanding data; a decision-making process
Descriptive Statistics
Numbers that describe data (i.e. mean, median, standard deviation)
Inferential Statistics
Making inferences (educated guesses) about a population based on data from a sample
- The correlation between mean number of cigarettes smoked per day and age at death was r(125) = -0.61, which was significant, p < 0.001.
Theory
A general statement about the relation between two or more variables
Hypothesis
A testable prediction about specific events
What is an example of a study that encompasses a theory, hypothesis, and descriptive/inferential statistics?
Theory: interference causes forgetting
Hypothesis: remember fewer letters on fifth trial than first trial
Descriptive: proportion correctly recalled - 0.81 vs. 0.33
Inferential: fewer letters correctly recalled on fifth trial than first trial - t(42) = 2.141, d = 0.45, p < 0.05.
What are some key questions asked about a scientific study?
- Who was studied (random or biased sampling)?
- Why did subjects participate (money, employees)?
- Compared to (was there an appropriate control group)?
- How many (results based on two people, 2,000, or rats)?
- How were the questions worded? (Few people strongly disagree that the world is flat. Agree or disagree?)
- Are statements about causation appropriate?
- Who paid for the study (soft drink industry funding study on sodas)?
- Is study published in reputable peer-reviewed journal?
What is an example of a study that demonstrates the importance of peer-reviewed research?
NASA Study: "results show that plants can play a major role in removal of organic chemicals from indoor air"
- Conducted in sealed chamber in lab (air in chamber cannot escape); completely unlike real indoor environment with natural or ventilation air exchange
Peer-Reviewed Article: published by reputable company (Springer), appropriate board of editors, authors from reputable institution with appropriate degrees, no conflicts of interest
- "Same removal rate that outdoor-to-indoor air exchange already provides in typical buildings"
Population
The set of all individuals of interest
- People between 19 and 29
- Left-handed males over 65
- Children born 1-2 months prematurely
- Humans
Sample
The individuals from a population who were actually tested
Independent Variable
The variable that the experimenter manipulates
- Presence/absence of a drug (i.e. placebo)
- Instructions (i.e. did you get a certain set of instructions or not)
Dependent Variable
The variable that the experimenter measures
- Time
- Accuracy
- Weight loss
Construct
An internal attribute or characteristic that cannot be directly observed (i.e. hunger, tiredness, intelligence)
Operational Definition
Allows others to use the same definition
Hunger: hours since last meal
Tiredness: hours without sleep
Intelligence: score on a particular test
Discrete Variable
Indivisible categories
- Number of children in a family (you can't have half a child!)
- Number of pets
Continuous Variable
Measurement is discrete, but variable is continuous (i.e. can be any value within a range; stress levels can be reported as discrete on a questionnaire, but the underlying construct of stress can theoretically be continuous)
- Height, weight, age, time
Dichotomous Variable
Only two values (i.e. pass vs. fail)
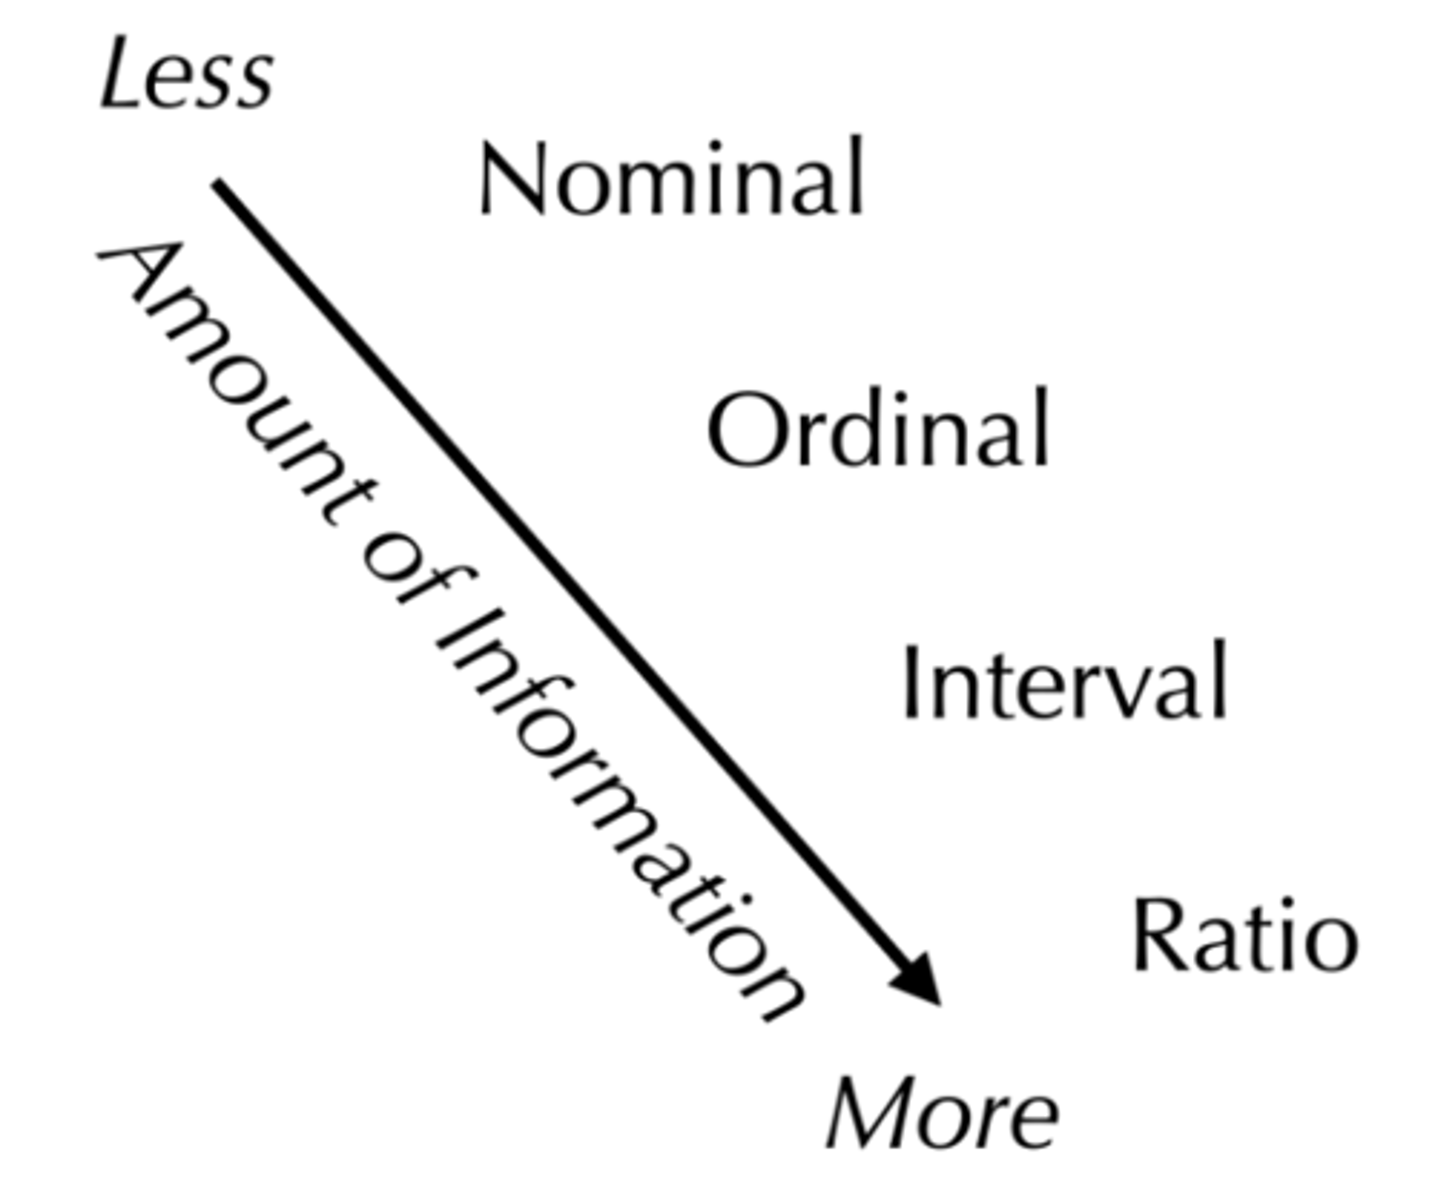
What are the four kinds of measurement scales?
1. Nominal
2. Ordinal
3. Interval
4. Ratio
Nominal Scale
Conveys information only about category; can calculate frequency; cannot have intermediate value (e.g. 1.5); value of "1" not necessarily better or worse than "2"
Type of major:
1 = Psychology
2 = Biology
Ordinal Scale
Nominal scale + information about scale; says nothing about size of intervals, only the order of intervals
Rank order of units at MUN by total enrollment:
1. Science
2. HSSE
3. Business
4. Engineering
- The numbers tell you that there are more students in Science than Engineering, but does not tell you how many more
Interval Scale
Ordinal scale + information about interval; all intervals are of equal size; zero point is arbitrary rather than an absence (zero degrees isn't absence of temperature)
- Temperature in Celsius: Difference between 10 and 11 degrees is the same as between 24 and 25
- IQ, personality measures, clinical tests (likely violate assumption of equal intervals, but for good tests, intervals are approximately equal)
Ratio Scale
Interval scale + absolute zero (zero means an absence)
- Weight in grams (0 g = absence of weight)
- Height in centimetres (0 cm = absence of height)
- Income in $ ($0 = absence of income)