SG. 1 BIS2B MIDTERM 1
1/24
Earn XP
Description and Tags
bio but easy???
Name | Mastery | Learn | Test | Matching | Spaced | Call with Kai |
|---|
No analytics yet
Send a link to your students to track their progress
25 Terms
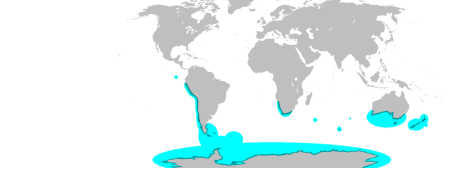
The map below shows the distribution of penguin species on Earth in blue (landmasses are
shown in gray). This distribution can best be explained by...
a. Movement of tectonic plates
b. Dispersal of ancestral penguin species to unconnected landmasses
c. Independent evolution of unrelated species that became penguins in all these regions
d. The rainshadow effect
Answer: A — Movement of tectonic plates
Penguins are only found in the Southern Hemisphere, with fossil evidence showing they evolved before the southern continents (Antarctica, South America, Africa, Australia, New Zealand) split apart. Their modern distribution fits the breakup of Gondwana — explained by plate tectonics, not by later dispersal across oceans (they can’t cross the equator).
Consider the number of species within a given taxonomic group, of any level (kingdom, phylum,
etc). Select all the statements below that are true.
a. A class will contain at least as many species as an order within that class contains
b. A phylum will always contain more species than any class or order
c. All orders contain the same number of families
d. A taxonomic grouping of any level could contain only a single species
Answers: A and D
A — A class contains orders, so it must include at least as many species as any of its orders.
D — True; some taxonomic groups (like monotypic genera) can have only one species.
Incorrect options:B — Not always true; some phyla have fewer species than others’ classes.
C — False; orders can have very different numbers of families.
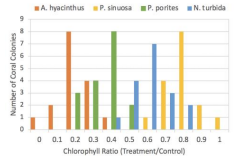
The histogram below shows the chlorophyll ratios (x axis) for four species of coral. The chlorophyll ratio is calculated as the amount of chlorophyll in warming treated corals divided by the amount of chlorophyll in control corals. Chlorophyll is produced by the coral’s algal partner and so higher chlorophyll levels indicate more algal partners present in the coral colony. According to the data shown in the graph, which coral species has the highest heat tolerance?
a. A. hyacinthus
b. P. sinuosa
c. P. porites
d. N. turbida
e. All species shown here have equal heat tolerance
Answer: B — P. sinuosa
A higher chlorophyll ratio means the coral retained more symbiotic algae under heat stress. P. sinuosa had the highest ratio, showing it tolerates heat best. Other species lost more algae (bleached) under warming conditions.
You are developing a study on the effect of increasing ocean acidification (pH levels) on the mortality rates of a marine fish species. You expose individuals of the species to two different pH conditions: normal pH levels the fish regularly experience in their habitat and lower pH values representing the potential impacts of acidification. At the end of the treatments, you measure mortality rates in both populations. For each statement below, determine if the statement is an alternate hypothesis, a null hypothesis, or not an appropriate hypothesis for this study.
a. Fish mortality is the same under high and low pH conditions
This hypothesis is: NULL ALTERNATE NOT APPROPRIATE
b. Higher pH levels are good for fish mortality rates
This hypothesis is: NULL ALTERNATE NOT APPROPRIATE
c. Higher fish mortality increases ocean pH levels
This hypothesis is: NULL ALTERNATE NOT APPROPRIATE
d. Lower ocean pH levels increase fish mortality rates
This hypothesis is: NULL ALTERNATE NOT APPROPRIATE
e. Lower ocean pH levels decrease fish mortality rates
This hypothesis is: NULL ALTERNATE NOT APPROPRIATE
Answers:
a. Null — “Fish mortality is the same” means no effect.
b. Not appropriate — Too vague and untestable (“good for” is undefined).
c. Not appropriate — Reverses causality (mortality doesn’t affect pH).
d. Alternate — Predicts a directional difference (low pH increases mortality).
e. Alternate — Also directional (low pH decreases mortality).
A proper alternate hypothesis predicts an effect; a null hypothesis predicts no difference.
For each item below, determine whether it is an example of weather or climate
a. An atmospheric river that drops heavy rainfall in Davis
This is: WEATHER CLIMATE
b. A tornado in Kansas
This is: WEATHER CLIMATE
c. Lower average annual precipitation in deserts than in the tropics
This is: WEATHER CLIMATE
d. Generally higher fire risk in California than in Kansas
This is: WEATHER CLIMATE
Answers:
a. Weather — A single storm event.
b. Weather — A tornado = short-term event.
c. Climate — Long-term precipitation patterns.
d. Climate — Fire risk trends = long-term average conditions.
How do greenhouse gasses like carbon dioxide affect the earth’s radiation budget?
a. They increase the amount of the Earth’s radiation that is retained in the atmosphere
b. They increase the amount of solar radiation that is reflected by clouds into space
c. They increase the amount of solar radiation that the earth receives from the sun
Answer: A
Greenhouse gases absorb infrared radiation emitted by Earth and re-radiate it back, retaining heat in the atmosphere and raising average temperature. They don’t increase incoming solar energy — they trap outgoing energy
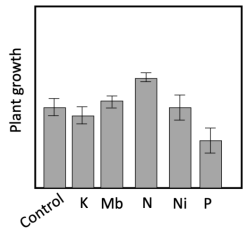
You are interested in determining the limiting nutrient of plants in a garden. You collect the data in the figure below by comparing growth under control conditions (with no additional nutrients) to growth of plants with added nitrogen, phosphorus, molybdenum, potassium, or nickel. In this ecosystem, which nutrient is limiting?
a. Phosphorous (P)
b. Nitrogen (N)
c. Molybdenum (Mb)
d. Potassium (K)
e. Nickel (Ni)
f. None of these nutrients are limiting in this
environment
Answer: B — Nitrogen (N)
The bar graph showed plants with added nitrogen had the greatest increase in growth over the control. According to Liebig’s Law of the Minimum, the limiting nutrient is the one that, when added, most increases growth.
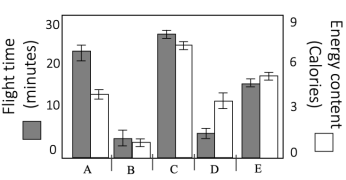
You are studying which meadows a hive of honeybees visits for nectar foraging. You collect the data below for five different meadows (A-E, x axis) including energy investment in accessing the meadow, in terms of honeybee flight time (gray bars, left y axis)) and the energy content of nectar in flowers blooming in each meadow in calories (white bars, right y axis). Which meadow does optimal foraging theory predict the honeybees should visit?
a. Meadow A
b. Meadow B
c. Meadow C
d. Meadow D
e. Meadow E
f. All five meadows are equally
beneficial in terms of optimal
foraging theory predictions
Answer: D — Meadow D
Optimal foraging predicts animals maximize energy gained per energy spent. Meadow D provides the best tradeoff — high nectar energy and moderate travel cost — yielding the greatest net benefit.
Anadromous fish are unusual in that they are able to migrate between marine and freshwater environments throughout their life, which requires a shift in the osmoregulatory mechanisms by which the fish maintains an appropriate balance of water and salt in its body. In the marine environment, the ocean is [blank1] compared to the fish’s body and water will move
[blank2].
Options for blank 1: hypotonic, hypertonic, isotonic
Options for blank 2: into the fish’s body, out of the fish’s body
Answer: Ocean is hypertonic; water moves out of the fish’s body.
Marine water has higher solute concentration than fish tissues. Water leaves the fish by osmosis, so the fish must drink seawater and actively excrete excess salts to maintain balance
10. Anadromous fish such as salmon spend the majority of their lives in the ocean (which is saltwater), but migrate to rivers (which are freshwater) to mate and reproduce. During this migration, salmon spend a period of time at the mouth of the river to allow their salt regulatory mechanisms to adjust to the change in salinity between the ocean and the river. This is an
example of...
a. Acclimation
b. Adaptation
Answer: A — Acclimation
Salmon temporarily adjust physiology (ion pumps, kidney function) as they move between salt and freshwater. Acclimation is a reversible, individual-level change — not an evolutionary adaptation.
11. Wild turkeys are commonly found around Yolo County, including in the city of Davis. While the adult birds can tolerate a wide temperature and precipitation range, juvenile turkeys (eggs and hatchlings) are more susceptible to cold, especially under wet conditions. Wild turkeys eat a wide variety of foods, including seeds and berries, as well as small insects and other invertebrates. These types of food are especially common in agricultural fields in Yolo County, meaning wild turkeys commonly roost in portions of the county with a high prevalence of agricultural lands. Some regions of the county, such as the town of Winters, are home to wild peafowl, which have similar abiotic tolerances and food sources as wild turkey. Though smaller than wild turkeys, peafowl are aggressive enough to outcompete the wild turkey for food and space.
Which of the following statements are true about the niche of wild turkeys? Select all that
apply
a. The fundamental niche of wild turkeys changes throughout their lifespan
b. The realized niche of wild turkeys excludes regions inhabited by wild peafowl
c. The fundamental niche of wild turkeys is influenced by human agricultural activities
d. The realized niche of wild turkeys is reduced compared to its fundamental niche
e. The realized niche of wild turkeys is influenced by the amount of precipitation in winter
Answers: A, B, D
A — Fundamental niche changes with life stage (young turkeys are less tolerant).
B — Realized niche excludes areas with peafowl (competition).
D — Realized niche is smaller than fundamental due to biotic limits.
C is false — agriculture affects where they live, not the physiological niche.
E — Precipitation affects survival but not directly part of realized niche limits here.
Many organisms use evaporation of water as a cooling mechanism. For example, humans produce sweat, dogs pant, and plants transpire water through pores in their leaves. While this strategy is effective for reducing body temperature, what trade-off is it most likely to impose?
a. A reduction in the nutrients available to invest in defensive compounds for avoiding
predation or herbivory
b. An increase in the energy required to complete other life processes such as reproduction
c. An increased risk of dehydration or desiccation
d. A reduction in the fundamental niche of the species to regions with cooler temperatures
Answer: C — Increased risk of dehydration/desiccation
Sweating, panting, or transpiration lose water to cool the body. The trade-off is losing too much water, especially dangerous in dry environments.
13. Scientists discover a new species of fish in a deep ocean trench and biologists studying them collect the following life history data: The fish are very large, nearly 200 tons in weight and over 30 meters in length. Their life span is about 800 years and they take nearly 100 years to reach sexual maturity. After mating, each female lays thousands of eggs in a nest on the ocean floor that she does not revisit or maintain after laying the eggs. Once the eggs hatch, many of the juveniles succumb to disease or predation and do not survive to maturity. How would you describe this species in terms of r and K strategists?
a. These traits are all r-strategist
b. These traits are all K-strategist
c. These traits are in-between r and K strategist (in the middle of continuum, not at either
extreme)
d. This species has some r-strategist traits and some K-strategist traits (at both ends of the
continuum, representing both extremes)
Answer: D — Some r and some K traits
Long lifespan and large body = K traits; many eggs and no parental care = r traits. This mix places the species at both extremes, showing not all organisms fit one category cleanly.
Put these terms in order from most broad to most specific: phylum, species, kingdom, class, family, order, genus
Answer: Kingdom → Phylum → Class → Order → Family → Genus → Species
This hierarchy goes from most broad (kingdom) to most specific (species).
Compare and contrast species richness and species evenness.
Richness: Number of species present.
Evenness: How evenly individuals are distributed among those species.
High richness + high evenness = high biodiversity. Example: a forest with 10 equally abundant species is more diverse than one dominated by a single species
What process drives the difference in vegetation between the western- and eastern-facing slopes of the Sierra Nevada mountains?
Answer: The rainshadow effect
Air rises and cools on the west side (raining out moisture). Descending air on the east side is dry, creating deserts. This drives major vegetation differences between slopes.
17. How does the tilt of the Earth’s axis drive seasons?
Answer: The tilt causes one hemisphere to receive more sunlight at different times of year. When tilted toward the Sun, that hemisphere experiences summer; when away, winter.
How do current concentrations of greenhouse gases (carbon dioxide, methane, and nitrous oxide) compare to historic levels?
Answer: Modern levels far exceed historical ones.
CO₂ levels (~420 ppm) are much higher than the pre-industrial 180–300 ppm range seen over 800,000 years in ice cores. Methane and nitrous oxide have also increased dramatically since the Industrial Revolution.
19. Using the Principle of Allocation, explain the concept of a trade-off. Give an example of a tradeoff
involving adaptations or strategies for:
a. Resource acquisition
b. Reproduction
Organisms have limited energy and must allocate it between competing needs — e.g., growth, reproduction, defense, maintenance.
Examples:
a. Resource acquisition: Root vs. shoot growth.
b. Reproduction: Few large offspring (K) vs. many small ones (r).
20. Compare and contrast the following terms:
a. Evolution and ecology
b. Species richness, species evenness, and species diversity
c. Endotherm and ectotherm
d. Weather and climate
e. Rhizobia and mycorrhizae
f. Fundamental niche and realized niche
g. r-selected traits/organisms and K-selected traits/organisms
h. hypertonic, hypotonic, isotonic
i. Bergmann’s Rule and Allen’s Rule
Examples:
a. Resource acquisition: Root vs. shoot growth.
b. Reproduction: Few large offspring (K) vs. many small ones (r).a. Evolution vs Ecology: Evolution = genetic change; ecology = interactions between organisms and environment.
b. Richness/Evenness/Diversity: Diversity depends on both richness (# species) and evenness (relative abundance).
c. Endotherm vs Ectotherm: Internal vs environmental temp regulation.
d. Weather vs Climate: Short-term vs long-term atmospheric patterns.
e. Rhizobia vs Mycorrhizae: Bacterial vs fungal mutualists with roots.
f. Fundamental vs Realized Niche: Potential vs actual range (biotic constraints).
g. r vs K Selection: Fast vs slow life strategies.
h. Hyper/Hypo/Iso: Solute concentration comparisons in osmoregulation.
i. Bergmann’s vs Allen’s Rule: Body size and appendage length correlate with temperature.
21. Using your understanding of osmoregulation, explain why the Hawaiian Islands have no native amphibians.
Amphibians’ skin makes them prone to dehydration in saltwater; they can’t cross oceans. Hawaii’s isolation prevented natural colonization, so all amphibians there were human-introduced.
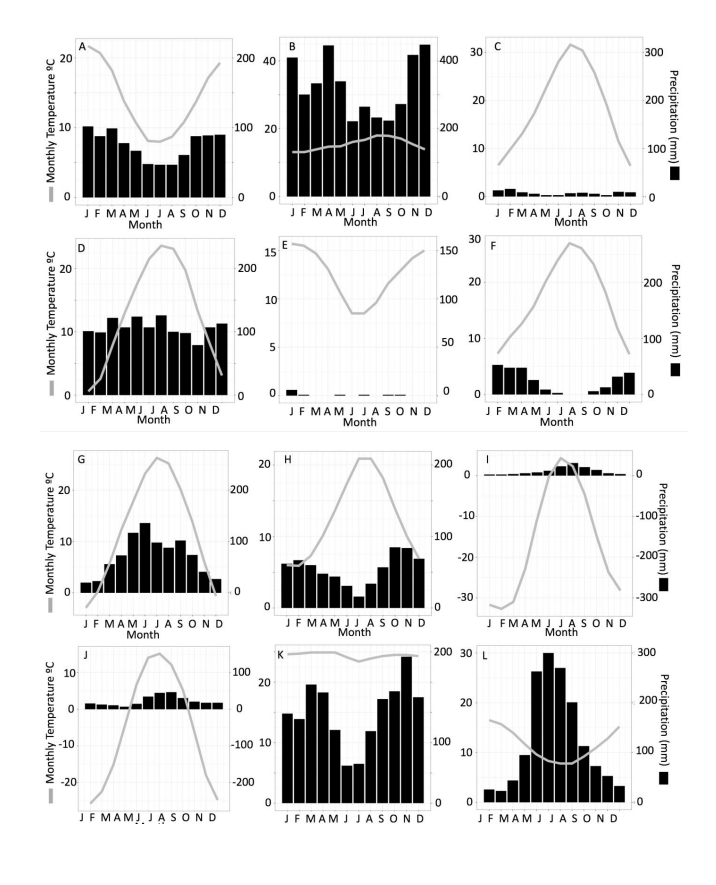
Assign each of the climatographs below to a biome and to a hemisphere (northern, southern, or equatorial). Possible biomes include deserts, grasslands, tropical rainforests, temperate forests, boreal forests, tundra, and Mediterranean climes. Be prepared to explain your decision.
A. Mediterranean Shrubland (Chaparral)
Hot, dry summers; mild, wet winters
B. Tropical Rainforest
Warm all year; heavy rain year-round
C. Tropical Savanna / Seasonal Forest
Hot all year; wet summer, dry winter
D. Temperate Deciduous Forest
Warm summers, cold winters; rain all year
E. Tundra
Cold most of year; very little rain
F. Hot Desert
Very hot; extremely dry
G. Temperate Grassland (Prairie/Steppe)
Warm summers, cold winters; rain mostly in summer
H. Boreal Forest (Taiga)
Long, cold winters; short, mild summers
I. Polar Ice Cap
Freezing all year; almost no precipitation
J. Cold Desert
Cold and dry year-round
K. Tropical Monsoon Forest
Hot; heavy summer rain, dry winter
L. Tropical Dry Forest
Hot; strong wet/dry seasons
23. As CO2 began to rise, there was a hypothesis that plants would photosynthesize more, removing the additional CO2 from the air. Use your knowledge of plant resource acquisition to propose an explanation for why increased CO2 in the atmosphere might not significantly increase photosynthetic rates in plants.
If CO₂ isn’t the limiting factor (e.g., nitrogen or water is), then adding CO₂ won’t boost photosynthesis. Liebig’s Law — growth is limited by the scarcest resource
Humans have a fondness for sugary and fatty foods. How does optimal foraging theory explain the evolution of this preference? Given our current ecological conditions, what are the consequences of this preference?
High-fat and high-sugar foods provide the most energy per unit effort — historically adaptive. Today, in abundance, the same preference leads to overconsumption and health issues.
25. Imagine you are doing research on plant populations at Jepson Prairie. How would you determine what resources limit plant growth in this environment?
Add nutrients in separate test plots and compare growth to a control. The nutrient causing the largest increase in growth is limiting — a direct application of Liebig’s Law.