Topic 1.1: The Practice of Political Scientists - Political Science
1/174
There's no tags or description
Looks like no tags are added yet.
Name | Mastery | Learn | Test | Matching | Spaced | Call with Kai |
|---|
No analytics yet
Send a link to your students to track their progress
175 Terms
Definition of political science
scientific study of politics
Politics
Focuses on resource and power distribution and mechanisms behind it: "who gets what, when, and how" (Harold Lasswell)
Scientific study aims to
discover general truths or laws governing phenomena
Criticism to political science
Political science focuses on vague, abstract topics, not general laws or objective truths.
Normative Political research
Focus: How politics should function and what it ought to achieve.
Core concepts: Power, liberty, justice, governance.
Empirical/Positivist Political Research
Focus: How political phenomena vary and function in reality.
Research areas: Political institutions, behavior, and norms.
What's the goal of empirical/positivist political research (2)
Accurate description of political phenomena.
Identification of predictable relationships between variables.
-What regime balances liberty and community interests?
-How to restore justice post-unjust regimes (transitional justice)?
-Defining oppression and liberty under political environments.
-Does economic development foster democracy or vice versa?
-Impact of transitional justice measures on democracy.
-Measuring and comparing oppression across regimes.
Which of these questions are empirical/positivist, and which are normative?
Normative:
-What regime balances liberty and community interests?
-How to restore justice post-unjust regimes (transitional justice)?
-Defining oppression and liberty under political environments.
Empirical:
-Does economic development foster democracy or vice versa?
-Impact of transitional justice measures on democracy.
-Measuring and comparing oppression across regimes.
variables
factors that change
dependent variable
phenomenon to explain (outcome)
independent variable
Explains/causes the dependent variable
hypothesis
Testable guess about variable relationships.
explanatory theory
Evidence-supported generalization explaining relationships.
Interpretivist Political Research
Focus: Description and understanding of political processes; skeptical of universal rules.
How is interpretivist political research opposed to positivism?
Rejects purely objective knowledge; emphasizes subjective experiences. Positivists use surveys; interpretivists use open-ended interviews.
Methods for interpretivist political research
Methods: Interviews, focus groups, participant observation.
Judicial independence:
Positivists elicit "_____" responses.
Interpretivists explore _____ interpretations.
Judicial independence:
Positivists elicit "objective" responses.
Interpretivists explore subjective interpretations.
Stages of Empirical Analysis (6)
1. Conceptual Description: Define terms (e.g., judicial independence).
2. Classification and Measurement: Determine how to measure manifestations (e.g., court decisions).
3. Hypothesis Formulation: E.g., Professional norms vs. institutional causes of independence.
4. Data Collection: Interviews, document analysis.
5. Hypothesis Testing: Determine validity of explanatory factors.
6. Prediction & Theory Development: Build/test predictive theories (e.g., institutional reform implications).
Scientific Method in Political Research (9)
1. Observation: Gather information.
2. Proposition: Develop initial ideas.
3. Hypotheses: Formulate testable predictions.
4. Operationalization: Define how concepts will be measured.
5. Research Design: Plan the study.
6. Data Collection: Gather evidence.
7. Analysis: Interpret data.
8. Generalization: Form broader conclusions.
9. Theory Reformulation: Refine explanations.
Interdependence of approaches
-Normative positions rely on empirical evidence for accuracy.
-Empirical findings often have normative consequences.
-Many empirical concepts (e.g., democracy) are rooted in normative questions.
-Interpretivist insights ensure accurate classification/measurement.
This makes all approaches VALID
-Does giving judges lifetime appointments make them more independent? Why? How?
-Which European countries have the highest support for Ukraine in its defense from Russia's invasion? Why?
-Does a family history of suffering repression affect political participation through voting or protest? Why? How does it work?
Are those good empirical questions?
yes
definition of a theory
A potential explanation that answers a research question through logically related propositions explaining political phenomena.
Goals of theories
-Explain what happened.
-Predict future outcomes.
-Explain differences between cases (e.g., individuals, events, countries).
-Explain changes over time.
Relationships between concepts are determined by which 3 questions in theories?
"How" are they related?
"When" are they related?
"Why" are they related?
Induction theory-building
Bottom-up approach; generalizations based on observations.
Deduction theory-building
Top-down approach; starting with a theory and deriving empirical implications.
How can we develop new theories? (3)
-Identify problems or gaps in existing theories (e.g., missing variables).
-Apply famous theories to new cases for fresh insights.
-Examine outliers or exceptions to existing theories.
Hypothesis
Definition: A statement about the relationship between two variables (independent and dependent), their direction, and a comparison (unit of analysis).
Example format:
"In a comparison of [units of analysis], those having [value on IV] are more likely to have [value on DV] than those with [different IV value]."
A hypothesis must be
falsifiable/testable
Characteristics of a good hypothesis: right balance of generality
Too broad: "People who care about politics are more likely to participate in it."
Too narrow: "People who work on campaigns know more about their candidate's positions."
Just right: "People who vote regularly are more likely to protest than those who don't vote."
Characteristics of a good hypothesis: Specific and unambiguous
Ambiguous: "A country's geographic location determines its regime type."
Specific: "Countries surrounded by autocracies are more likely to be autocracies."
Common mistakes in hypothesis:
Vague or single-variable statements (e.g., "High gun ownership is a problem in the US").
No relationship specified (e.g., "High gun ownership is bad for democracy").
Incomplete or improperly specified statements (e.g., "High gun ownership is a problem for democracies").
Value judgments (e.g., "High gun ownership is uncivilized").
Tautologies (e.g., "High gun ownership is associated with lax gun laws").
High gun ownership causes higher rates of violent crime. Is this a good hypothesis?
yes
Unit of Analysis
Examples:
Individuals: "The more educated a person is, the more likely they are to vote."
Wars: "Civil wars resolved by negotiation are less likely to re-erupt than those ended by military dominance."
Elections: "US elections with equal spending between candidates are decided by narrower margins."
Countries: "Affluent countries are more likely to be democracies."
Provinces: "Provinces with more immigrants tend to be more tolerant toward minorities."
What are the 4 levels of measurement?
nominal, ordinal, interval, ratio
nominal measurement
Categories without hierarchy or numerical relation.
Examples:
Democracy (yes/no), sex (M/F), regime types, religion, voting (yes/no).
ordinal measurement
Categories with hierarchy, but inconsistent intervals.
Examples: Feeling thermometers for politicians, democracy indices (e.g., V-Dem, Freedom House), levels of corruption or religiosity.
Interval measurement
Fixed, known intervals between categories; quantitative meaning.
Examples: Voting records over time.
Ratio measurement
Like interval, but with a non-arbitrary zero point (indicates absence).
Examples:
Weight, age, budget deficits, party system size, protest participation, church attendance as a proxy for religiosity.
Institutional Definition
Definition: Judicial independence as judicial insulation, which includes:
-Judicial control over judicial careers.
-Judicial control over the judicial budget.
Advantages & Disadvantages of judicial definition
Advantages:Easy to measure.Straightforward implementation.
Disadvantages:Weak conceptual link to the rule of law.Limited empirical evidence supporting the link.Low theoretical utility.
Behavioral Definition
Judges adjudicate based on their interpretation of the law, not influenced by external actors (even under threat of backlash or punishment).
Measures of behavioral definition
1. Opinion Surveys on Judges: Extent and source of extra-judicial interference.
2. Career Tracing: Comparing career success of judges who favor vs. oppose incumbents.Cataloging punishment of judges ruling against incumbents.
Advantages & disadvantages of behavioral definition
Advantages: Intuitive and straightforward.
Disadvantages: Hard to measure.Weak empirical link to the rule of law.
Judicial Output Definition
No actor consistently secures judgments aligning with their preferences
Measures of judicial output
1. Reputational Indices: Business owners’ assessments based on personal court experience.Country experts’ assessments of independence.
2. Win Rates:Simple counts of government wins in court.Multi-stage win-rate analysis of judicial outcomes.
Advantages & Disadvantages for judicial output definition
Advantages:Directly linked to rule of law.Supports political, civil, and property rights.
Disadvantages:Labor-intensive.Difficult for comparative studies across many countries.
Studies with null results are more/less likely to be published
less
Biases Affecting Publication:
Status bias (author prestige).
Racial bias.
Gender bias.
Detecting Falsified Data can be...
Difficult to identify fabricated or manipulated data.
Example: Vaccines cause autism study was fake but undetected initially.
To eliminate biases in research, we can ... (3)
Replication: Make all data and code public for verification.
Pre-registration: Register analyses before conducting the study.
Registered Reports: Peer review papers before data collection begins.
In Canada, social science research is guided by three Core Principles
Respect for Persons:
-Assure confidentiality and, when possible, anonymity.
-Maintain informed consent.
-Respect participant autonomy.
Concern for Welfare:
-Ensure participants' well-being.
-Consider relationships and potential impacts on others.
Justice:
-Ensure fairness and equality, particularly with vulnerable populations.
Informed Consent
Explaining the research nature, participants' rights, and researchers' obligations.
Involves participants agreeing to the study with full understanding.
Full disclosure without informed consent may be valid when (4)
Deception: Needed to avoid altering behavior.
Incapacity: Some participants cannot give consent.
Insufficient Individual Consent: Requires approval from communities, families, school boards, etc.
Trust Issues: Asking for consent might undermine the study.
We must apply for _____ before conducting research to comply with ethical standards
In Canada, Institutional Review Boards (IRBs) or Research Ethics Boards (REBs) ensure compliance with ethical standards and guidelines.
Transferability in qualitative vs. quantitative research
Qualitative Research: Findings must be transferable to other cases.
Quantitative Research: Requires external validity for generalization.
Three Key Factors Influencing Representativeness in Samples
Frame: Identifies key characteristics and population parameters.
Technique (Methodology): Affects likelihood of sample bias.
Size: Must provide sufficient information to capture population nuances.
Sampling Frame
Source from which a sample is drawn; contains all units in the population.
Examples: Census data, NGO datasets.
Challenges drawing from sampling frames (2)
May lack key parameters (e.g., age, years in politics).
May be incomplete, making representativeness difficult to assess.
Probability Sampling definition & advantages (2)
Sample is selected by random chance.
-Reduces researcher bias.
-Allows use of inferential statistics to generalize findings.
What are the 3 techniques for probability sampling?
systematic selection, stratified sampling, cluster sampling
systematic selection
Randomize population list, choose a random starting point, and sample every kth unit.
Example: Select every third unit.
stratified sampling
-Divide population into subgroups (mutually exclusive and collectively exhaustive).
-Can oversample smaller groups for focused analysis.
Example: Sampling based on language or religion.
cluster sampling
Divide population into heterogeneous clusters.
Randomly select clusters and sample within them.
Example: Selecting lab sections or conference groups.
Non-probability sampling
Sample taken according to specific criteria or purpose.
Limitations to non-probability sampling
Cannot use inferential statistics to generalize findings.
What are the 4 types of non-probability sampling?
convenience, purpose, snowball, quota
convenience sampling
"Take what you can get." Limited utility.
purpose sampling
Seek individuals with expertise or specific experiences.
snowball sampling
Start with a few cases and pursue leads from those.
quota sampling
Select purposive groups (e.g., 15 men, 15 women).
descriptive statistics:
Require advanced/simple math
Provides a .... view of the unit of analysis
Can be used with ____ samples
Focus:
Limitations:
Require only simple math.
Provide a "bird's-eye view" of the unit of analysis.
Can be used with small samples.
Focus:
-Comparing numbers across cases.
-Presenting numbers as they are (no complex calculations).
Limitations:
-Do not test hypotheses.
-May be misleading if interpreted without context
inferential statistics:
Require advanced/simple math
Aim to demonstrate ... relationships
Control for ...
Require larger/smaller sample sizes
-Require advanced math.
-Aim to demonstrate causal relationships.
-Control for confounding variables.
-Require larger sample sizes.
Applications:
-Multivariate controls.
-Mathematical models (e.g., analyzing 3,000 county-level observations).
Sampling distribution
Distribution of a statistic (e.g., mean, proportion) across many samples. Shows the variability expected due to random chance.
Why do we want larger samples when evaluating sampling distribution? Why might polls be wrong because of this?
Small samples may yield skewed or unrepresentative results.
Larger samples reduce randomness and produce more consistent results.
Explains why polls may be wrong—they deal with probabilities, not certainties.
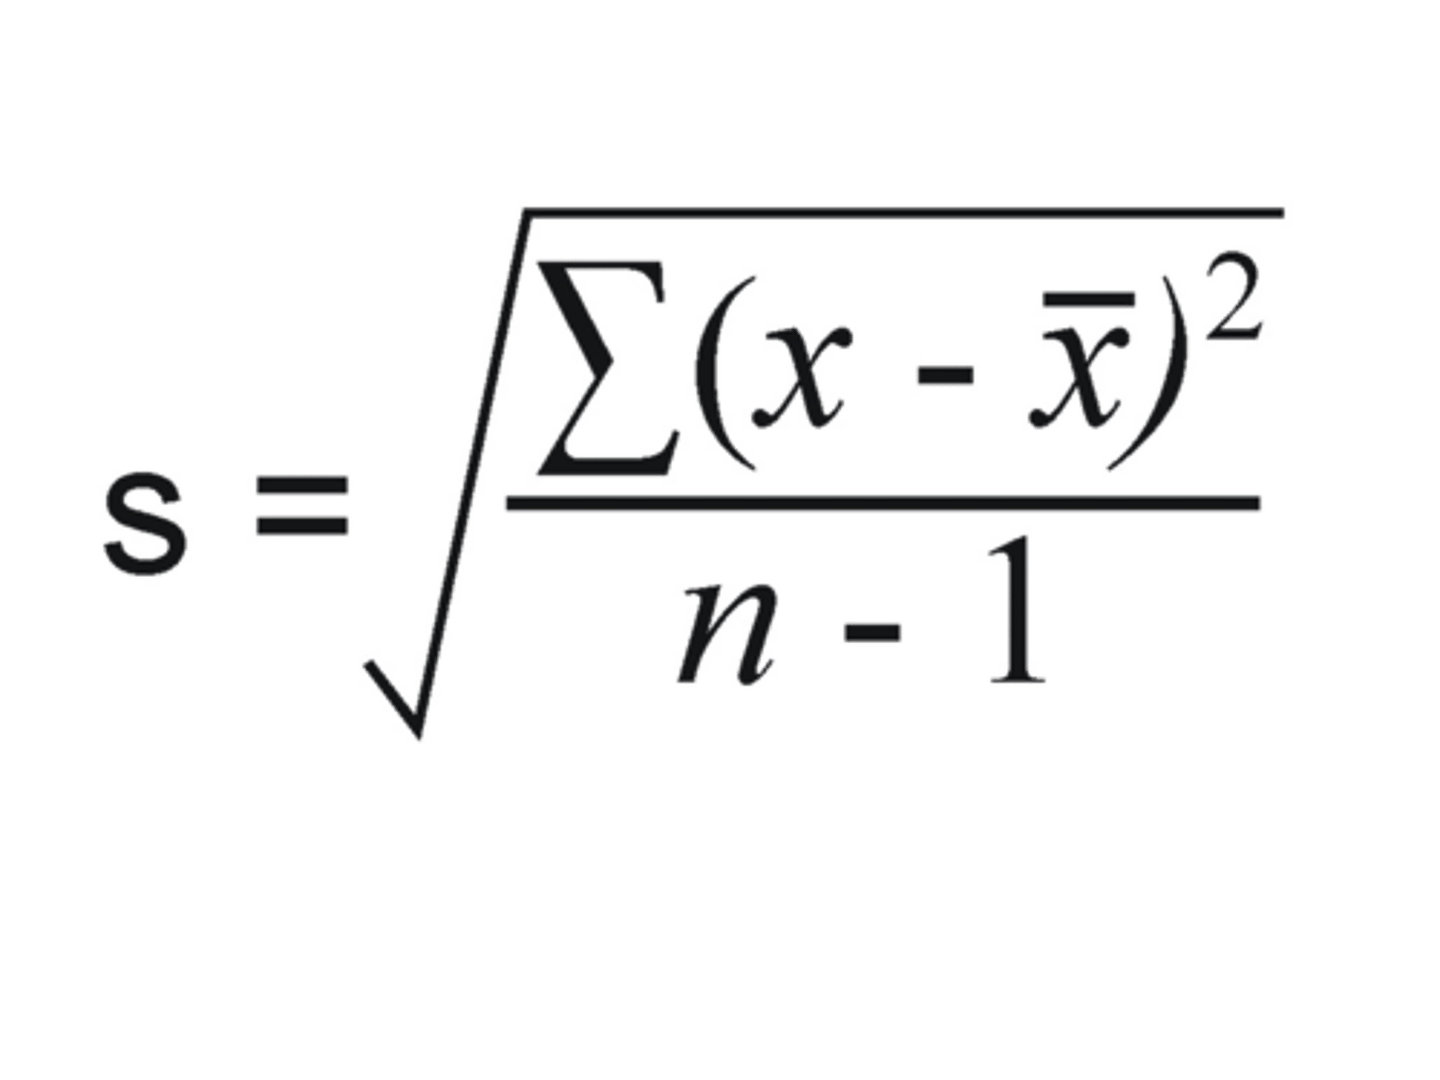
standard deviation
Smaller SD =
Larger SD =
Measures how far each value deviates from the mean.
Smaller SD: Data points are close to the mean.
Larger SD: Data points are spread out.
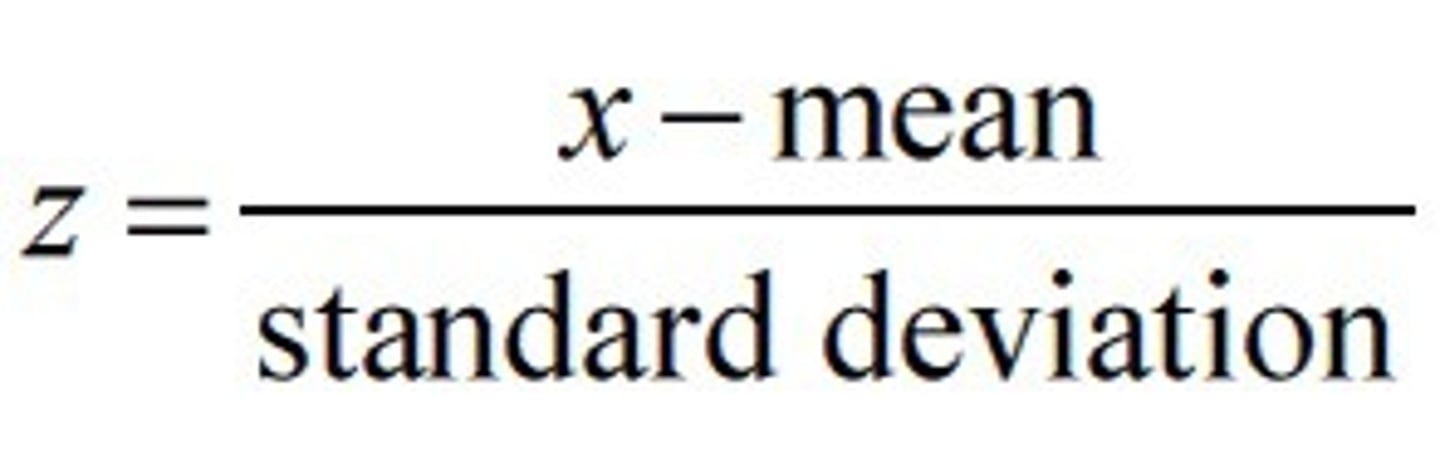
Standardized Score (Z-Score)
inferential or descriptive statistics?
Shows how many standard deviations an observation is from the mean.
A positive z-score means the value is above the mean, vice versa
Enables basic inferential statistics.
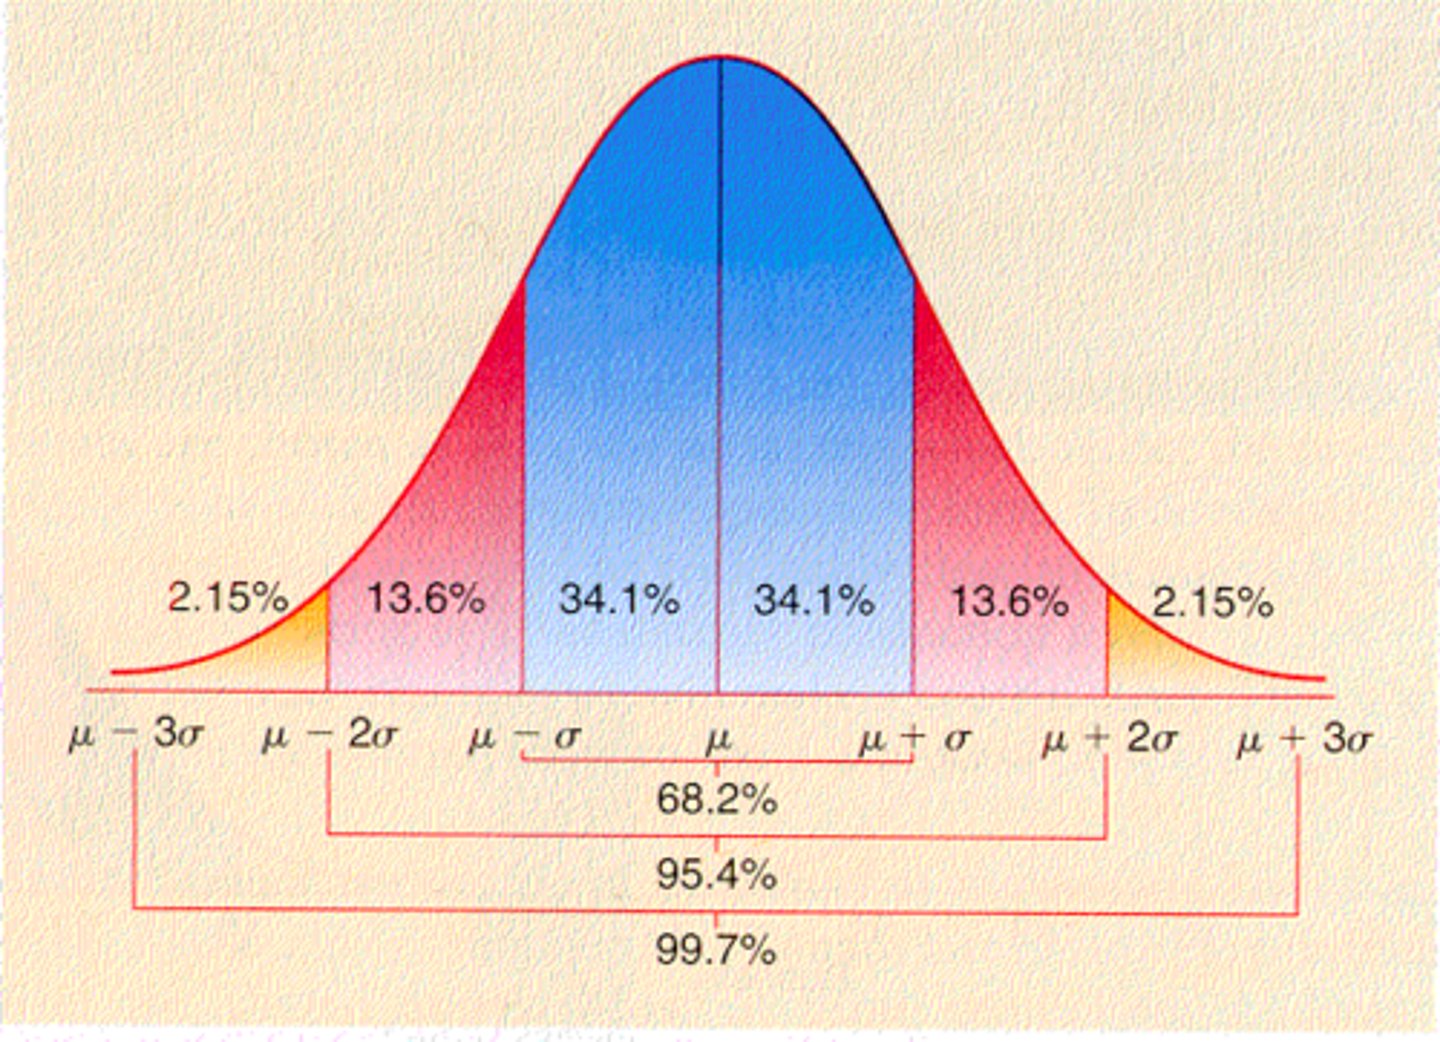
normal distribution
68, 95, 99.7
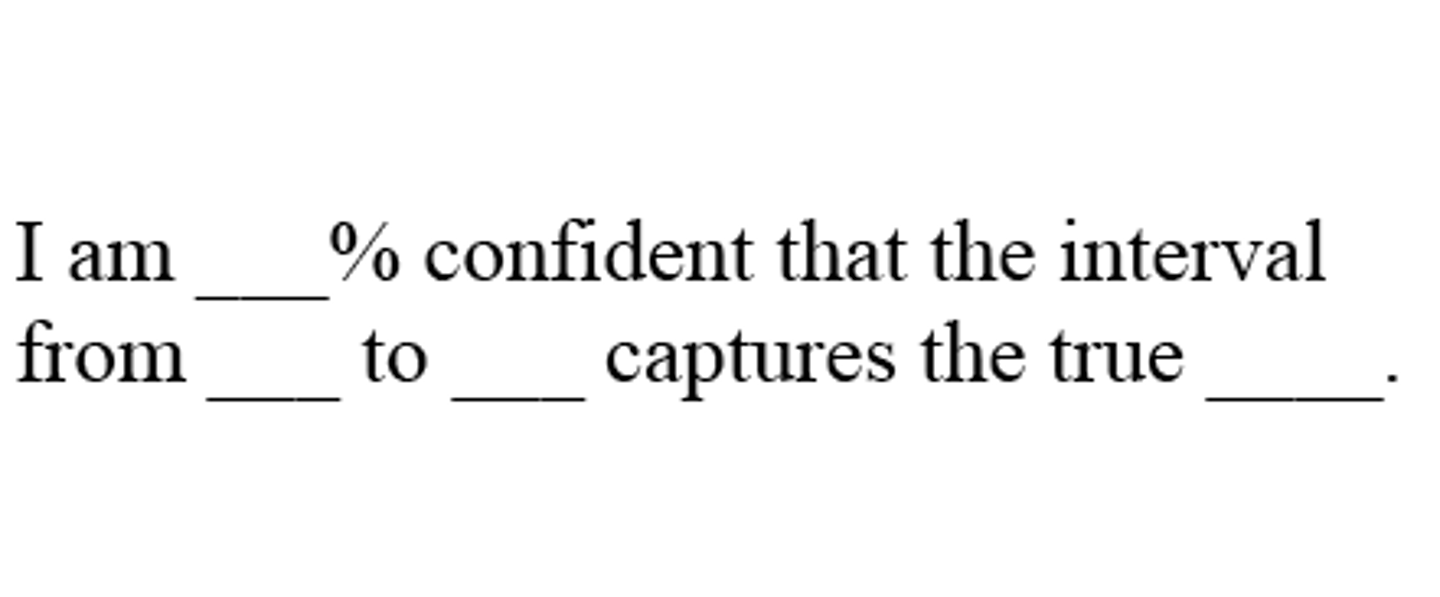
confidence level
The level of certainty that a population parameter exists in the calculated confidence interval.
Determine the likelihood of rejecting the null hypothesis when it is true (Type I error).
Common choices: α=0.05 (5%) or α=0.01 (1%).
P-value
A p-value measures the probability that the observed data occurred by chance, assuming the null hypothesis is true.
We reject the null hypothesis when the p-value is
smaller than the confidence interval (usually 0.05)
type 1 error
(false positive) Rejecting null hypothesis when it is true
type 2 error
(False Negative):
Failing to reject the null hypothesis when it is actually false.
A low p-value means that
The observed result is unlikely to have occurred by chance.
Reject the null hypothesis (result is statistically significant).
A high p-value means that
The observed result could reasonably occur by chance.
Fail to reject the null hypothesis.
Example:
Religious Support percentile: 97th
P-value: 0.0047
Interpretation:
P value is less than 0.05 so the result is statistically significant, suggesting Israel's religious support is unusually high compared to other democracies.
bivariate analysis
Examining relationships between two variables.
multivariate analysis
Exploring multiple variables simultaneously.
T-test is used when
It compares the ...
Used when "x" has two values (binary data), but also appropriate for ratios/intervals.
Compares the difference between sample means to determine if it's statistically significant.
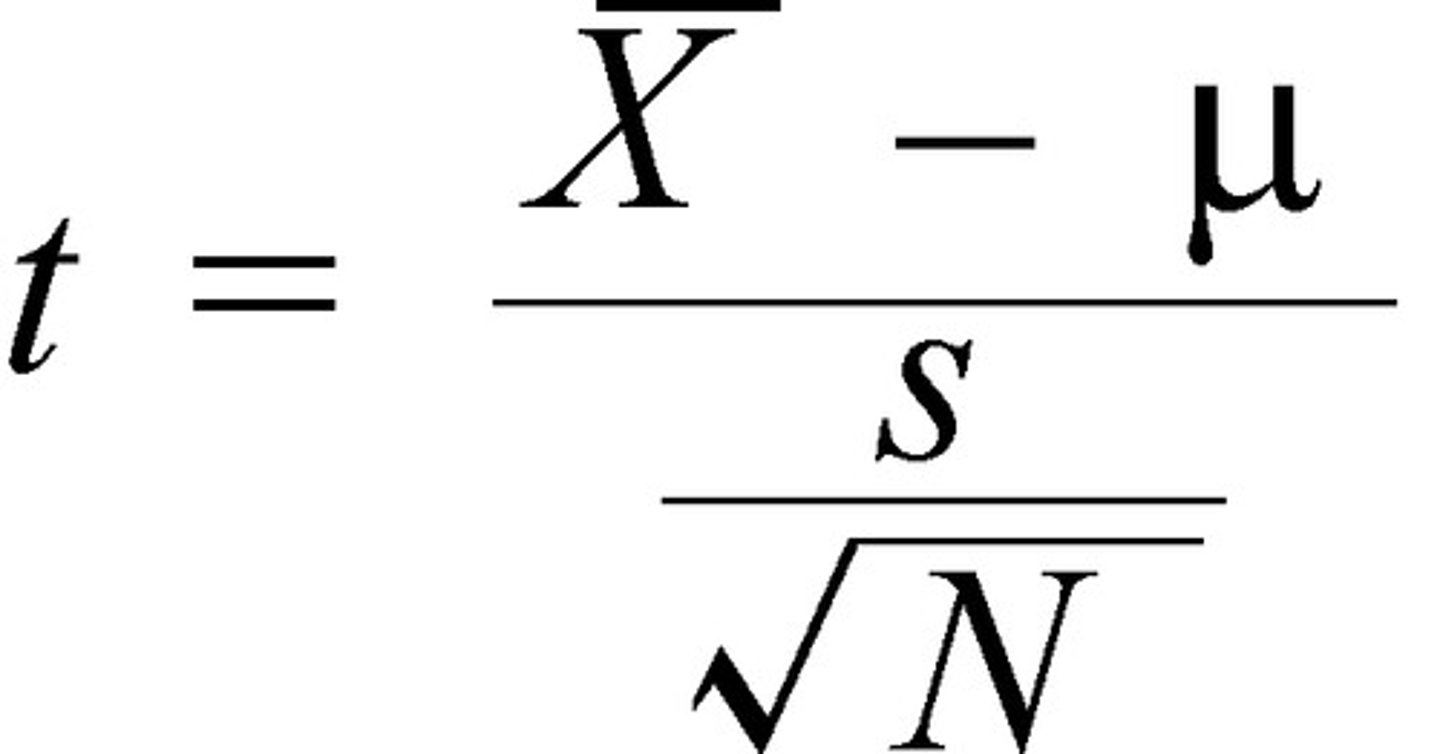
How's the t-test similar to the z-score
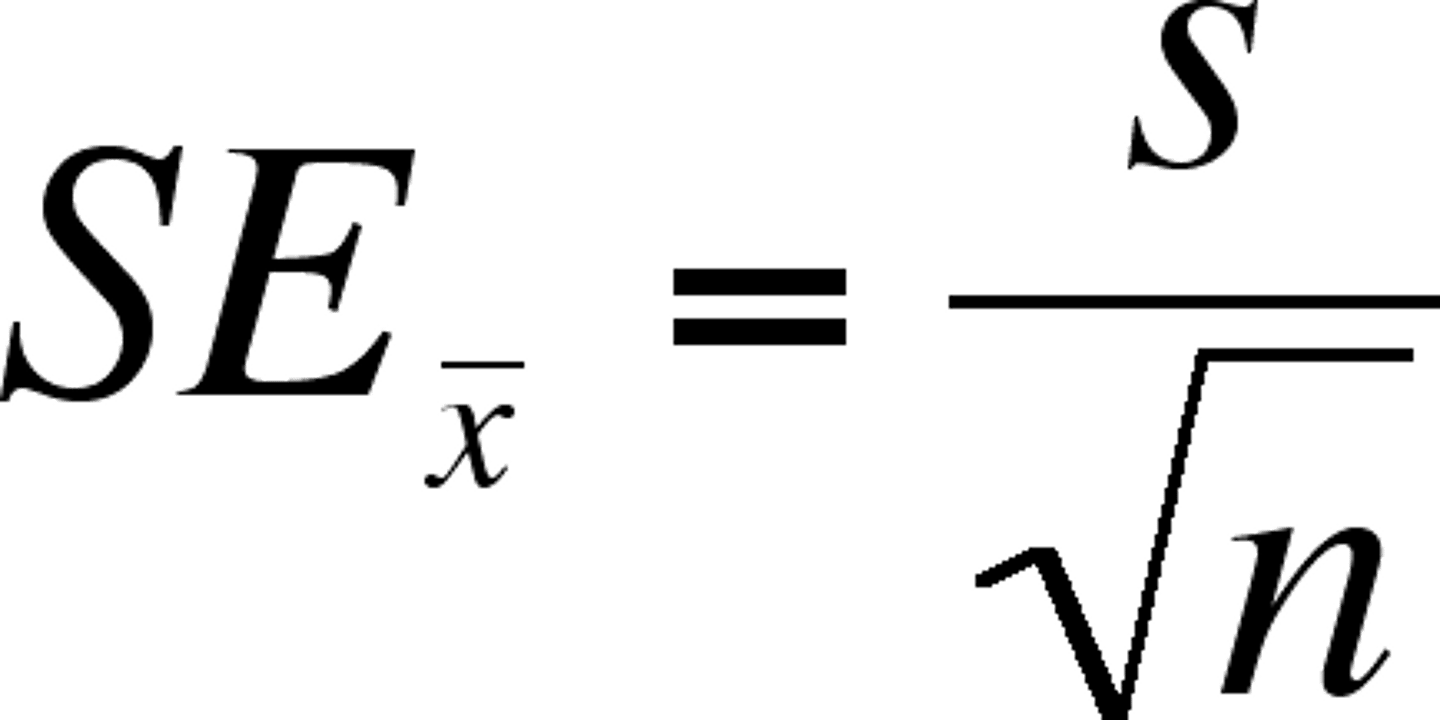
Similar to the z-score, but uses standard error instead of the standard deviation.
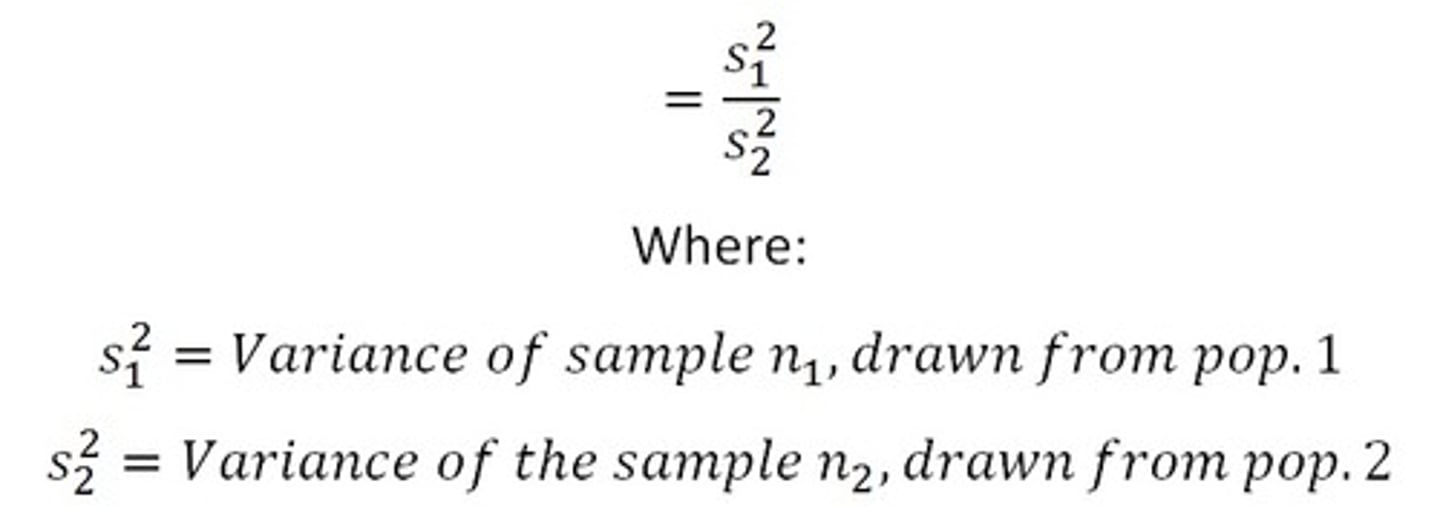
F test is used when... compares....
Used when "x" is a discrete variable (categorical data).
Compares variances between groups to test the hypothesis.
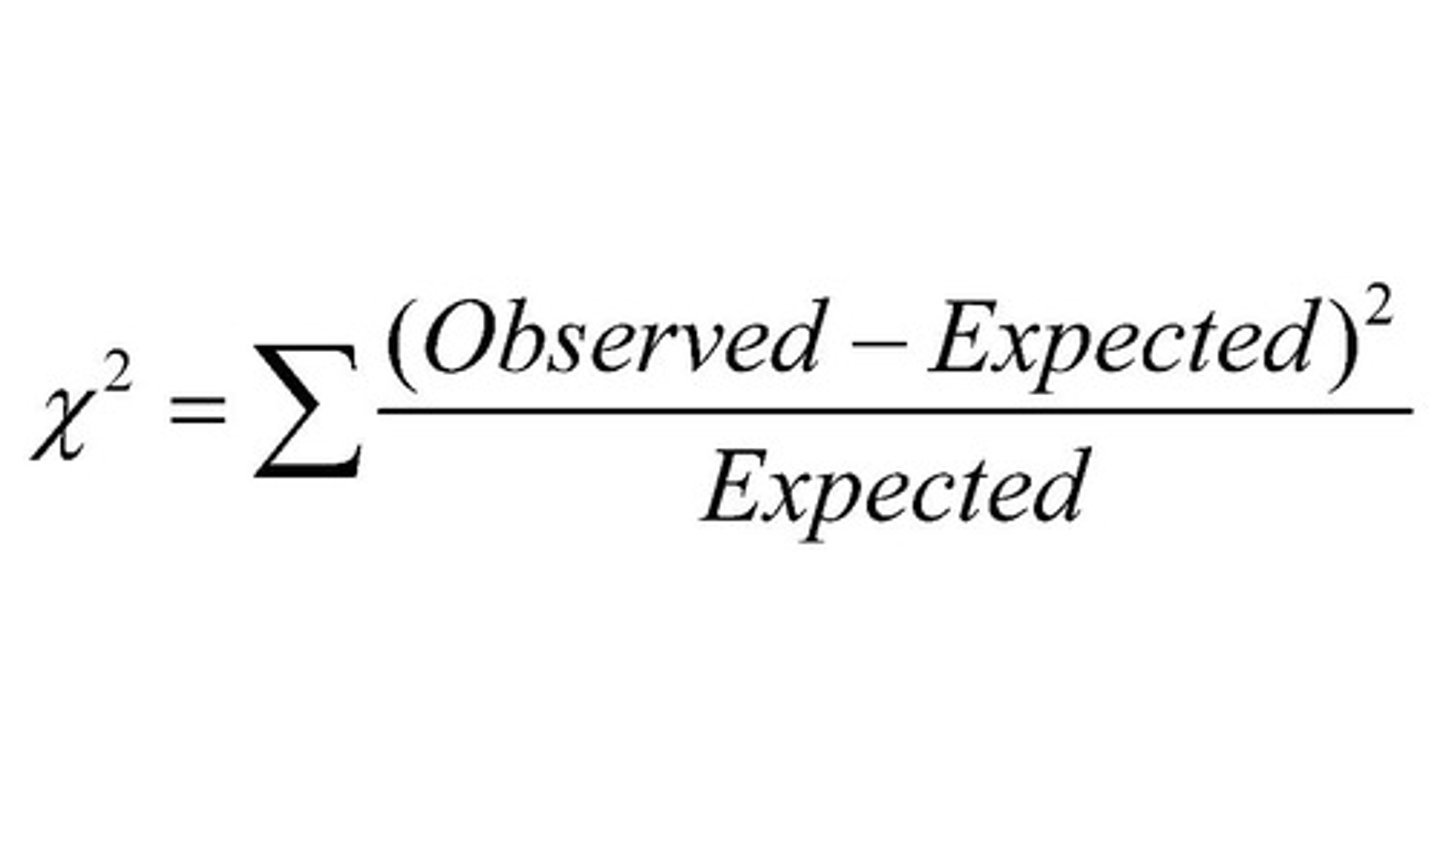
chi-squared test is used when... tests the....
Used when both "x" and "y" are discrete variables.
Tests the independence of two categorical variables.
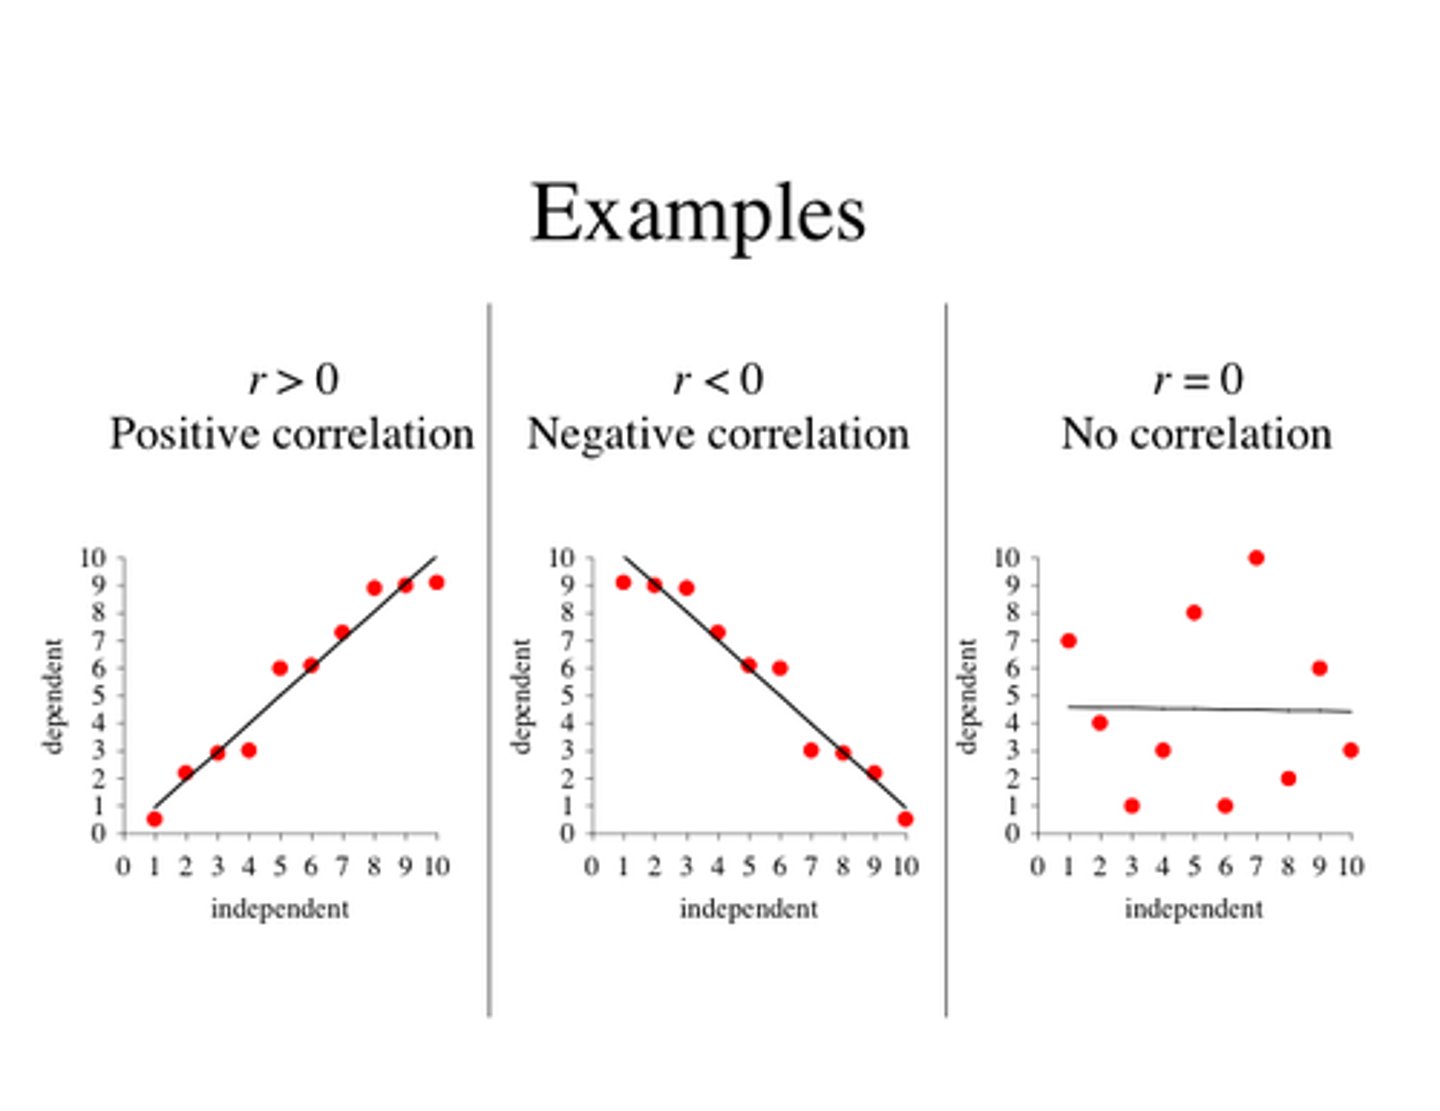
pearson correlation is used when... measures the...
Used when "x" has multiple values (continuous).
Measures the strength and direction of a linear relationship between two continuous variables.
standard error
a measure of the average distance that the observed values fall from the regression line (or predicted values) in a regression model. In simpler terms, it tells us how much the data points deviate from the line of best fit.
A small standard error means that the predicted values are close to the observed values, indicating that the regression model has high precision.
A large standard error suggests that there is more variability in the data and that the model's predictions are less reliable.
test statistic compares the ___ to the ____. If it's large enough, we can... the null hypothesis
Test Statistic compares the estimate (e.g., regression slope) to the Standard Error. If the statistic is large enough, we can reject the null hypothesis.
What are the limits of descriptive statistics? (3)
Causality: Descriptive statistics cannot demonstrate causal relationships. They only describe the data at hand, and while they can help highlight patterns, they do not explain why those patterns exist.
Trends: They do not help identify or explain trends over time or across larger units of analysis.
Argument Support: While descriptive statistics can be used in support of larger arguments, they do not stand alone in proving causality.
Goal of research design
Choosing the Right Methods: Selecting the most appropriate techniques and approaches to address the research question effectively.
Controlling for Competing Explanations: Identifying and accounting for other factors or variables that might influence the outcome, to ensure that the observed relationships are not confounded by other influences.
The problem of causality in self-selection
If individuals self-select into treatment or interventions, the observed outcomes may be influenced by pre-existing differences between the treated and non-treated groups. This complicates the ability to determine whether the treatment itself is causing the observed effect.
For example, individuals with higher incomes may be more likely to take part in tax incentive programs, but their success might be due to their pre-existing wealth rather than the program itself.
Reverse causality
here is also the problem of reverse causality (or endogeneity), where we assume that variable A causes B, but it could be that B actually causes A. This creates a "chicken and egg" situation, where it's unclear which variable is driving the other.
For example, if you hypothesize that good health leads to high levels of exercise, but maybe it’s actually exercise that causes better health, reverse causality can distort your conclusions.
selection bias
the observed effect of the treatment is confounded by pre-existing differences.
For example, if individuals choose to go to the hospital only when they are already sick, their health outcomes after the visit may not reflect the treatment's actual effect but rather the severity of their illness when they chose to seek help.