HCS 202 Stats by Chat
1/71
There's no tags or description
Looks like no tags are added yet.
Name | Mastery | Learn | Test | Matching | Spaced |
|---|
No study sessions yet.
72 Terms
Single-sample t test is used to compare _
one sample mean to a known population mean
Dependent/Paired-samples t test is used when _
same participants are measured twice or matched pairs
Independent-samples t test is used to compare _
the means of two unrelated groups
Degrees of freedom for single sample and dependent t tests = _
N − 1
Degrees of freedom for independent samples t test = _
N₁ + N₂ − 2
In Jamovi, single sample t tests compare _
sample mean to a population mean
In Jamovi, dependent t tests compare _
two related conditions within subjects
In Jamovi, independent t tests compare _
two separate groups
Cohen’s d formula for single/dependent t tests = _
mean difference ÷ SD of differences
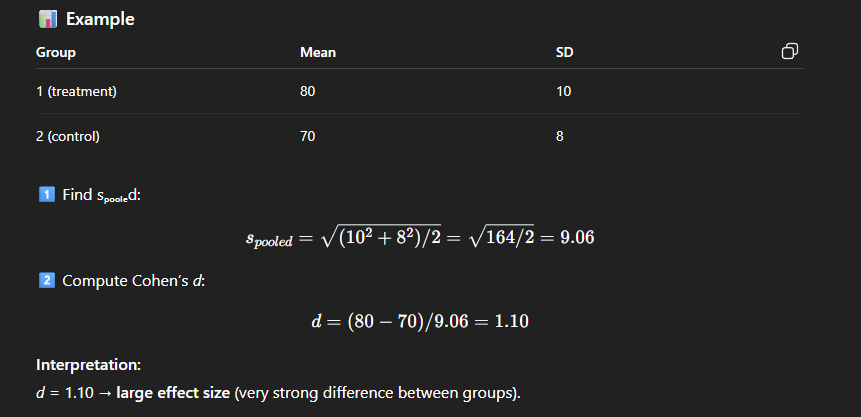
Cohen’s d formula for independent t tests = _
(M₁ − M₂) ÷ sₚₒₒₗₑd
M → Mean of each group
Spooled → Average of two groups variance
Cohen’s d ≈ 0.20 means _
small effect
Cohen’s d ≈ 0.50 means _
medium effect
Cohen’s d ≥ 0.80 means _
large effect
APA format for reporting t = _
t(df) = value, p < .05 (all italic and lowercase)
In APA results, always answer _
Was null rejected, how big was effect, what type of error possible
A large |t| value means _
greater difference relative to error → likely reject H₀
Assumption for all t tests includes _
independence of observations
Single-sample t test assumption
normality of the sample distribution;
Pass Condition = Shapiro p > .05
Dependent t test assumption
normality of the difference scores;
Pass Condition = Shapiro p > .05
Independent t test assumptions
Normality and homogeneity of variance (Levene’s test);
Pass Condition = Shapiro p > .05 and Levene p > .05
Levene’s test p > .05 means _
homogeneity assumption met
Formula for t = _
(observed difference) ÷ standard error
If p < .05 then _
reject the null hypothesis
If p > .05 then _
fail to reject the null hypothesis
Confidence interval bounds are found by _
LB = M − MOE, UB = M + MOE
M → Sample Mean; MOE → Margin of Error (t * SE)
A wide CI means _
less precision in the estimate
CI includes zero → _
difference is not statistically significant
One-tailed test is used when _
prediction is in a specific direction
Two-tailed test is used when _
any difference is being tested
Critical region for one-tailed test _
in one tail of the distribution
Critical region for two-tailed test _
split across both tails
In Jamovi output, check for _
t, p, df, mean difference, CI, effect size
For independent samples, Jamovi also shows _
Levene’s test for equal variances
To interpret Jamovi results, say _
which test used, if significant, effect size, assumptions met
Normality should be checked _
twice (before and after splitting groups)
Effect size tells _
practical importance of the finding
Statistical significance tells _
probability that result occurred by chance
A Type I error occurs when _
null is true but rejected = we found a false effect
A Type II error occurs when _
null is false but not rejected = we missed the real effect
Increasing sample size _
reduces sampling error and increases power
Jamovi output shows a variable measured twice for the same people → use _ test
paired/dependent samples t test
Jamovi output shows two unrelated groups (e.g., male vs female) → use _ test
independent samples t test
Jamovi output compares one sample mean to a known μ = 50 → use _ test
single sample t test
If Jamovi output includes “Levene’s Test for Equality of Variances” → assumption being checked = _
homogeneity of variance
If Levene’s p > .05 → variances are _ and the regular t test row is used
equal
If Levene’s p < .05 → variances are _ and Welch’s t row is used
unequal
Jamovi output with p = 0.021 (< .05) → result is _
statistically significant (reject H₀)
Jamovi output with p = 0.41 (> .05) → result is _
not significant (fail to reject H₀)
If CI includes 0 → effect is _
not significant
If CI does not include 0 → effect is _
statistically significant
Jamovi shows Cohen’s d = 0.18 → effect size is _
small
Jamovi shows Cohen’s d = 0.55 → effect size is _
medium
Jamovi shows Cohen’s d = 0.95 → effect size is _
large
If the research design measures the same participants twice (pre/post) → use _
dependent samples t test
If comparing two separate classes or groups → use _
independent samples t test
If comparing one sample to a population mean → use _
single sample t test
To calculate t in Jamovi → the software first computes _ and then divides the mean difference by it
standard error
Interpretation of df = 37 means _ were used in a single/dependent test
38 participants (N – 1 = 37)
Interpretation of df = 22 in an independent test → total participants = _
24 (N₁ + N₂ – 2 = 22)
In Jamovi, choose “Paired Samples t-test” when _
each row represents the same person’s two scores
In Jamovi, choose “Independent Samples t-test” when _
grouping variable separates different people
In Jamovi, choose “One Sample t-test” when _
testing a sample mean against a fixed value
If data violates normality slightly but n > 30 → _ still applies because of the Central Limit Theorem
t test
Jamovi output reports 95 % CI [ 2.3, 5.7 ] → we are _ % confident true mean difference lies between those values
95
Jamovi APA result example → t(38) = 6.58, p < .05 means _
null rejected → significant difference
If t(24) = 1.32, p = .19 → _ the null hypothesis
fail to reject
When reporting in APA, t and p are always and
italicized, lowercase
When normality and homogeneity assumptions are met → results are _
valid and trustworthy
When assumptions are violated → interpret results with _
caution
Jamovi Question → Which test uses Levene’s? Answer = _
independent samples t test
Jamovi Question → Which test checks normality of difference scores? Answer = _
dependent samples t test
Jamovi Question → Which test uses only one column of data vs known mean? Answer = _
single sample t test