data reduction
1/16
There's no tags or description
Looks like no tags are added yet.
Name | Mastery | Learn | Test | Matching | Spaced |
|---|
No study sessions yet.
17 Terms
data types
Nominal e.g. fluvial or answer to yes or no Q
Ordinal - e.g. 1,2,3
Continuous - interval and ratio e.g. mass, time, concentration, distance
scalar - isolated value that represents something e.g. height or weight
internal data
differences between measurements, but no true zero
ratio data
differences between measurements, the true zero exists
raw data
can not manage
difficult to see patterns
need to process it
use descriptive stats e.g. most common value
data assessment
min, max, range, middle values ?
plot data
outliers ?
trends/patterns ?
frequency data - histograms
how many of each value / class in the sample
for nominal and ordinal data - counting occurrences
frequency distribution - what is the shape ?
central tendency
middle values
dispersion
how spread are the values
central values
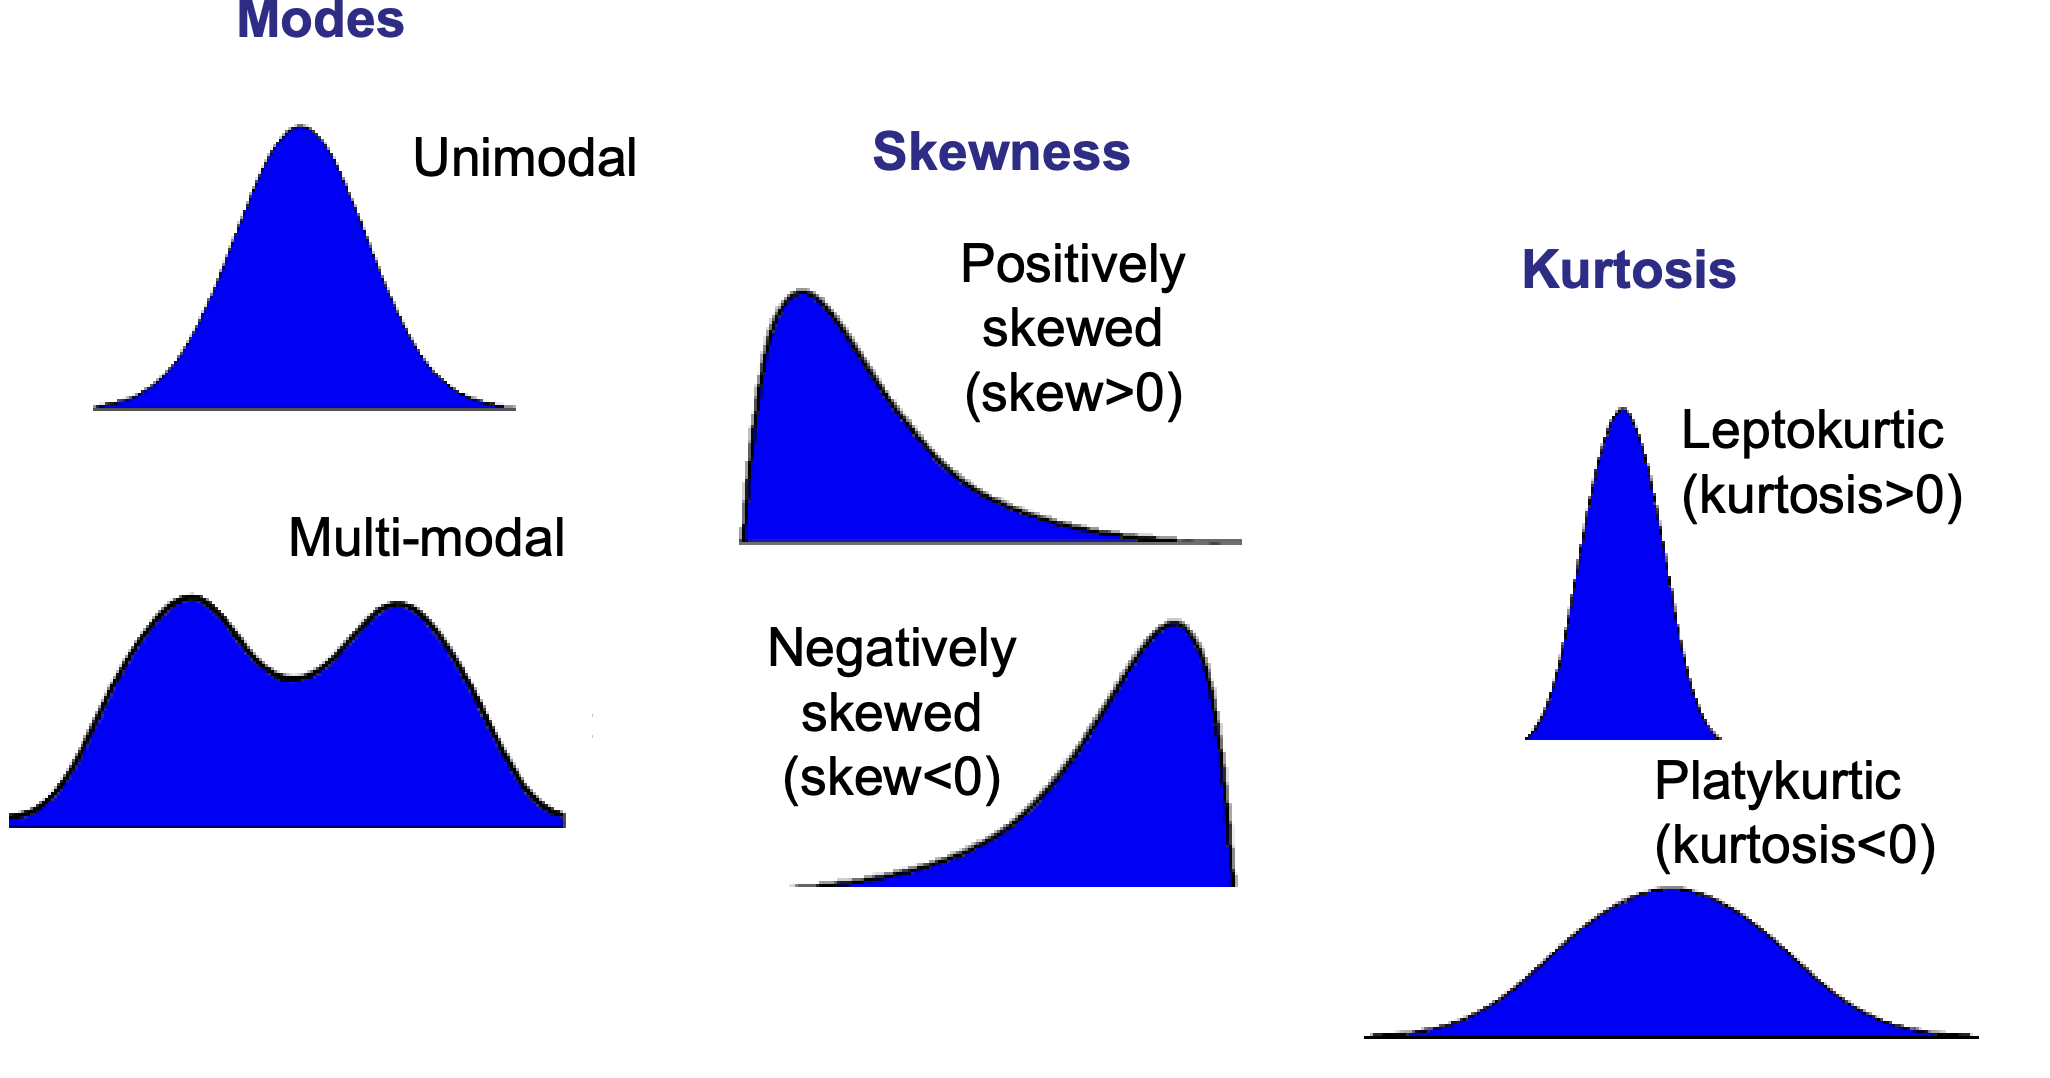
most useful if distribution is peak-shaped - cluster around centre
unimodal distributions are common
most values - central values - some variation on either side e.g. height
measures of central tendency
median, mode, mean
relationship of mean, median and mode
symmetrical unimodal distribution
mean = median = mode
non-symmetrical (skewed - unimodal distribution of values
leptokurtic = more than 0
platykurtic = less than 0
measure of dispersion when using media
interquartile range
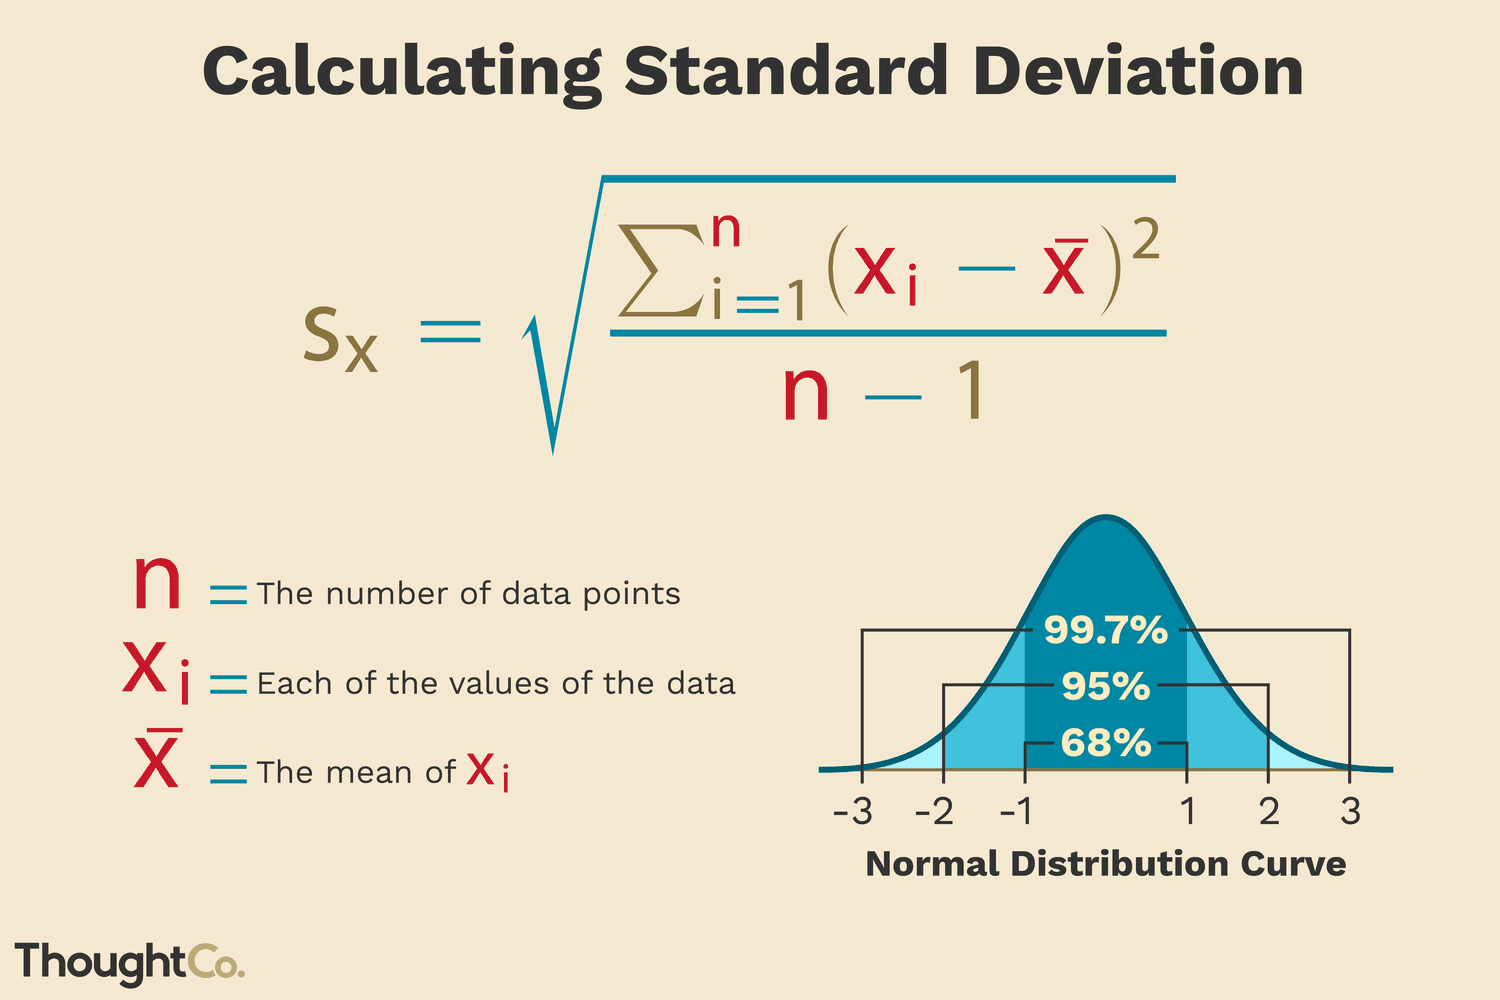
measure of dispersion when using mean
standard deviation
interval scale data
unimodal
comparing standard deviations - coefficient of variation
useful if 2 values have 2 different means or 2 different scales
to do this divide standard deviation by mean then multiply by 100 for both samples
see which one has more variation - the one with higher percentage
moments of distribution
moments are indicators if the distribution shape - linked by powers of differenced
the s on the pic = standard deviation

uncertainty
measurements naturally lead to uncertainty
unavoidable
include uncertainty estimated
weighing provides a measure of importance
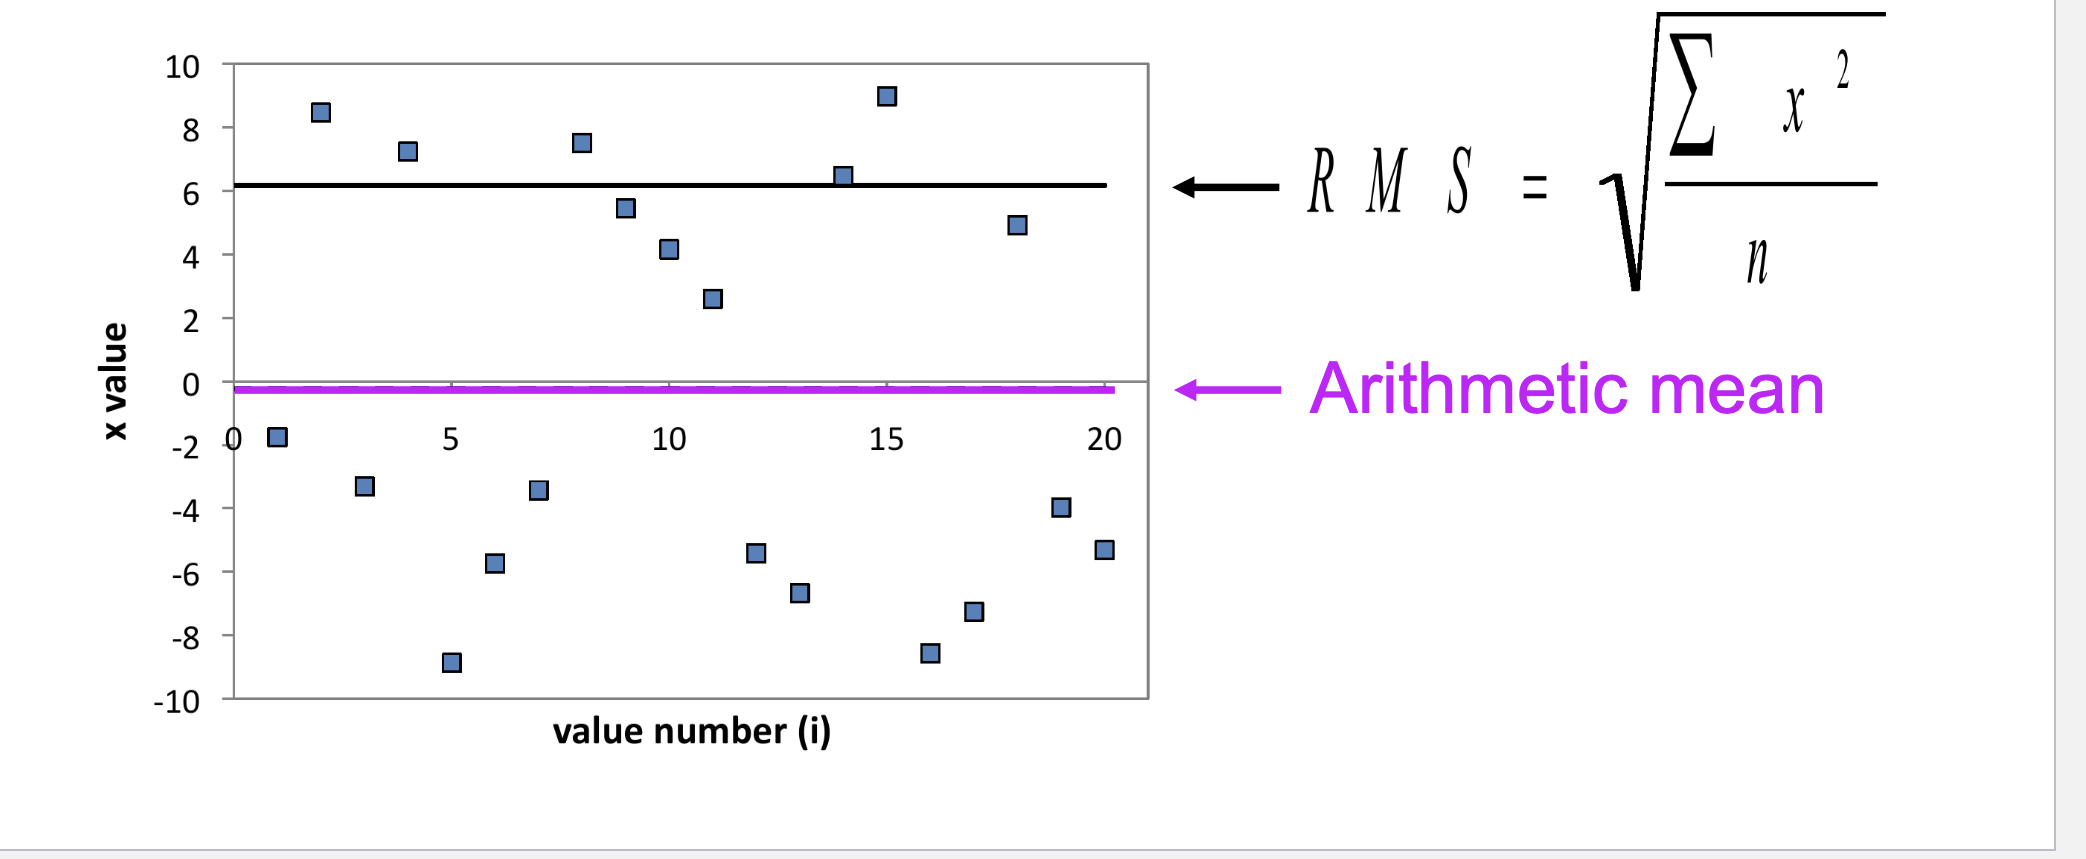
root mean squared
if values fall above and below zero - will be in the middle of the values
sometimes useful to know absolute magnitude of the values - how far the values are from 0
rms - achieves this by taking the average of the squared values